
三色指标和最大程度简化写入指标的一些方法

简介
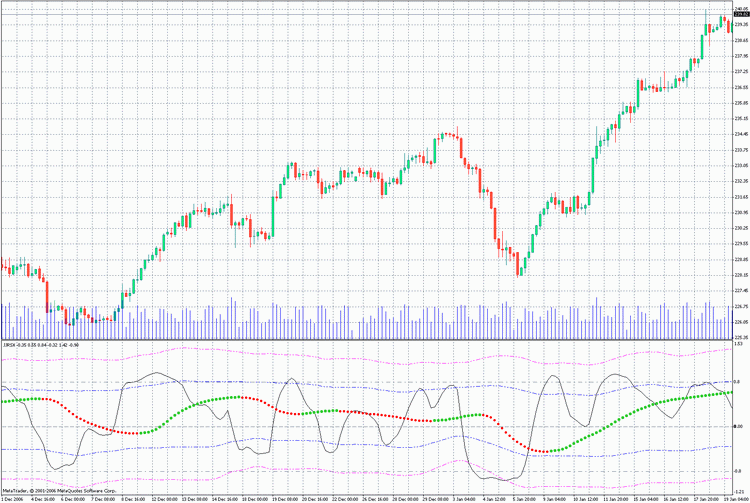
很多情况下,颜色仍是最好的信息源。它以非常生动而又快捷的方式更改信号,以此反映当前市场特征的变化。这就是三色趋势指标通常比单色类似指标表现得更具信息量也更高效的原因。我们来看一看以下两种形式表示的例子:
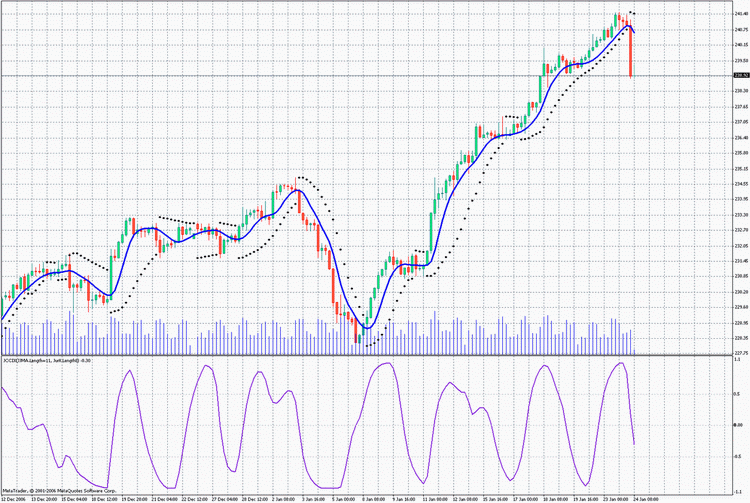
使用无色的趋势方向指标的普通版本:
使用指标颜色随趋势方向变化的版本:
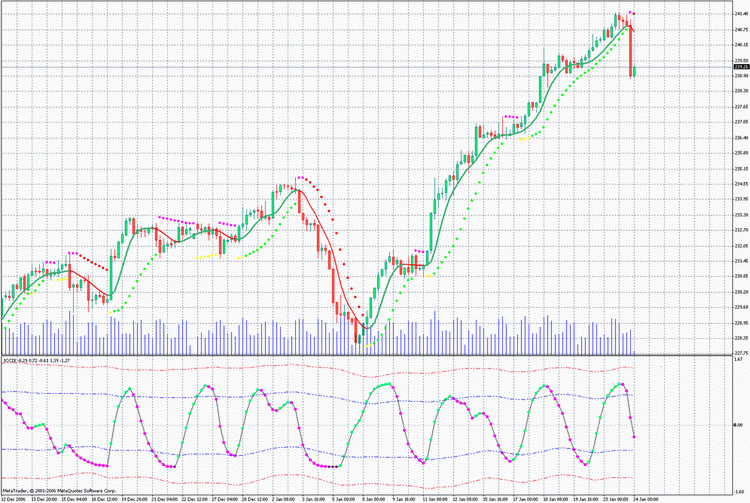
您会发现,第二种图表用起来显然更方便、更清晰明了。在 MQL4 中构建此类指标不会产生任何问题,也不会大幅加剧资源消耗。由此可见,如果在交易时不采用这种方法,则意味着无法精简持续观察市场状况时的繁重工作量。
让我们看看如何构建这种指标。
三色指标 3c_JJRSX1
首先,根据振荡指标 JJRSX 构建一个三色线性图:
iCustom(NULL,0,"JJRSX",Length,Smooth,Smooth_Phase,
        Input_Price_Customs,0,bar).
编写一个三色类似指标以用不同的颜色指示趋势的变化,这应该没有任何问题::
/*
For the operation of the indicator place the files
JJMASeries.mqh
JurXSeries.mqh
PriceSeries.mqh
into the folder (directory): MetaTrader\experts\include\
Heiken Ashi#.mq4
into the folder (directory): MetaTrader\indicators\
*/
//+------------------------------------------------------------------+
//|                                                    3c_JJRSX1.mq4 |
//|                           Copyright c 2006,     Nikolay Kositsin |
//|                              Khabarovsk,   farria@mail.redcom.ru |
//+------------------------------------------------------------------+
#property copyright "Copyright c 2006, Nikolay Kositsin"
#property link      "farria@mail.redcom.ru"
//---- drawing the indicator in a separate window
#property indicator_separate_window
//---- number of the indicator buffers
#property indicator_buffers  3
//---- colors of the indicator
#property indicator_color1  BlueViolet
#property indicator_color2  Magenta
#property indicator_color3  Gray
//---- width of the indicator lines
#property indicator_width1 3
#property indicator_width2 3
#property indicator_width3 3
//---- parameters of the horizontal levels of the indicator
#property indicator_level1  0.5
#property indicator_level2 -0.5
#property indicator_level3  0.0
#property indicator_levelcolor MediumBlue
#property indicator_levelstyle 4
//---- INPUT PARAMETERS OF THE INDICATOR
extern int        Length = 8;  // depth of the indicator smoothing
extern int        Smooth = 3; // depth of the additional JMA smoothing
// changing within the limits -100 ... +100,
// influences the quality of the transient process;
extern int  Smooth_Phase = 100;
/* Selecting prices, based on which the indicator will be calculated
(0-CLOSE, 1-OPEN, 2-HIGH, 3-LOW, 4-MEDIAN, 5-TYPICAL, 6-WEIGHTED,
7-Heiken Ashi Close, 8-SIMPL, 9-TRENDFOLLOW, 10-0.5*TRENDFOLLOW,
11-Heiken Ashi Low, 12-Heiken Ashi High, 13-Heiken Ashi Open,
14-Heiken Ashi Close.) */
extern int Input_Price_Customs = 0;
//---- indicator buffers
double Ind_Buffer1[];
double Ind_Buffer2[];
double Ind_Buffer3[];
//+------------------------------------------------------------------+
//| JJRSX initialization function                                    |
//+------------------------------------------------------------------+
int init()
  {
// styles of drawing the indicator
   SetIndexStyle(0,DRAW_HISTOGRAM, STYLE_SOLID);
   SetIndexStyle(1,DRAW_HISTOGRAM, STYLE_SOLID);
   SetIndexStyle(2,DRAW_HISTOGRAM, STYLE_SOLID);
// 4 indicator buffers are used for calculation
   SetIndexBuffer(0,Ind_Buffer1);
   SetIndexBuffer(1,Ind_Buffer2);
   SetIndexBuffer(2,Ind_Buffer3);
// setting the indicator values, which will be invisible on the chart
   SetIndexEmptyValue(0,0);
   SetIndexEmptyValue(1,0);
   SetIndexEmptyValue(2,0);
// names for window data and labels for subwindows
   SetIndexLabel(0,"Up_Trend");
   SetIndexLabel(1,"Down_Trend");
   SetIndexLabel(2,"Straight_Trend");
   IndicatorShortName("JJRSX(Length="+Length+")");
// Setting the format of accuracy (number of signs after a decimal point)
//for the visualisation of the indicator values
   IndicatorDigits(0);
// correction of the invalid value of the parameter Length
  if(Length<1)Length=1;
// setting the bar number, starting from which the indicator will be drawn
   int draw_begin=3*Length+30+1;
   SetIndexDrawBegin(0,draw_begin);
   SetIndexDrawBegin(1,draw_begin);
   SetIndexDrawBegin(2,draw_begin);
//---- end of the initialization
return(0);
  }
//+------------------------------------------------------------------+
//| JJRSX iteration function                                         |
//+------------------------------------------------------------------+
int start()
  {
// Declaration of the integer statistic variables
   static int time2;
// Declaration of the decimal static variables
   static double ValueM;
// Declaration of the decimal variables
    double Value0,Value1,trend;
// Declaration of the integer variables and retrievement of the calculated bars
    int bar,limit,MaxBar,Tnew,counted_bars=IndicatorCounted();
// check for errors
    if (counted_bars<0)return(-1);
// the last calculated bar should be recalculated
    if (counted_bars>0) counted_bars--;
// defining the number of the oldest bar,
// starting from which all bars will be recalculated
    MaxBar=Bars-3*Length-30;
    //---- defining the number of the oldest bar,
    //starting from which all new bars will be recalculated
    limit=Bars-counted_bars-1;
    //+--- zero initialization
    if (limit>=MaxBar)
      for(bar=Bars-1;bar>=MaxBar;bar--)
       {
        limit=MaxBar;
        Ind_Buffer1[bar]=0.0;
        Ind_Buffer2[bar]=0.0;
        Ind_Buffer3[bar]=0.0;
       }
//+--- retrieving the variable values
    Tnew=Time[limit+1];
    if (limit<MaxBar)
    if (Tnew==time2)
     {
      Value1=ValueM;
     }
    else
     {
      if (Tnew>time2)
           Print("Error in retrieving variables!!! Tnew>time2");
      else Print("Error in retrieving variables!!! Tnew");
      Print("Indicators will be recounted on all bars!!");
      return(-1);
     }
//----+ THE MAIN CYCLE OF CALCULATING INDICATORS
    while (bar>=0)
      {
       //+--- Saving the variables values +====+
     if (bar==1)
      {
       if(((limit==1)&&(time2==Time[2]))||(limit>1))
         {
          ValueM=Value1;
          time2=Time[bar];
         }
      }
     //+---+====================================+
        Value0=iCustom(NULL,0,"JJRSX",Length,Smooth,Smooth_Phase,
                       Input_Price_Customs,0,bar);
        if (bar==MaxBar)
          {
           Value1=Value0;
           continue;
          }
        //---- Tricolor indicator code
        trend=Value0-Value1;
        if(trend>0)
          {
            Ind_Buffer1[bar]=Value0;
            Ind_Buffer2[bar]=0;
            Ind_Buffer3[bar]=0;
          }
        else
          {
            if(trend<0)
              {
                Ind_Buffer1[bar]=0;
                Ind_Buffer2[bar]=Value0;
                Ind_Buffer3[bar]=0;
              }
            else
              {
                Ind_Buffer1[bar]=0;
                Ind_Buffer2[bar]=0;
                Ind_Buffer3[bar]=Value0;
              }
          }
        //----
        Value1=Value0;
        //----+
        bar--;
     }
    //---- end of the calculation of the indicator values
    return(0);
  }
//+--------------------------------------------------------------+
指标使用了三个指标缓冲区,对于第一根柱体上的源指标 JJRSX 的值,使用了重要的 Value1。不要丢失两次价格跳动之间的变量 Value1 的值,此值保存在静态变量 ValueM 中。指标的算法将指标当前值与上一根柱体上的值相比较,并将此值放入必要的指标缓冲区内。要根据另一个自定义指标构建类似指标,只需在自定义指标的参考行内更改自定义指标的名称。
Value0=iCustom(NULL,0,"JJRSX",Length,Smooth,Smooth_Phase,
               Input_Price_Customs,0,bar);
在行
MaxBar = Bars - 3*Length - 30;
中,更改计算公式,并在初始化块中更改行
int draw_begin = 3*Length + 30 + 1;
中的计算公式。当然还要将外部变量更改为所需的变量。您可添加指标 BollingerBands 和将指标形式从线性图更改为点图的选项,使图表包含更多信息。此外,如果将此指标用作一个模板,则在搜索程序代码内有必要修改的行时会有一些不便之处,在其他三色图表中这些行不会更改。较为合理的方法是将该程序代码放到 mqh 文件中,并使用运算符 #include 在指标中使用该代码。让我们开始做吧。在这种情况下,指标代码获得了一个简单的形式,没有任何多余的元素。可轻松将其作为一个模板,写入其他振荡指标图:
/*
For the operation of the indicator place files
JJMASeries.mqh
PriceSeries.mqh
3c_BB_Osc.mqh
into folder (directory): MetaTrader\experts\include\
JJRSX.mq4
Heiken Ashi#.mq4
nto folder (directory): MetaTrader\indicators\
*/
//+------------------------------------------------------------------+
//|                                                     3c_JJRSX.mq4 |
//|                               Copyright © 2006, Nikolay Kositsin |
//|                              Khabarovsk,   farria@mail.redcom.ru |
//+------------------------------------------------------------------+
#property copyright "Copyright © 2006, Nikolay Kositsin"
#property link      "farria@mail.redcom.ru"
//---- drawing the indicator in a separate window
#property indicator_separate_window
//---- number of the indicator buffers
#property indicator_buffers 8
//---- colors of the indicator
#property indicator_color1 Gray
#property indicator_color2 LimeGreen
#property indicator_color3 Red
#property indicator_color4 Purple
//---- Bollinger Bands colors
#property indicator_color5 Blue
#property indicator_color6 Blue
#property indicator_color7 Magenta
#property indicator_color8 Magenta
//---- width of the indicator lines
#property indicator_width1 2
#property indicator_width2 2
#property indicator_width3 1
#property indicator_width4 1
//---- style of the envelope line
#property indicator_style1 4
//---- style of Bollinger Bands line
#property indicator_style5 4
#property indicator_style6 4
#property indicator_style7 4
#property indicator_style8 4
//---- parameters of horizontal lines of the indicator
#property indicator_level1 0.0
#property indicator_levelcolor SteelBlue
#property indicator_levelstyle 4
//---- INPUT PARAMETERS OF THE INDICATOR
extern int  Length = 8;  // depth of JurX indicator smoothing
// depth of JJMA smoothing of the retrieved indicator
extern int  Smooth = 3;
// parameter changing within limits -100 ... +100, influences
// the quality of transient processes of smoothing
extern int  Phase = 100;
/* Selecting colors, based on which the indicator is calculated
(0-CLOSE, 1-OPEN, 2-HIGH, 3-LOW, 4-MEDIAN, 5-TYPICAL, 6-WEIGHTED,
7-Heiken Ashi Close, 8-SIMPL, 9-TRENDFOLLOW, 10-0.5*TRENDFOLLOW,
11-Heiken Ashi Low, 12-Heiken Ashi High,  13-Heiken Ashi Open,
14-Heiken Ashi Close.) */
extern int Input_Price_Customs = 0;
//---- Declaration of the function COUNT_begin() for counting the bar number,
// starting from which the indicator will be drawn and
// Bollinger Bands wikk be calculated
int COUNT_begin()
{int count_begin=2*Length+30;return(count_begin);}
//---- declaration of the function digits() for setting the accuracy format
// (number of signs after a decimal point) for the visualization
// of the indicator values
int digits(){return(2);}
//---- setting the indicator values, which will be invisible on the chart
int EmptyValue=0.0;
//---- Declaration of the name of the indicator
string Label = "JJRSX";

//---- Including into the indicator text its main text
#include <3c_BB_Osc.mqh>
//---- declaration of the function INDICATOR
//---- reference to the source indicator for retrieving the source values
double INDICATOR(int INDICATOR.bar)
 {
  return(iCustom( NULL, 0, "JJRSX", Length, Smooth, Phase,
         Input_Price_Customs, 0, INDICATOR.bar) );
 }
//---- ---------------------------------------------------------------+
多余的代码被放在文件 3c_BB_Osc.mqh 中,并在指标中仅用一条线来表示。
#include <3c_BB_Osc.mqh>
mqh 文件还包含 Bollinger Bands 的外部变量和用于选择图表呈现样式的外部变量。文件 3c_BB_Osc.mqh 默认必须放在文件夹:\MetaTrader\EXPERTS\INCLUDE 中。
构建三色指标的算法
现在,要创建一个新的三色振荡指标,您只需将此文件用一个新的文件名保存到文件夹 \MetaTrader\EXPERTS\indicators 下,并进行以下更改:
1.选择指标元素的所需颜色以及其他参数;
2.插入指标的新输入参数,可从自定义指标中复制这些参数;
3.将公式插入到函数 COUNT_begin() 内以计算开始柱体(通常插入指标的外部变量就足够了,该变量确定了带有对振荡指标进行额外平滑处理的变量的变量的周期或和);
4.将必要的指标精度值插入到行
digits()
  {
    return(2);
  }
中。如果指标从 0 变为 100,插入 0,如果指标从 0 变为 1,插入 2(小数点后两个符号!);
5.设置指标值,这些值在图表上不可见;
6.为指标创建一个名称;
7.将参考插入到自定义指标 iCustom() 中。之后编译代码,指标就准备就绪了!
还有一件您可能要做改动的事,就是使振荡指标的外形变得更平滑一点。对于这种情况,只需在指标文本中 mqh 文件的名称中添加字母 "J",原本是:
#include <3c_BB_Osc.mqh>
现在是
#include <3c_BBJ_Osc.mqh>
使用 JMA 编译文件时,将对自定义振荡指标进行平滑处理。
三色指标 3c_JJRSX2
您可进一步改进此指标。再添加一个单色快速 JJRSX 是相当方便和合理的。让我们按照示例中的类似情况将指标分为两个部分,将代码部分放到 mqh 文件中,这将最大程度简化对指标 (3c_BB_Osc2. mqh) 的感知:
/*
For the operation of the indicator place the files
JJMASeries.mqh
JurXSeries.mqh
PriceSeries.mqh
3c_BB_Osc2.mqh
into the folder (directory): MetaTrader\experts\include\
JJRSX.mq4
Heiken Ashi#.mq4
into the folder (directory): MetaTrader\indicators\
*/
//+------------------------------------------------------------------+
//|                                                    3c_JJRSX2.mq4 |
//|                               Copyright c 2006, Nikolay Kositsin |
//|                              Khabarovsk,   farria@mail.redcom.ru |
//+------------------------------------------------------------------+
#property copyright "Copyright c 2006, Nikolay Kositsin"
#property link      "farria@mail.redcom.ru"
//---- drawing the indicator in a separate window
#property indicator_separate_window
//---- the number of the indicator buffers
#property indicator_buffers 8
//---- colors of the indicator
#property indicator_color1 Gold
#property indicator_color2 LimeGreen
#property indicator_color3 Red
#property indicator_color4 Purple
//---- Bollinger Bands colors
#property indicator_color5 Blue
#property indicator_color6 Blue
#property indicator_color7 Magenta
#property indicator_color8 Magenta
//---- width of the indicator lines
#property indicator_width1 1
#property indicator_width2 2
#property indicator_width3 1
#property indicator_width4 1
//---- style of the envelope line
#property indicator_style1 4
//---- style of Bollinger Bands lines
#property indicator_style5 4
#property indicator_style6 4
#property indicator_style7 4
#property indicator_style8 4
//---- parameters of the horizontal levels of the indicator
#property indicator_level1  0.0
#property indicator_level2  0.8
#property indicator_level3 -0.8
//---- INPUT PARAMETERS OF THE INDICATOR
//---- input parameters of the quick monochromic JJRSX
extern int  Length1 = 8;  // depth of JurX smoothing of the indcator
// depth of JJMA smoothing of the retrieved indicator
extern int  Smooth1 = 3;
// parameter changing within limits -100 ... +100,
//influences the quality of transient process of smoothing
extern int  Phase1 = 100;
//Selecting prices, based on which the indicator will be calculated
extern int Input_Price_Customs1 = 0;
/*(0-CLOSE, 1-OPEN, 2-HIGH, 3-LOW, 4-MEDIAN, 5-TYPICAL, 6-WEIGHTED,
7-Heiken Ashi Close, 8-SIMPL, 9-TRENDFOLLOW, 10-0.5*TRENDFOLLOW,
11-Heiken Ashi Low, 12-Heiken Ashi High,  13-Heiken Ashi Open,
14-Heiken Ashi Close.) */
//---- input parameters of the slow tricolor JJRSX
extern int  Length2 = 40;  // depth of JurX smoothing of the inidcator
// depth of JJMA smoothing of the retrieved indicator
extern int  Smooth2 = 12;
// parameter changing within limits -100 ... +100,
// influences the quality of transient process of smoothing
extern int  Phase2 = 100;
// Selecting prices, based on which the indicator will be calculated
extern int Input_Price_Customs2 = 0;
/*(0-CLOSE, 1-OPEN, 2-HIGH, 3-LOW, 4-MEDIAN, 5-TYPICAL, 6-WEIGHTED,
7-Heiken Ashi Close, 8-SIMPL, 9-TRENDFOLLOW, 10-0.5*TRENDFOLLOW,
11-Heiken Ashi Low, 12-Heiken Ashi High,  13-Heiken Ashi Open,
14-Heiken Ashi Close.)*/
//---- The style of performing the horizontal lines of the indicators
extern int    Levels_Style = 3;         // Style of levels lines
extern int    Levels_Width = 0;         // Width of leevls lines
extern color  Levels_Color = SlateGray; // color of levels lines
//---- Declaration of the function COUNT_begin() for counting the bar number,
// starting from which the indicator will be drawn and
// Bollinger Bands will be calculated
int COUNT_begin(){int count_begin=2*Length2+30;return(count_begin);}
//---- declaration of the function digits() for setting the accuracy format
//(number of signs after the decimal point) for the visualization of the
//indicator values
int digits(){return(2);}
//---- setting the indicator values, which will be invisible on the chart
int EmptyValue=0.0;
//---- Determining the indicator name
string Label = "JJRSX";

//---- Including into the indicator text its main text
#include <3c_BB_Osc2.mqh>
//---- declaration of the function INDICATOR1
//---- reference to the source indicator for retrieving source values
double INDICATOR1(int INDICATOR1.bar)
 {
  return(iCustom( NULL, 0, "JJRSX", Length1, Smooth1, Phase1,
         Input_Price_Customs1, 0, INDICATOR1.bar) );
 }
//---- declaration of the function INDICATOR2
//---- reference to the source indicator for retrieving source values
double INDICATOR2(int INDICATOR2.bar)
 {
  return(iCustom( NULL, 0, "JJRSX", Length2, Smooth2, Phase2,
         Input_Price_Customs2, 0, INDICATOR2.bar) );
 }
//---- --------------------------------------------------------------+
指标代码并未变得非常复杂,现在它包括自定义指标 JJRSX 的两个参考以及两组外部指标参数,等于 JJRSX 指标的数量。用这些指标作为模板,基于其他一些振荡指标构建类似图表,这应该不会有什么问题。
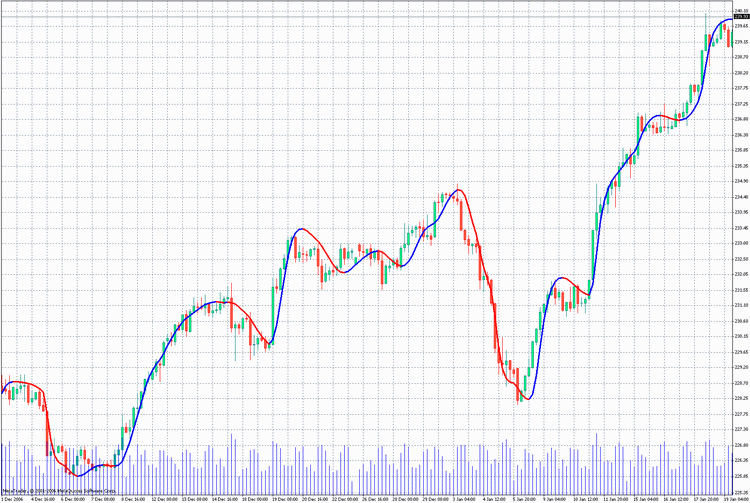
三色移动平均线
现在,让我们详细说明写入三色移动平均线的不同情形。在第一个站点,我们可以编写一个与第一个示例中所述代码完全类似的代码。但上一个图表会有一个缺点:如果移动方向在各柱体上出现变化,将出现不正常的颜色并列现象。弥补此缺点的唯一方法再加三个缓冲区!如果把多余的代码放入 mqh 文件中,三个额外的缓冲区不会使此类指标变得过长。至于编写三色移动平均线,情况与上一例完全相同:
/*
For the operation of the indicator place files
JJMASeries.mqh
PriceSeries.mqh
3Color.mqh
into folder (directory): MetaTrader\experts\include\
J2JMA.mq4
into folder (directory): MetaTrader\experts\indicators\
*/
//+------------------------------------------------------------------+
//|                                                     3c_J2JMA.mq4 |
//|                           Copyright c 2006,     Nikolay Kositsin |
//|                              Khabarovsk,   farria@mail.redcom.ru |
//+------------------------------------------------------------------+
#property copyright "Copyright c 2006, Nikolay Kositsin"
#property link "farria@mail.redcom.ru"
//---- drawing the indicator in the main window
#property indicator_chart_window
//---- number of indicator buffers
#property indicator_buffers 6
//---- indicator colors
#property indicator_color1 Blue
#property indicator_color2 Blue
#property indicator_color3 Red
#property indicator_color4 Red
#property indicator_color5 Gray
#property indicator_color6 Gray
//---- INPUT PARAMETERS OF THE INDICATOR
extern int Length1 = 5;   // depth of the first smoothing
extern int Length2 = 5;   // depth of the second smoothing
// parameter of the first smoothing, changing within limits -100 ... +100,
//influences the quality of the transient process;
extern int Phase1  = 100;
// parameter of the second smoothing, changing within limits -100 ... +100,
//influences the quality of the transient process;
extern int Phase2  = 100;
/* Choosing prices, based on which the indicator is calculated
(0-CLOSE, 1-OPEN, 2-HIGH, 3-LOW, 4-MEDIAN, 5-TYPICAL, 6-WEIGHTED,
7-Heiken Ashi Close, 8-SIMPL, 9-TRENDFOLLOW, 10-0.5*TRENDFOLLOW,
11-Heiken Ashi Low, 12-Heiken Ashi High,  13-Heiken Ashi Open,
14-Heiken Ashi Close.) */
extern int Input_Price_Customs = 0;
//---- declaration of the function digits() to set up the accuracy format
// (number of signs after the decimal point) for the visualization of the
// indicator values
int digits(){return(Digits);}
//---- Declaration of the function COUNT_begin() for calculation of the bar number,
//starting from which the indicator will be drawn
int COUNT_begin(){return(60);}
//---- setting the indicator parameters, which will be invisible on the chart
int  EmptyValue=0;
//---- lable for the indicator
string Label="J2JMA";
//---- inserting into the indicator text its main text
#include <3Color.mqh>
//---- declaration of the function INDICATOR
//---- reference to the source indicator to retrieve source values
double INDICATOR(int INDICATOR.bar)
 {
  return(iCustom(NULL,0,"J2JMA",Length1,Length2,Phase1,Phase2,0,
         Input_Price_Customs,0,INDICATOR.bar) );
 }
//---- --------------------------------------------------------------+
请注意,对于移动平均线,在设置移动平均线的精度格式时,不要更改任何东西!
int digits()
  {
    return(Digits);
  }
如果您要以树色形式呈现的移动平均线不稳定,可轻松对其进行平滑处理。只需将字母 "J" 添加到行
#include <3Color.mqh>
中。变成
#include <3ColorJ.mqh>
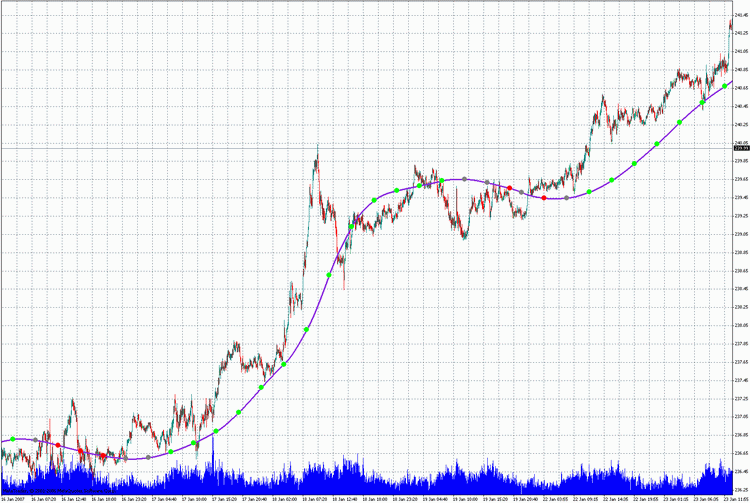
基于更大的时间框架构建的指标模板
这里还有两个基于更大的时间框架构建的指标模板,它们也可基于任何移动平均线或振荡指标进行构建。
//----+ - - - - - - - - - - - - - - - - - - - - - - - - - - - - - - -+
//Version  July 1, 2006                                              |
//Editing   Nikolay Kositsin  15.06.2006  farria@mail.redcom.ru      |
//----+ - - - - - - - - - - - - - - - - - - - - - - - - - - - - - - -+
/*
Building a moving average on the current timeframe based on another,
larger timeframe. Attention!!! Indicator values are recalculated not
on the last bar, but on the number of bars, equivalent to a
candlestick of the large timeframe!

For the operation of the indicator place files
JJMASeries.mqh
PriceSeries.mqh
HTF.mqh
into folder (directory): MetaTrader\experts\include\
J2JMA.mq4
Heiken Ashi#.mq4
into folder (directory): MetaTrader\indicators\
*/
//+------------------------------------------------------------------+
//|                                                    J2JMA_htf.mq4 |
//|                            Copyright c 2005, GS  Conversion only |
//|                    http://www.gustis.narod.ru/;     gsb51@mail.ru |
//+------------------------------------------------------------------+
#property copyright "  Copyright c 2005, GS  Conversion only"
#property link      " http://www.gustis.narod.ru/;     gsb51@mail.ru"
//---- drawing the indicator in the main window
#property indicator_chart_window
//---- number of indicator buffers
#property indicator_buffers  4
//---- indicator colors
#property indicator_color1 BlueViolet
#property indicator_color2 Lime
#property indicator_color3 Red
#property indicator_color4 Gray
//---- width of indicator lines
#property indicator_width1 3
#property indicator_width2 1
#property indicator_width3 1
#property indicator_width4 3
//---- style of indicator lines
#property indicator_style1 0
//---- INPUT PARAMETERS OF THE INDICATOR
//Parameters of custom indicator iCustom
extern int Length1 = 5;   // depth of the first smoothing
extern int Length2 = 5;   // depth of the second smoothing
// parameter of the first smoothing, changing within limits -100 ... +100,
//influences the quality of the transient process;
extern int Phase1  = 100;
// parameter of the second smoothing, changing within limits -100 ... +100,
//influences the quality of the transient process;
extern int Phase2  = 100;
//Choosing prices, based on which the indicator is calculated
extern int Input_Price_Customs = 0;
/*
//---- INPUT PARAMETERS HTF +--------------------------------------------+
extern int  TFrame_Period = 240; // The larger period in minutes
// smoothing of the moving average. The most optimal value is equal
// to the relation of the larger timeframe periods to the chart period
extern int         Smooth = 48;
extern bool Trend_Visible = true;// visualization of the trend indication
// minimal speed of the moving average, considered as a trend
extern int  Trend_Minimum = 5;
extern int         Shift  = 0;   // shift of the indicator along the time axis
*/
//---- declaration of the function digits() to set up the accuracy format
// (number of signs after the decimal point) for the visualization of the
// indicator values
int digits(){return(Digits);}
//---- setting the indicator parameters, which will be invisible on the chart
int EmptyValue=0;
string Label="J2JMA";
//---- inserting into the indicator text its main text
#include <HTF.mqh>
//---- declaration of the function INDICATOR
//---- reference to the source indicator to retrieve source values
double INDICATOR(int INDICATOR.bar)
 {
  return(iCustom(NULL,TFrame_Period,"J2JMA",Length1,Length2,Phase1,Phase2,
         0,Input_Price_Customs,0,INDICATOR.bar) );
 }
//---- -----------------------------------------------------------+
要正常使用移动平均线,两个图表都应打开!注意,两个图表上的历史数据必须来自同一个经纪人。
至于最后一个移动平均线,应该注意的是,尽管它看上去就是用来指示趋势的,但将其连接到 Expert Advisor(智能交易系统)毫无意义。无论它给出的前景有多美妙,那都不过是空中阁楼!重新计算移动平均线时,其依据并不是当前时间框架的最后一根柱体,而是更大的时间框架的最后一根柱体!正如预料的那样,这种徒劳的工作做得再多,也不会有任何成果!
在这种情况下,我们应阐明算法的要点,它是以此指标为基础的。用于构建指标的值取自于更大时间框架的柱体中。计算原始价格的平滑处理后,将检索值传递到较小的时间框架内,然后用线性内插法添加该较小时间框架缺乏的中间值。但由于图表采用折线形式,我们通常都想要对其进行平滑处理。这个工作就在此指标中执行!
完成这种转变之后,此曲线的外形将变得较为优美,但仍是根据较小时间框架(相当于较大时间框架内的一根烛柱)的柱数计算的。最后,要注意的是,将多余程序代码放入 mqh 文件的功能不仅在构建指标时非常有用,在构建 Expert 时也尤为便利。它能够省去大量的工作量,从常规工作中解放出来,使编程工作变得更有趣,更有吸引力。
/*
//----+ - - - - - - - - - - - - - - - - - - - - - - - - - - - - - - -+
//Version  July 1, 2006                                              |
Editing   Nikolay Kositsin  15.06.2006  farria@mail.redcom.ru        |
//----+ - - - - - - - - - - - - - - - - - - - - - - - - - - - - - - -+
Building a moving average on the current timeframe based on another,
larger timeframe. Attention!!! Indicator values are recalculated not
on the last bar, but on the number of bars, equivalent to a
candlestick of the large timeframe!

For the operation of the indicator place files
JJMASeries.mqh
PriceSeries.mqh
HTF_Channal.mqh
into folder (directory): MetaTrader\experts\include\
J2JMA.mq4
Heiken Ashi#.mq4
into folder (directory): MetaTrader\indicators\
*/
//+------------------------------------------------------------------+
//|                                            J2JMA channel_htf.mq4 |
//|                            Copyright c 2005, GS  Conversion only |
//|                    http://www.gustis.narod.ru/;     gsb51@mail.ru |
//+------------------------------------------------------------------+
#property copyright "  Copyright c 2005, GS  Conversion only"
#property link      " http://www.gustis.narod.ru/;     gsb51@mail.ru"
//---- drawing the indicator in the main window
#property indicator_chart_window
//---- number of indicator buffers
#property indicator_buffers  6
//---- indicator colors
#property indicator_color1 BlueViolet
#property indicator_color2 Gray
#property indicator_color3 Gray
#property indicator_color4 Lime
#property indicator_color5 Red
#property indicator_color6 Gray
//---- width of indicator lines
#property indicator_width1 3
#property indicator_width2 0
#property indicator_width3 0
#property indicator_width4 1
#property indicator_width5 1
#property indicator_width6 1
//---- style of indicator lines
#property indicator_style1 0
#property indicator_style2 4
#property indicator_style3 4
//---- INPUT PARAMETERS OF THE INDICATOR
//Parameters of custom indicator iCustom
extern int Length1 = 5;   // depth of the first smoothing
extern int Length2 = 5;   // depth of the second smoothing
// parameter of the first smoothing, changing within limits -100 ... +100,
//influences the quality of the transient process;
extern int Phase1  = 100;
// parameter of the second smoothing, changing within limits -100 ... +100,
//influences the quality of the transient process;
extern int Phase2  = 100;
//Choosing prices, based on which the indicator is calculated
extern int Input_Price_Customs = 0;
/*
//---- INPUT PARAMETERS HTF +--------------------------------------------+
extern int  TFrame_Period = 240; // The larger period in minutes
extern int         Smooth = 48;  // smoothing of the moving average
extern bool Trend_Visible = true;// visualization of the trend indication
// minimal speed of the moving average, considered as a trend
extern int  Trend_Minimum = 5;
extern int         Shift  = 0;   // shift of the indicator along the time axis
*/
//---- declaration of the function digits() to set up the accuracy format
// (number of signs after the decimal point) for the visualization of the
// indicator values
int digits(){return(Digits);}
//---- setting the indicator parameters, which will be invisible on the chart
int EmptyValue=0;
string Label="J2JMA";
//---- inserting into the indicator text its main text
#include <HTF_channel.mqh>
//---- declaration of the function INDICATOR
//---- reference to the source indicator to retrieve source values
double INDICATOR(int INDICATOR.bar)
 {
  return(iCustom(NULL,TFrame_Period,"J2JMA",Length1,Length2,Phase1,Phase2,
         0,Input_Price_Customs,0,INDICATOR.bar) );
 }
//-------------------------------------------------------------------+
总结
本文中,我们根据放入 mqh 文件的可用代码片段,对三色图表和三色移动平均线的构建过程进行了分析。使用上述构建三色指标的程序,以给定示例为模板,您可根据任何移动平均线和振荡指标轻松构建类似指标。也可用此法构建指标以显示来自其他时间框架的数据,可起到相当方便的作用,只需将这些指标放在一个图表上,便可同时查看不同时间范围内发生的流程。
Zip 文件 NK_library.zip 包含一百多个指标,这些指标是采用不同的平滑算法编写的。要学习应用上述示例编写其他类似指标,这些指标已绰绰有余了。Zip 文件中所有带平滑函数的指标都可配合 Expert Advisor 正常运行,不会出现错误。将 Zip 文件中的指标保存到客户终端 MetaTrader 4 中的文件夹\MetaTrader\EXPERTS\indicators 。平滑函数和程序代码片段在文件夹 INCLUDE 中。此文件夹中的所有文件都应保存到客户终端 MetaTrader 4 的文件夹:\MetaTrader\EXPERTS\INCLUDE 中。
本文由MetaQuotes Ltd译自俄文
原文地址: https://www.mql5.com/ru/articles/1451
注意: MetaQuotes Ltd.将保留所有关于这些材料的权利。全部或部分复制或者转载这些材料将被禁止。
本文由网站的一位用户撰写,反映了他们的个人观点。MetaQuotes Ltd 不对所提供信息的准确性负责,也不对因使用所述解决方案、策略或建议而产生的任何后果负责。


 具有最小延迟的有效平均算法:在指标中使用

 在杀毒软件和防火墙下运行的 MetaTrader 4