
Indicadores tricolores e algumas oportunidades para a simplificação máxima de indicadores de escrita
Introdução
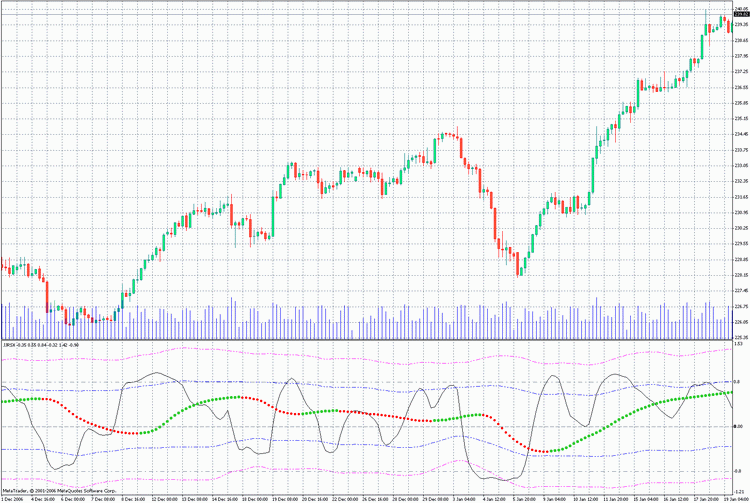
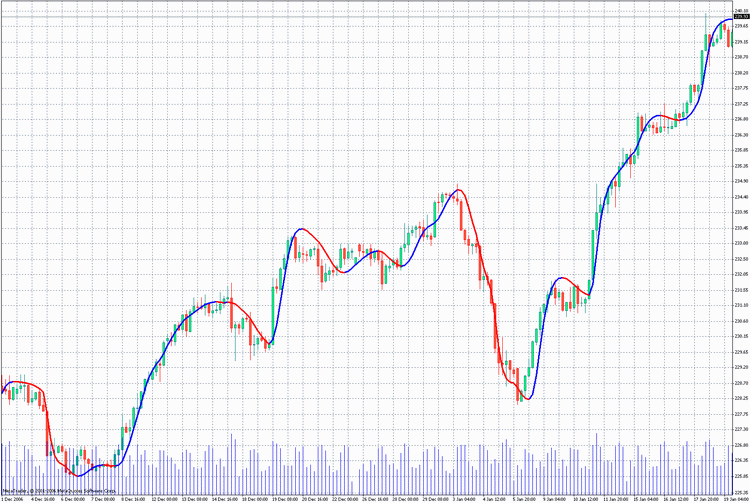
Em muitos casos, a melhor fonte informação permanece sendo a cor. As suas mudanças sinalizam muito vividamente e prontamente as alterações atuais nas características do mercado. Por esse motivo os indicadores de tendência tricolores muitas vezes parecem ser muito mais informativos e eficientes do que seus análogos monocromáticos. Veja os exemplos, representados nas duas variantes:
Na versão comum, com indicadores descoloridos de tendência de direção:
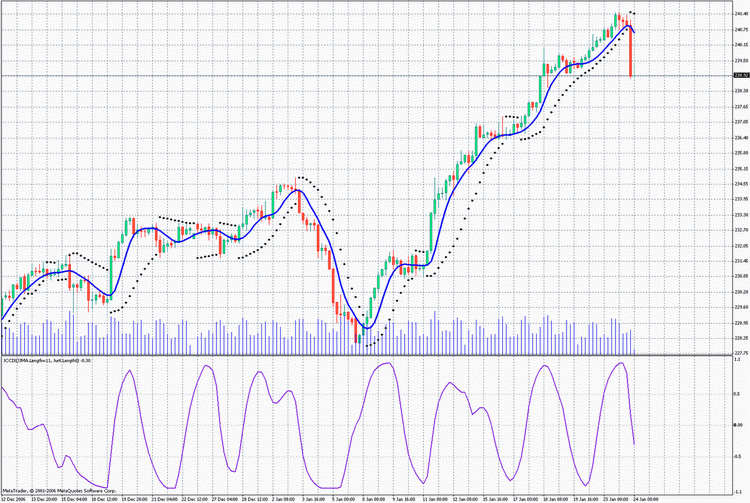
e em uma versão na qual os indicadores são coloridos de modos diferentes dependendo da direção da tendência:
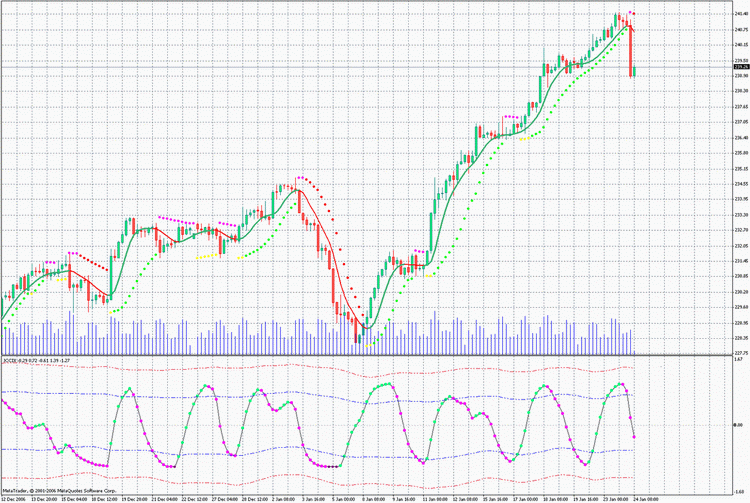
Você pode ver que o trabalho com o segundo gráfico é mais fácil e simples! Construir esse tipo de indicador no MQL4 não irá representar nenhum problema. Não há nenhum aumento significativo no consumo de recursos. Portanto, não se aproveitar desta oportunidade nas negociações significa abrir mão da possibilidade de simplificar o trabalho extenuante de observação constante da situação do mercado.
Vamos aprender a construir esse tipo de indicador.
Indicador tricolor 3c_JJRSX1
Antes de mais nada, vamos construir um diagrama linear tricolor com base no oscilador JJRSX:
iCustom(NULL,0,"JJRSX",Length,Smooth,Smooth_Phase,
        Input_Price_Customs,0,bar).
Escrever um análogo tricolor, capaz de sinalizar mudanças de tendência através das cores, não deve representar nenhum problema:
/*
For the operation of the indicator place the files
JJMASeries.mqh
JurXSeries.mqh
PriceSeries.mqh
into the folder (directory): MetaTrader\experts\include\
Heiken Ashi#.mq4
into the folder (directory): MetaTrader\indicators\
*/
//+------------------------------------------------------------------+
//|                                                    3c_JJRSX1.mq4 |
//|                           Copyright c 2006,     Nikolay Kositsin |
//|                              Khabarovsk,   farria@mail.redcom.ru |
//+------------------------------------------------------------------+
#property copyright "Copyright c 2006, Nikolay Kositsin"
#property link      "farria@mail.redcom.ru"
//---- drawing the indicator in a separate window
#property indicator_separate_window
//---- number of the indicator buffers
#property indicator_buffers  3
//---- colors of the indicator
#property indicator_color1  BlueViolet
#property indicator_color2  Magenta
#property indicator_color3  Gray
//---- width of the indicator lines
#property indicator_width1 3
#property indicator_width2 3
#property indicator_width3 3
//---- parameters of the horizontal levels of the indicator
#property indicator_level1  0.5
#property indicator_level2 -0.5
#property indicator_level3  0.0
#property indicator_levelcolor MediumBlue
#property indicator_levelstyle 4
//---- INPUT PARAMETERS OF THE INDICATOR
extern int        Length = 8;  // depth of the indicator smoothing
extern int        Smooth = 3; // depth of the additional JMA smoothing
// changing within the limits -100 ... +100,
// influences the quality of the transient process;
extern int  Smooth_Phase = 100;
/* Selecting prices, based on which the indicator will be calculated
(0-CLOSE, 1-OPEN, 2-HIGH, 3-LOW, 4-MEDIAN, 5-TYPICAL, 6-WEIGHTED,
7-Heiken Ashi Close, 8-SIMPL, 9-TRENDFOLLOW, 10-0.5*TRENDFOLLOW,
11-Heiken Ashi Low, 12-Heiken Ashi High, 13-Heiken Ashi Open,
14-Heiken Ashi Close.) */
extern int Input_Price_Customs = 0;
//---- indicator buffers
double Ind_Buffer1[];
double Ind_Buffer2[];
double Ind_Buffer3[];
//+------------------------------------------------------------------+
//| JJRSX initialization function                                    |
//+------------------------------------------------------------------+
int init()
  {
// styles of drawing the indicator
   SetIndexStyle(0,DRAW_HISTOGRAM, STYLE_SOLID);
   SetIndexStyle(1,DRAW_HISTOGRAM, STYLE_SOLID);
   SetIndexStyle(2,DRAW_HISTOGRAM, STYLE_SOLID);
// 4 indicator buffers are used for calculation
   SetIndexBuffer(0,Ind_Buffer1);
   SetIndexBuffer(1,Ind_Buffer2);
   SetIndexBuffer(2,Ind_Buffer3);
// setting the indicator values, which will be invisible on the chart
   SetIndexEmptyValue(0,0);
   SetIndexEmptyValue(1,0);
   SetIndexEmptyValue(2,0);
// names for window data and labels for subwindows
   SetIndexLabel(0,"Up_Trend");
   SetIndexLabel(1,"Down_Trend");
   SetIndexLabel(2,"Straight_Trend");
   IndicatorShortName("JJRSX(Length="+Length+")");
// Setting the format of accuracy (number of signs after a decimal point)
//for the visualisation of the indicator values
   IndicatorDigits(0);
// correction of the invalid value of the parameter Length
  if(Length<1)Length=1;
// setting the bar number, starting from which the indicator will be drawn
   int draw_begin=3*Length+30+1;
   SetIndexDrawBegin(0,draw_begin);
   SetIndexDrawBegin(1,draw_begin);
   SetIndexDrawBegin(2,draw_begin);
//---- end of the initialization
return(0);
  }
//+------------------------------------------------------------------+
//| JJRSX iteration function                                         |
//+------------------------------------------------------------------+
int start()
  {
// Declaration of the integer statistic variables
   static int time2;
// Declaration of the decimal static variables
   static double ValueM;
// Declaration of the decimal variables
    double Value0,Value1,trend;
// Declaration of the integer variables and retrievement of the calculated bars
    int bar,limit,MaxBar,Tnew,counted_bars=IndicatorCounted();
// check for errors
    if (counted_bars<0)return(-1);
// the last calculated bar should be recalculated
    if (counted_bars>0) counted_bars--;
// defining the number of the oldest bar,
// starting from which all bars will be recalculated
    MaxBar=Bars-3*Length-30;
    //---- defining the number of the oldest bar,
    //starting from which all new bars will be recalculated
    limit=Bars-counted_bars-1;
    //+--- zero initialization
    if (limit>=MaxBar)
      for(bar=Bars-1;bar>=MaxBar;bar--)
       {
        limit=MaxBar;
        Ind_Buffer1[bar]=0.0;
        Ind_Buffer2[bar]=0.0;
        Ind_Buffer3[bar]=0.0;
       }
//+--- retrieving the variable values
    Tnew=Time[limit+1];
    if (limit<MaxBar)
    if (Tnew==time2)
     {
      Value1=ValueM;
     }
    else
     {
      if (Tnew>time2)
           Print("Error in retrieving variables!!! Tnew>time2");
      else Print("Error in retrieving variables!!! Tnew");
      Print("Indicators will be recounted on all bars!!");
      return(-1);
     }
//----+ THE MAIN CYCLE OF CALCULATING INDICATORS
    while (bar>=0)
      {
       //+--- Saving the variables values +====+
     if (bar==1)
      {
       if(((limit==1)&&(time2==Time[2]))||(limit>1))
         {
          ValueM=Value1;
          time2=Time[bar];
         }
      }
     //+---+====================================+
        Value0=iCustom(NULL,0,"JJRSX",Length,Smooth,Smooth_Phase,
                       Input_Price_Customs,0,bar);
        if (bar==MaxBar)
          {
           Value1=Value0;
           continue;
          }
        //---- Tricolor indicator code
        trend=Value0-Value1;
        if(trend>0)
          {
            Ind_Buffer1[bar]=Value0;
            Ind_Buffer2[bar]=0;
            Ind_Buffer3[bar]=0;
          }
        else
          {
            if(trend<0)
              {
                Ind_Buffer1[bar]=0;
                Ind_Buffer2[bar]=Value0;
                Ind_Buffer3[bar]=0;
              }
            else
              {
                Ind_Buffer1[bar]=0;
                Ind_Buffer2[bar]=0;
                Ind_Buffer3[bar]=Value0;
              }
          }
        //----
        Value1=Value0;
        //----+
        bar--;
     }
    //---- end of the calculation of the indicator values
    return(0);
  }
//+--------------------------------------------------------------+
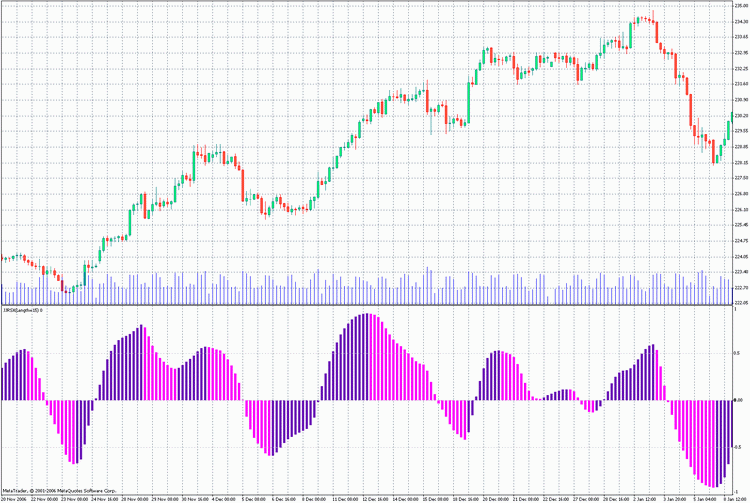
Três buffers indicadores são usados para o indicador, e para os valores do indicador fonte JJRSX na primeira linha o precioso Value1 (Valor1) é usado. Para que o valor da variável Value1 não seja perdido entre os ticks, ele é salvo na variável estática ValueM (ValorM). O algoritmo do indicador compara o valor atual do indicador ao valor da barra anterior e coloca este valor no buffer do indicador necessário. Para criar o indicador análogo com base em outro indicador personalizado, você simplesmente precisa alterar o nome do indicador personalizado na linha da referência para o indicador personalizado.
Value0=iCustom(NULL,0,"JJRSX",Length,Smooth,Smooth_Phase,
               Input_Price_Customs,0,bar);
Na linha
MaxBar = Bars - 3*Length - 30;
altere a fórmula de cálculo, também altere a fórmula de cálculo na linha
int draw_begin = 3*Length + 30 + 1;
do bloco de inicialização. E, é claro, altere as variáveis externas para as variáveis necessárias. Você pode tornar o gráfico mais informativo através da adição do indicador BollingerBands (bandas de Bollinger) e da opção de alteração da forma do indicador de linear para diagrama de pontos. Além disso, o uso deste indicador como modelo irá criar algumas inconveniências em relação à busca pelas linhas necessárias para alteração dentro do código do programa, que não será alterado em outros gráficos tricolores. Seria mais racional colocar este código de programa em um arquivo mqh e usá-lo dentro do indicador usando o operador #incluir. Vamos fazer isso. Neste caso, o código do indicador adquire uma forma simples, sem elementos excessivos. Ele é facilmente usado como modelo para a escrita de outros diagramas de oscilador:
/*
For the operation of the indicator place files
JJMASeries.mqh
PriceSeries.mqh
3c_BB_Osc.mqh
into folder (directory): MetaTrader\experts\include\
JJRSX.mq4
Heiken Ashi#.mq4
nto folder (directory): MetaTrader\indicators\
*/
//+------------------------------------------------------------------+
//|                                                     3c_JJRSX.mq4 |
//|                               Copyright © 2006, Nikolay Kositsin |
//|                              Khabarovsk,   farria@mail.redcom.ru |
//+------------------------------------------------------------------+
#property copyright "Copyright © 2006, Nikolay Kositsin"
#property link      "farria@mail.redcom.ru"
//---- drawing the indicator in a separate window
#property indicator_separate_window
//---- number of the indicator buffers
#property indicator_buffers 8
//---- colors of the indicator
#property indicator_color1 Gray
#property indicator_color2 LimeGreen
#property indicator_color3 Red
#property indicator_color4 Purple
//---- Bollinger Bands colors
#property indicator_color5 Blue
#property indicator_color6 Blue
#property indicator_color7 Magenta
#property indicator_color8 Magenta
//---- width of the indicator lines
#property indicator_width1 2
#property indicator_width2 2
#property indicator_width3 1
#property indicator_width4 1
//---- style of the envelope line
#property indicator_style1 4
//---- style of Bollinger Bands line
#property indicator_style5 4
#property indicator_style6 4
#property indicator_style7 4
#property indicator_style8 4
//---- parameters of horizontal lines of the indicator
#property indicator_level1 0.0
#property indicator_levelcolor SteelBlue
#property indicator_levelstyle 4
//---- INPUT PARAMETERS OF THE INDICATOR
extern int  Length = 8;  // depth of JurX indicator smoothing
// depth of JJMA smoothing of the retrieved indicator
extern int  Smooth = 3;
// parameter changing within limits -100 ... +100, influences
// the quality of transient processes of smoothing
extern int  Phase = 100;
/* Selecting colors, based on which the indicator is calculated
(0-CLOSE, 1-OPEN, 2-HIGH, 3-LOW, 4-MEDIAN, 5-TYPICAL, 6-WEIGHTED,
7-Heiken Ashi Close, 8-SIMPL, 9-TRENDFOLLOW, 10-0.5*TRENDFOLLOW,
11-Heiken Ashi Low, 12-Heiken Ashi High,  13-Heiken Ashi Open,
14-Heiken Ashi Close.) */
extern int Input_Price_Customs = 0;
//---- Declaration of the function COUNT_begin() for counting the bar number,
// starting from which the indicator will be drawn and
// Bollinger Bands wikk be calculated
int COUNT_begin()
{int count_begin=2*Length+30;return(count_begin);}
//---- declaration of the function digits() for setting the accuracy format
// (number of signs after a decimal point) for the visualization
// of the indicator values
int digits(){return(2);}
//---- setting the indicator values, which will be invisible on the chart
int EmptyValue=0.0;
//---- Declaration of the name of the indicator
string Label = "JJRSX";

//---- Including into the indicator text its main text
#include <3c_BB_Osc.mqh>
//---- declaration of the function INDICATOR
//---- reference to the source indicator for retrieving the source values
double INDICATOR(int INDICATOR.bar)
 {
  return(iCustom( NULL, 0, "JJRSX", Length, Smooth, Phase,
         Input_Price_Customs, 0, INDICATOR.bar) );
 }
//---- ---------------------------------------------------------------+
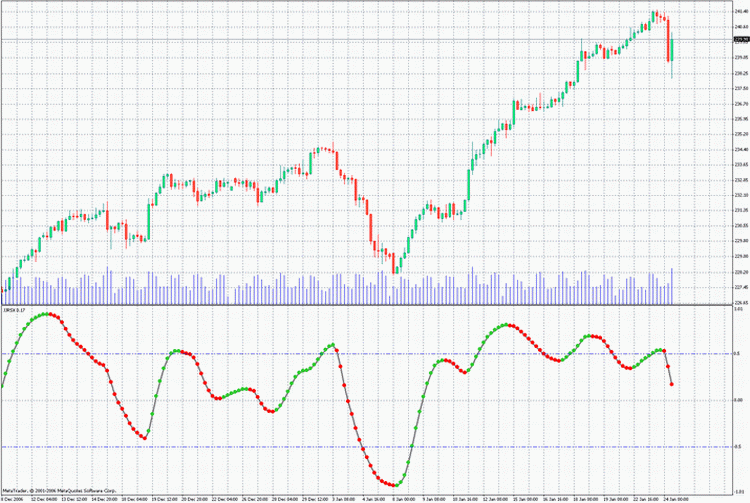
O código excessivo é posicionado no arquivo 3c_BB_Osc.mqh e é representado no indicador por apenas uma linha
#include <3c_BB_Osc.mqh>
O arquivo mqh também contém as variáveis externas para as bandas de Bollinger e para escolha do estilo de apresentação do gráfico. Naturalmente, o arquivo 3c_BB_Osc.mqh deve ser colocado na pasta: \MetaTrader\EXPERTS\INCLUDE.
O algoritmo de construção de um indicador tricolor
Para criar um novo oscilador tricolor, basta salvar este arquivo com um novo nome na pasta \MetaTrader\EXPERTS\indicators e fazer as seguintes alterações:
1. Escolha as cores desejadas dos elementos e outros parâmetros do indicador;
2. Insira os novos parâmetros de entrada do indicador, copiando-os do indicador personalizado;
3. Insira, na função COUNT_begin(), uma fórmula para contar uma barra de início (geralmente basta inserir a variável externa do indicador, o que determina o período ou a soma desta variável com a variável, realizando o nivelamento adicional do oscilador);
4. Insira, na linha,
digits()
  {
    return(2);
  }
o valor necessário da precisão do indicador. Caso o indicador mude de 0 para 100, insira zero, caso o indicador mude de 0 para 1, insira 2 (dois sinais após o ponto decimal!);
5. Defina os valores do indicador, que serão invisíveis no gráfico;
6. Crie um nome para o indicador;
7. Insira a referência ao indicador personalizado iCustom(). Depois disso, compile o código e o indicador estará pronto!
Uma opção de alteração adicional é nivelar um pouco a forma do oscilador. Para fazer isto, basta adicionar a letra "J" no nome do arquivo mqh no texto do indicador: foi:
#include <3c_BB_Osc.mqh>
agora
#include <3c_BBJ_Osc.mqh>
Na compilação do arquivo com o JMA, o nivelamento do oscilador personalizado será usado.
Um indicador tricolor 3c_JJRSX2
É possível incrementar o indicador ainda mais. Seria bastante conveniente adicionar mais um rápido JJRSXX monocromático, Vamos dividir o indicador pelo análogo com o exemplo em duas partes, colocando no arquivo mqh a parte do código que simplifica maximamente a percepção do indicador (3c_BB_Osc2.mqh):
/*
For the operation of the indicator place the files
JJMASeries.mqh
JurXSeries.mqh
PriceSeries.mqh
3c_BB_Osc2.mqh
into the folder (directory): MetaTrader\experts\include\
JJRSX.mq4
Heiken Ashi#.mq4
into the folder (directory): MetaTrader\indicators\
*/
//+------------------------------------------------------------------+
//|                                                    3c_JJRSX2.mq4 |
//|                               Copyright c 2006, Nikolay Kositsin |
//|                              Khabarovsk,   farria@mail.redcom.ru |
//+------------------------------------------------------------------+
#property copyright "Copyright c 2006, Nikolay Kositsin"
#property link      "farria@mail.redcom.ru"
//---- drawing the indicator in a separate window
#property indicator_separate_window
//---- the number of the indicator buffers
#property indicator_buffers 8
//---- colors of the indicator
#property indicator_color1 Gold
#property indicator_color2 LimeGreen
#property indicator_color3 Red
#property indicator_color4 Purple
//---- Bollinger Bands colors
#property indicator_color5 Blue
#property indicator_color6 Blue
#property indicator_color7 Magenta
#property indicator_color8 Magenta
//---- width of the indicator lines
#property indicator_width1 1
#property indicator_width2 2
#property indicator_width3 1
#property indicator_width4 1
//---- style of the envelope line
#property indicator_style1 4
//---- style of Bollinger Bands lines
#property indicator_style5 4
#property indicator_style6 4
#property indicator_style7 4
#property indicator_style8 4
//---- parameters of the horizontal levels of the indicator
#property indicator_level1  0.0
#property indicator_level2  0.8
#property indicator_level3 -0.8
//---- INPUT PARAMETERS OF THE INDICATOR
//---- input parameters of the quick monochromic JJRSX
extern int  Length1 = 8;  // depth of JurX smoothing of the indcator
// depth of JJMA smoothing of the retrieved indicator
extern int  Smooth1 = 3;
// parameter changing within limits -100 ... +100,
//influences the quality of transient process of smoothing
extern int  Phase1 = 100;
//Selecting prices, based on which the indicator will be calculated
extern int Input_Price_Customs1 = 0;
/*(0-CLOSE, 1-OPEN, 2-HIGH, 3-LOW, 4-MEDIAN, 5-TYPICAL, 6-WEIGHTED,
7-Heiken Ashi Close, 8-SIMPL, 9-TRENDFOLLOW, 10-0.5*TRENDFOLLOW,
11-Heiken Ashi Low, 12-Heiken Ashi High,  13-Heiken Ashi Open,
14-Heiken Ashi Close.) */
//---- input parameters of the slow tricolor JJRSX
extern int  Length2 = 40;  // depth of JurX smoothing of the inidcator
// depth of JJMA smoothing of the retrieved indicator
extern int  Smooth2 = 12;
// parameter changing within limits -100 ... +100,
// influences the quality of transient process of smoothing
extern int  Phase2 = 100;
// Selecting prices, based on which the indicator will be calculated
extern int Input_Price_Customs2 = 0;
/*(0-CLOSE, 1-OPEN, 2-HIGH, 3-LOW, 4-MEDIAN, 5-TYPICAL, 6-WEIGHTED,
7-Heiken Ashi Close, 8-SIMPL, 9-TRENDFOLLOW, 10-0.5*TRENDFOLLOW,
11-Heiken Ashi Low, 12-Heiken Ashi High,  13-Heiken Ashi Open,
14-Heiken Ashi Close.)*/
//---- The style of performing the horizontal lines of the indicators
extern int    Levels_Style = 3;         // Style of levels lines
extern int    Levels_Width = 0;         // Width of leevls lines
extern color  Levels_Color = SlateGray; // color of levels lines
//---- Declaration of the function COUNT_begin() for counting the bar number,
// starting from which the indicator will be drawn and
// Bollinger Bands will be calculated
int COUNT_begin(){int count_begin=2*Length2+30;return(count_begin);}
//---- declaration of the function digits() for setting the accuracy format
//(number of signs after the decimal point) for the visualization of the
//indicator values
int digits(){return(2);}
//---- setting the indicator values, which will be invisible on the chart
int EmptyValue=0.0;
//---- Determining the indicator name
string Label = "JJRSX";

//---- Including into the indicator text its main text
#include <3c_BB_Osc2.mqh>
//---- declaration of the function INDICATOR1
//---- reference to the source indicator for retrieving source values
double INDICATOR1(int INDICATOR1.bar)
 {
  return(iCustom( NULL, 0, "JJRSX", Length1, Smooth1, Phase1,
         Input_Price_Customs1, 0, INDICATOR1.bar) );
 }
//---- declaration of the function INDICATOR2
//---- reference to the source indicator for retrieving source values
double INDICATOR2(int INDICATOR2.bar)
 {
  return(iCustom( NULL, 0, "JJRSX", Length2, Smooth2, Phase2,
         Input_Price_Customs2, 0, INDICATOR2.bar) );
 }
//---- --------------------------------------------------------------+
O código do indicador não foi muito mais complicado, e agora ele inclui duas referências ao indicador personalizado JJRSX e a dois grupos dos parâmetros do indicador externo, igual ao número de indicadores JJRSX. Usar estes indicadores como modelos para construir gráficos similares baseados em alguns dos osciladores não deve representar qualquer tipo de problema.
Médias móveis tricolores
Vamos falar agora das variantes de escrita de médias móveis tricolores. Primeiramente, poderíamos escrever um código absolutamente análogo àquele descrito no primeiro exemplo. Mas o gráfico anterior pode ter uma desvantagem: caso a direção do movimento se altere a cada barra, haverá uma justaposição de cores, o que não é normal. A única maneira de evitar esta desvantagem é usar mais três buffers! Três buffers adicionais normalmente não devem tornar o indicador extremamente longo, caso o código excessivo seja colocado em um arquivo mql. Quanto a escrever uma média móvel tricolor, ela será idêntica às anteriores:
/*
For the operation of the indicator place files
JJMASeries.mqh
PriceSeries.mqh
3Color.mqh
into folder (directory): MetaTrader\experts\include\
J2JMA.mq4
into folder (directory): MetaTrader\experts\indicators\
*/
//+------------------------------------------------------------------+
//|                                                     3c_J2JMA.mq4 |
//|                           Copyright c 2006,     Nikolay Kositsin |
//|                              Khabarovsk,   farria@mail.redcom.ru |
//+------------------------------------------------------------------+
#property copyright "Copyright c 2006, Nikolay Kositsin"
#property link "farria@mail.redcom.ru"
//---- drawing the indicator in the main window
#property indicator_chart_window
//---- number of indicator buffers
#property indicator_buffers 6
//---- indicator colors
#property indicator_color1 Blue
#property indicator_color2 Blue
#property indicator_color3 Red
#property indicator_color4 Red
#property indicator_color5 Gray
#property indicator_color6 Gray
//---- INPUT PARAMETERS OF THE INDICATOR
extern int Length1 = 5;   // depth of the first smoothing
extern int Length2 = 5;   // depth of the second smoothing
// parameter of the first smoothing, changing within limits -100 ... +100,
//influences the quality of the transient process;
extern int Phase1  = 100;
// parameter of the second smoothing, changing within limits -100 ... +100,
//influences the quality of the transient process;
extern int Phase2  = 100;
/* Choosing prices, based on which the indicator is calculated
(0-CLOSE, 1-OPEN, 2-HIGH, 3-LOW, 4-MEDIAN, 5-TYPICAL, 6-WEIGHTED,
7-Heiken Ashi Close, 8-SIMPL, 9-TRENDFOLLOW, 10-0.5*TRENDFOLLOW,
11-Heiken Ashi Low, 12-Heiken Ashi High,  13-Heiken Ashi Open,
14-Heiken Ashi Close.) */
extern int Input_Price_Customs = 0;
//---- declaration of the function digits() to set up the accuracy format
// (number of signs after the decimal point) for the visualization of the
// indicator values
int digits(){return(Digits);}
//---- Declaration of the function COUNT_begin() for calculation of the bar number,
//starting from which the indicator will be drawn
int COUNT_begin(){return(60);}
//---- setting the indicator parameters, which will be invisible on the chart
int  EmptyValue=0;
//---- lable for the indicator
string Label="J2JMA";
//---- inserting into the indicator text its main text
#include <3Color.mqh>
//---- declaration of the function INDICATOR
//---- reference to the source indicator to retrieve source values
double INDICATOR(int INDICATOR.bar)
 {
  return(iCustom(NULL,0,"J2JMA",Length1,Length2,Phase1,Phase2,0,
         Input_Price_Customs,0,INDICATOR.bar) );
 }
//---- --------------------------------------------------------------+
Deve-se notar que, com relação às médias móveis, você não deveria alterar nada ao definir o formato de precisão para médias móveis!
int digits()
  {
    return(Digits);
  }
Caso a média móvel, que você quer apresentar em uma variante de três cores, seja instável, ela pode ser facilmente nivelada. Basta adicionar, na linha,
#include <3Color.mqh>
a letra "J". Teremos:
#include <3ColorJ.mqh>
Modelos do indicador, construídos com base em períodos de tempo maiores
Aqui estão mais dois modelos de indicador construídos com base em períodos de tempo maiores. Eles também podem ser construídos com base em qualquer média móvel ou oscilador:
//----+ - - - - - - - - - - - - - - - - - - - - - - - - - - - - - - -+
//Version  July 1, 2006                                              |
//Editing   Nikolay Kositsin  15.06.2006  farria@mail.redcom.ru      |
//----+ - - - - - - - - - - - - - - - - - - - - - - - - - - - - - - -+
/*
Building a moving average on the current timeframe based on another,
larger timeframe. Attention!!! Indicator values are recalculated not
on the last bar, but on the number of bars, equivalent to a
candlestick of the large timeframe!

For the operation of the indicator place files
JJMASeries.mqh
PriceSeries.mqh
HTF.mqh
into folder (directory): MetaTrader\experts\include\
J2JMA.mq4
Heiken Ashi#.mq4
into folder (directory): MetaTrader\indicators\
*/
//+------------------------------------------------------------------+
//|                                                    J2JMA_htf.mq4 |
//|                            Copyright c 2005, GS  Conversion only |
//|                    http://www.gustis.narod.ru/;     gsb51@mail.ru |
//+------------------------------------------------------------------+
#property copyright "  Copyright c 2005, GS  Conversion only"
#property link      " http://www.gustis.narod.ru/;     gsb51@mail.ru"
//---- drawing the indicator in the main window
#property indicator_chart_window
//---- number of indicator buffers
#property indicator_buffers  4
//---- indicator colors
#property indicator_color1 BlueViolet
#property indicator_color2 Lime
#property indicator_color3 Red
#property indicator_color4 Gray
//---- width of indicator lines
#property indicator_width1 3
#property indicator_width2 1
#property indicator_width3 1
#property indicator_width4 3
//---- style of indicator lines
#property indicator_style1 0
//---- INPUT PARAMETERS OF THE INDICATOR
//Parameters of custom indicator iCustom
extern int Length1 = 5;   // depth of the first smoothing
extern int Length2 = 5;   // depth of the second smoothing
// parameter of the first smoothing, changing within limits -100 ... +100,
//influences the quality of the transient process;
extern int Phase1  = 100;
// parameter of the second smoothing, changing within limits -100 ... +100,
//influences the quality of the transient process;
extern int Phase2  = 100;
//Choosing prices, based on which the indicator is calculated
extern int Input_Price_Customs = 0;
/*
//---- INPUT PARAMETERS HTF +--------------------------------------------+
extern int  TFrame_Period = 240; // The larger period in minutes
// smoothing of the moving average. The most optimal value is equal
// to the relation of the larger timeframe periods to the chart period
extern int         Smooth = 48;
extern bool Trend_Visible = true;// visualization of the trend indication
// minimal speed of the moving average, considered as a trend
extern int  Trend_Minimum = 5;
extern int         Shift  = 0;   // shift of the indicator along the time axis
*/
//---- declaration of the function digits() to set up the accuracy format
// (number of signs after the decimal point) for the visualization of the
// indicator values
int digits(){return(Digits);}
//---- setting the indicator parameters, which will be invisible on the chart
int EmptyValue=0;
string Label="J2JMA";
//---- inserting into the indicator text its main text
#include <HTF.mqh>
//---- declaration of the function INDICATOR
//---- reference to the source indicator to retrieve source values
double INDICATOR(int INDICATOR.bar)
 {
  return(iCustom(NULL,TFrame_Period,"J2JMA",Length1,Length2,Phase1,Phase2,
         0,Input_Price_Customs,0,INDICATOR.bar) );
 }
//---- -----------------------------------------------------------+
Para uma operação normal da média móvel, ambos gráficos devem estar abertos! Note que os dados do histórico em ambos gráficos devem vir todos de um mesmo corretor!
Quanto à última média móvel, deve-se notar que, por conta da sua natureza de tendência aparentemente indicativa, adicioná-la a um expert advisor não faz sentido. Não importa quais forem as maravilhas prometidas, elas não se tornarão realidade! A média móvel não é recalculada na última barra do do período de tempo atual, mas na última barra de um período de tempo maior! Várias tentativas de realização deste trabalho de Sísifo, como era de se esperar, não resultaram em nada!
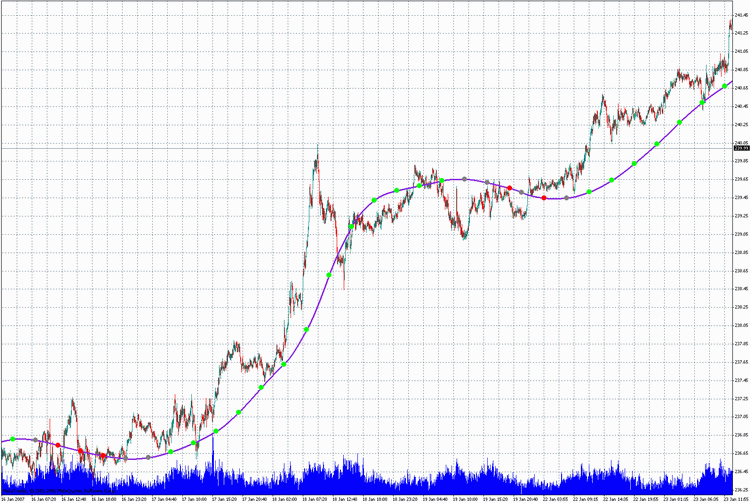
Neste caso, nós devemos explicar o objetivo principal do algoritmo, que está na base deste indicador. Os valores sobre os quais o indicador é construído são obtidos a partir das barras do período de tempo maior. Depois que o nivelamento do preço cru é calculado, os valores resultantes são transferidos a um período de tmepo menor, e os valores intermediários faltantes do período de tempo menor são adicionados através do método de interpolação linear. Mas, como o gráfico tem a forma de uma linha poligonal, nós naturalmente gostaríamos de nivelá-lo. Isto é realizado neste indicador!
Depois de tais transformações, esta curva adquire uma forma bastante graciosa, mas ainda é calculada pelo número de barras de um período de tempo menor, equivalente a um castiçal do período de tempo maior. E, finalmente, devemos notar que a habilidade de colocar um código de programa excessivo em um arquivo mqh é especialmente conveniente não apenas na construção de indicadores, mas também na construção de experts. Isso nos permite evitar um grande volume de trabalho, nos liberta da rotina, e torna a programação um trabalho bastante fascinante e interessante.
/*
//----+ - - - - - - - - - - - - - - - - - - - - - - - - - - - - - - -+
//Version  July 1, 2006                                              |
Editing   Nikolay Kositsin  15.06.2006  farria@mail.redcom.ru        |
//----+ - - - - - - - - - - - - - - - - - - - - - - - - - - - - - - -+
Building a moving average on the current timeframe based on another,
larger timeframe. Attention!!! Indicator values are recalculated not
on the last bar, but on the number of bars, equivalent to a
candlestick of the large timeframe!

For the operation of the indicator place files
JJMASeries.mqh
PriceSeries.mqh
HTF_Channal.mqh
into folder (directory): MetaTrader\experts\include\
J2JMA.mq4
Heiken Ashi#.mq4
into folder (directory): MetaTrader\indicators\
*/
//+------------------------------------------------------------------+
//|                                            J2JMA channel_htf.mq4 |
//|                            Copyright c 2005, GS  Conversion only |
//|                    http://www.gustis.narod.ru/;     gsb51@mail.ru |
//+------------------------------------------------------------------+
#property copyright "  Copyright c 2005, GS  Conversion only"
#property link      " http://www.gustis.narod.ru/;     gsb51@mail.ru"
//---- drawing the indicator in the main window
#property indicator_chart_window
//---- number of indicator buffers
#property indicator_buffers  6
//---- indicator colors
#property indicator_color1 BlueViolet
#property indicator_color2 Gray
#property indicator_color3 Gray
#property indicator_color4 Lime
#property indicator_color5 Red
#property indicator_color6 Gray
//---- width of indicator lines
#property indicator_width1 3
#property indicator_width2 0
#property indicator_width3 0
#property indicator_width4 1
#property indicator_width5 1
#property indicator_width6 1
//---- style of indicator lines
#property indicator_style1 0
#property indicator_style2 4
#property indicator_style3 4
//---- INPUT PARAMETERS OF THE INDICATOR
//Parameters of custom indicator iCustom
extern int Length1 = 5;   // depth of the first smoothing
extern int Length2 = 5;   // depth of the second smoothing
// parameter of the first smoothing, changing within limits -100 ... +100,
//influences the quality of the transient process;
extern int Phase1  = 100;
// parameter of the second smoothing, changing within limits -100 ... +100,
//influences the quality of the transient process;
extern int Phase2  = 100;
//Choosing prices, based on which the indicator is calculated
extern int Input_Price_Customs = 0;
/*
//---- INPUT PARAMETERS HTF +--------------------------------------------+
extern int  TFrame_Period = 240; // The larger period in minutes
extern int         Smooth = 48;  // smoothing of the moving average
extern bool Trend_Visible = true;// visualization of the trend indication
// minimal speed of the moving average, considered as a trend
extern int  Trend_Minimum = 5;
extern int         Shift  = 0;   // shift of the indicator along the time axis
*/
//---- declaration of the function digits() to set up the accuracy format
// (number of signs after the decimal point) for the visualization of the
// indicator values
int digits(){return(Digits);}
//---- setting the indicator parameters, which will be invisible on the chart
int EmptyValue=0;
string Label="J2JMA";
//---- inserting into the indicator text its main text
#include <HTF_channel.mqh>
//---- declaration of the function INDICATOR
//---- reference to the source indicator to retrieve source values
double INDICATOR(int INDICATOR.bar)
 {
  return(iCustom(NULL,TFrame_Period,"J2JMA",Length1,Length2,Phase1,Phase2,
         0,Input_Price_Customs,0,INDICATOR.bar) );
 }
//-------------------------------------------------------------------+
Conclusão
Neste artigo nós analisamos a construção de gráficos tricolores e médias móveis tricolores com base nos fragmentos de código disponíveis que foram colocados em arquivos mqh. Através do uso do procedimento de construção de indicadores tricolores descrito acima, e usando os exemplos apresentados como modelos, você pode facilmente construir indicadores análogos com base em quaisquer médias móveis e osciladores. Usando este método você também pode construir indicadores, capazes de exibir dados de outros períodos de tempo, que podem ser muito convenientes, quando colocados em um gráfico, permitindo que se observe processos que acontecem em diferentes escalas de tempo simultaneamente.
O arquivo zip NK_library.zip contém mais de cem indicadores, escritos através do uso de diferentes algoritmos de nivelamento. Estes indicadores são mais do que o suficiente para se aprender a utilizar os exemplos descritos acima para escrever outros indicadores análogos. Todos os indicadores do arquivo zip com as versões de função de nivelamento operam com os expert advisors sem erros. Salve os indicadores do arquivo zip na pasta do terminal do cliente MetaTrader 4: \MetaTrader\EXPERTS\indicators. As funções de nivelamento e fragmentos de código de programa estão na pasta INCLUDE. Todos os arquivos desta pasta devem ser salvos na pasta do terminal do cliente MetaTrader 4: \MetaTrader\EXPERTS\INCLUDE.
Traduzido do russo pela MetaQuotes Ltd.
Artigo original: https://www.mql5.com/ru/articles/1451
Aviso: Todos os direitos sobre esses materiais pertencem à MetaQuotes Ltd. É proibida a reimpressão total ou parcial.
Esse artigo foi escrito por um usuário do site e reflete seu ponto de vista pessoal. A MetaQuotes Ltd. não se responsabiliza pela precisão das informações apresentadas nem pelas possíveis consequências decorrentes do uso das soluções, estratégias ou recomendações descritas.
 O ABC das negociações no Forex
 Algoritmos de média eficiente com lag mínimo: Uso em indicadores
 Criação de um sistema de comércio automatizado
 Funcionamento do MetaTrader 4 na presença de anti-vírus e firewalls
- Aplicativos de negociação gratuitos
- 8 000+ sinais para cópia
- Notícias econômicas para análise dos mercados financeiros
Você concorda com a política do site e com os termos de uso