SweepMaster

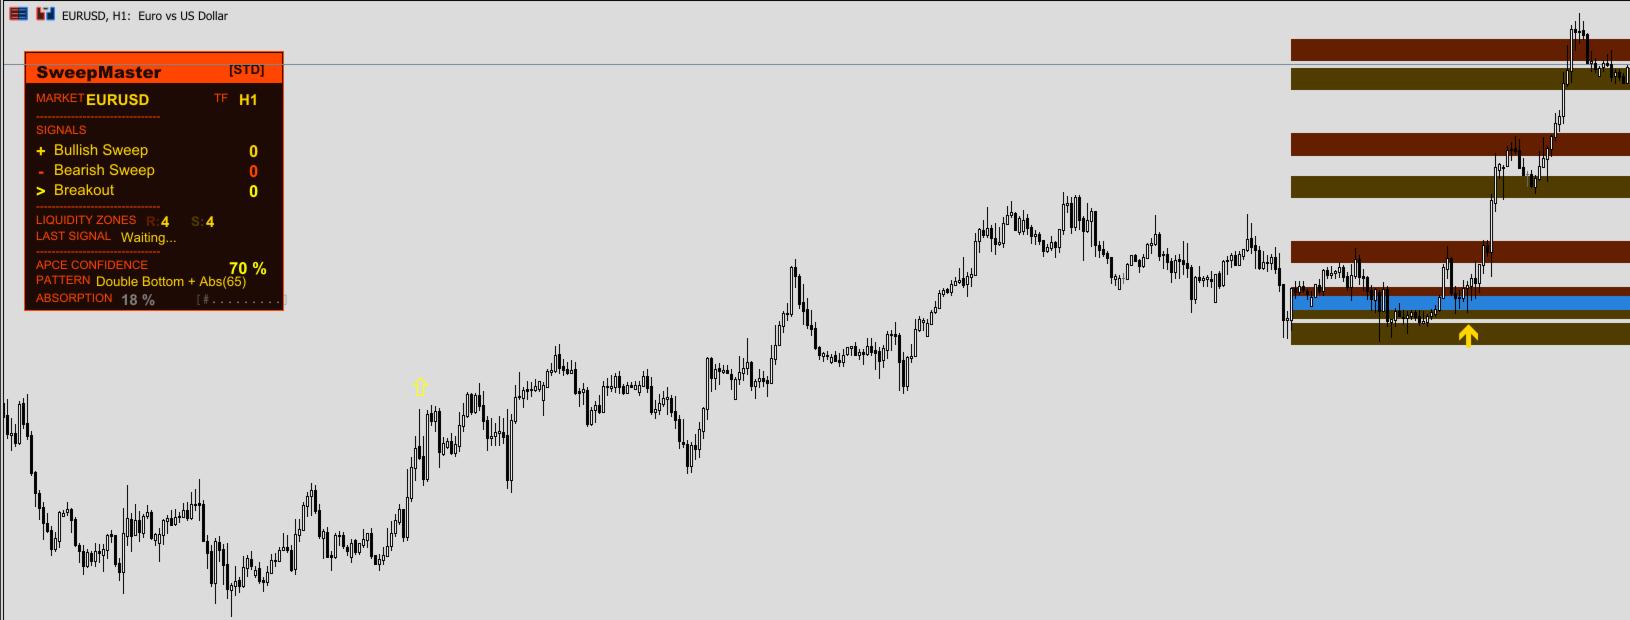
SweepMaster – LSSD & APCE

Rilevatore di sweep di liquidità, stop-hunt e motore di fiducia adattivo (APCE)

Indicatore per la rilevazione di sweep di liquidità che integra tre modalità di trading (Scalping, Standard, Swing), motore di fiducia APCE, analisi dell’assorbimento del volume e zone adattive di supporto e resistenza. Progettato per l’analisi del flusso ordini in tempo reale.

Timeframe consigliato: H1

SweepMaster è un indicatore di analisi tecnica progettato per identificare in tempo reale sweep di liquidità, stop-hunt e fasi di accumulo/distribuzione tramite un’analisi combinata di prezzo, volume e struttura di mercato.

Caratteristiche principali

Modalità di trading

Scalping Mode: rilevamento rapido con soglie leggere

Standard Mode: parametri bilanciati e personalizzabili

Swing Mode: criteri più severi per segnali su timeframe più alti

Rilevazione sweep di liquidità

Identificazione di sweep rialzisti e ribassisti

Analisi delle candele con conferma del volume

Distinzione tra breakout validi e rifiuti

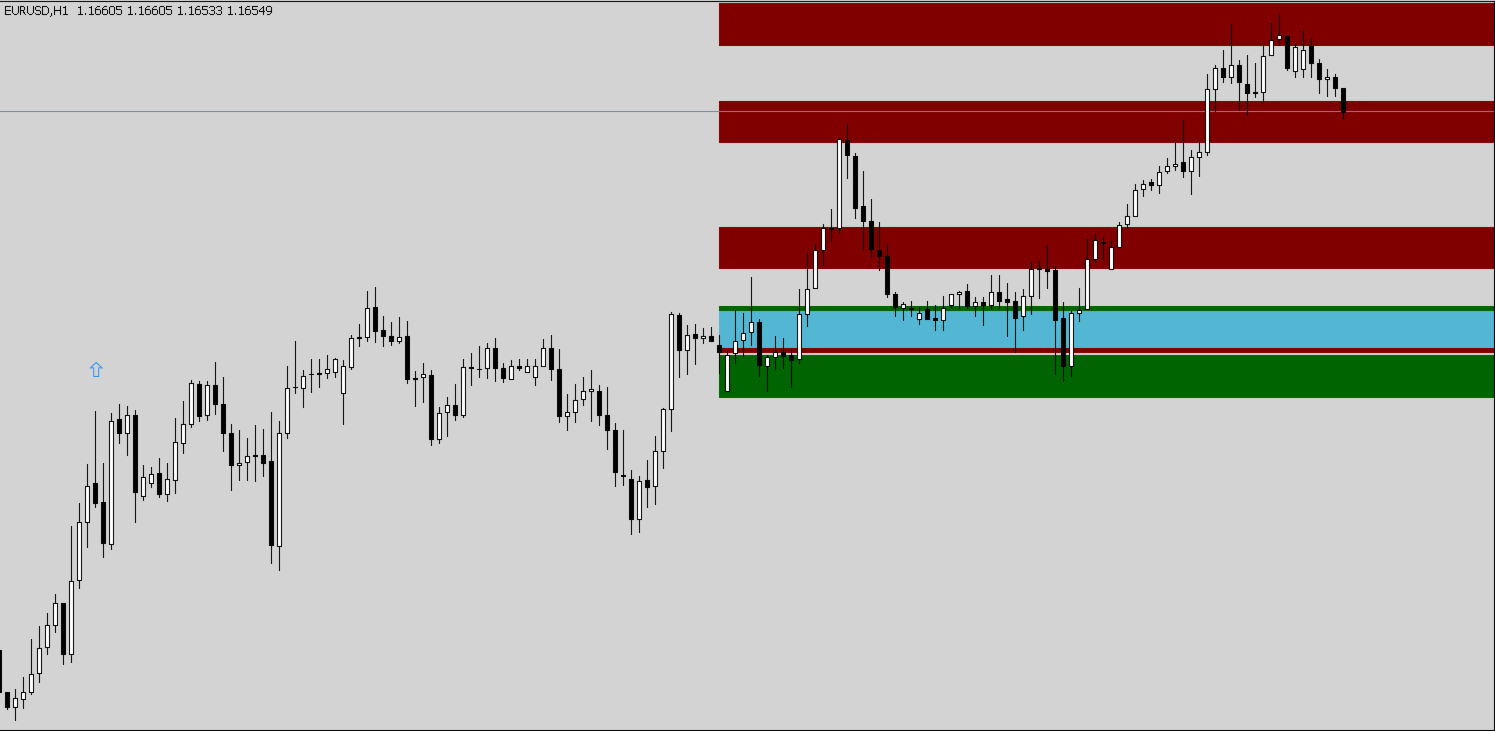
Livelli di supporto e resistenza adattativi in base al timeframe

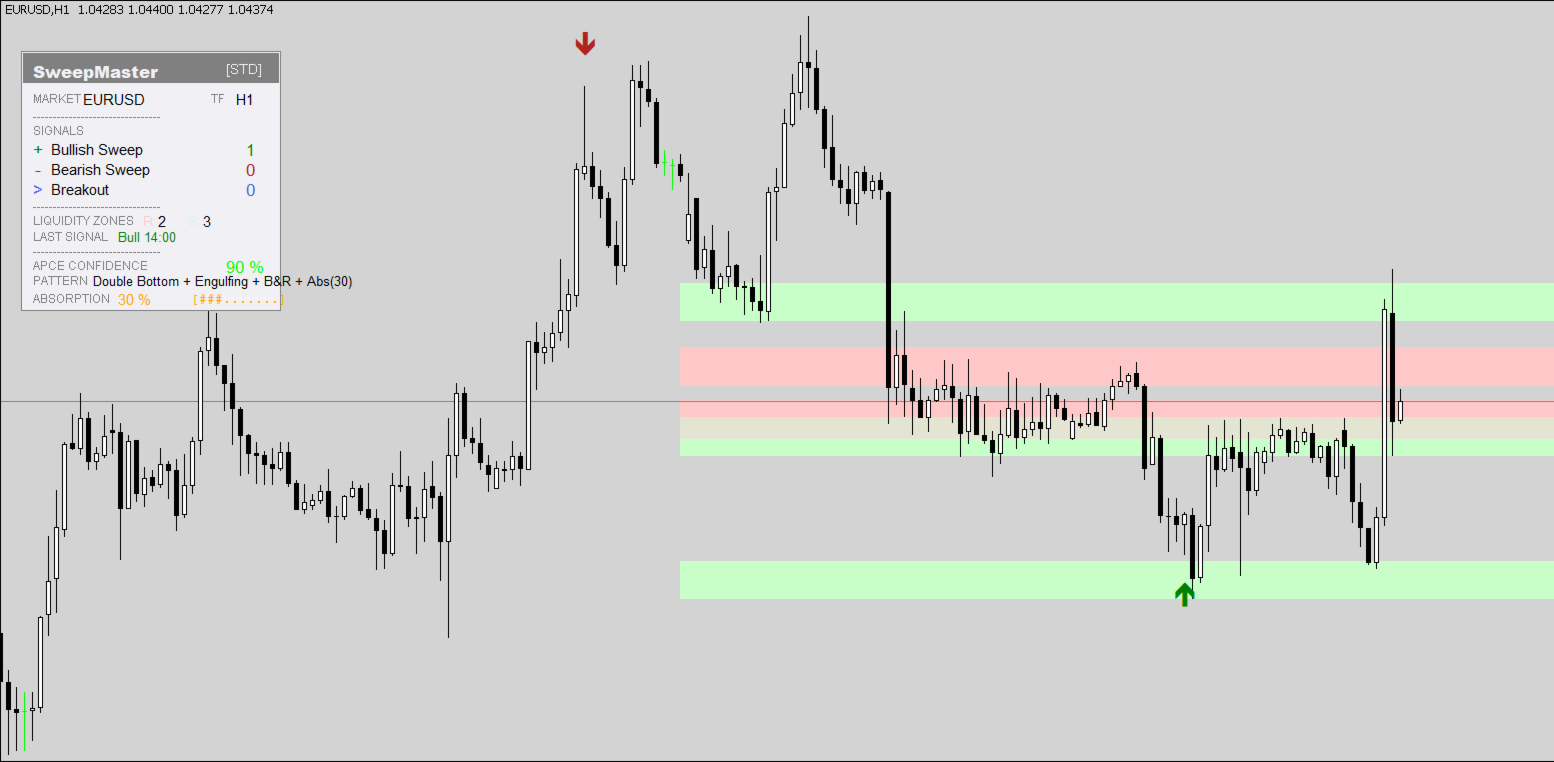
Motore APCE (Adaptive Pattern Confidence Engine)

Punteggio di fiducia da 0 a 100%

Rilevazione di doppio massimo e doppio minimo

Riconoscimento di pattern engulfing

Validazione della configurazione Break & Retest

Calcolo in tempo reale sulla candela corrente

Analisi dell’assorbimento del volume

Sistema di punteggio basato su 8 criteri (0–100%)

Intensità del volume e analisi della compressione del range

Rilevazione di rifiuto delle candele e equilibrio del prezzo

Identificazione del climax di volume

Indicatore visivo in tempo reale

Zone di supporto e resistenza adattative

Tolleranza basata su ATR adattata alla volatilità

Rilevazione swing adattata al timeframe

Media ponderata dei livelli

Validazione in base al numero di interazioni del prezzo

Filtraggio migliorato sui timeframe inferiori
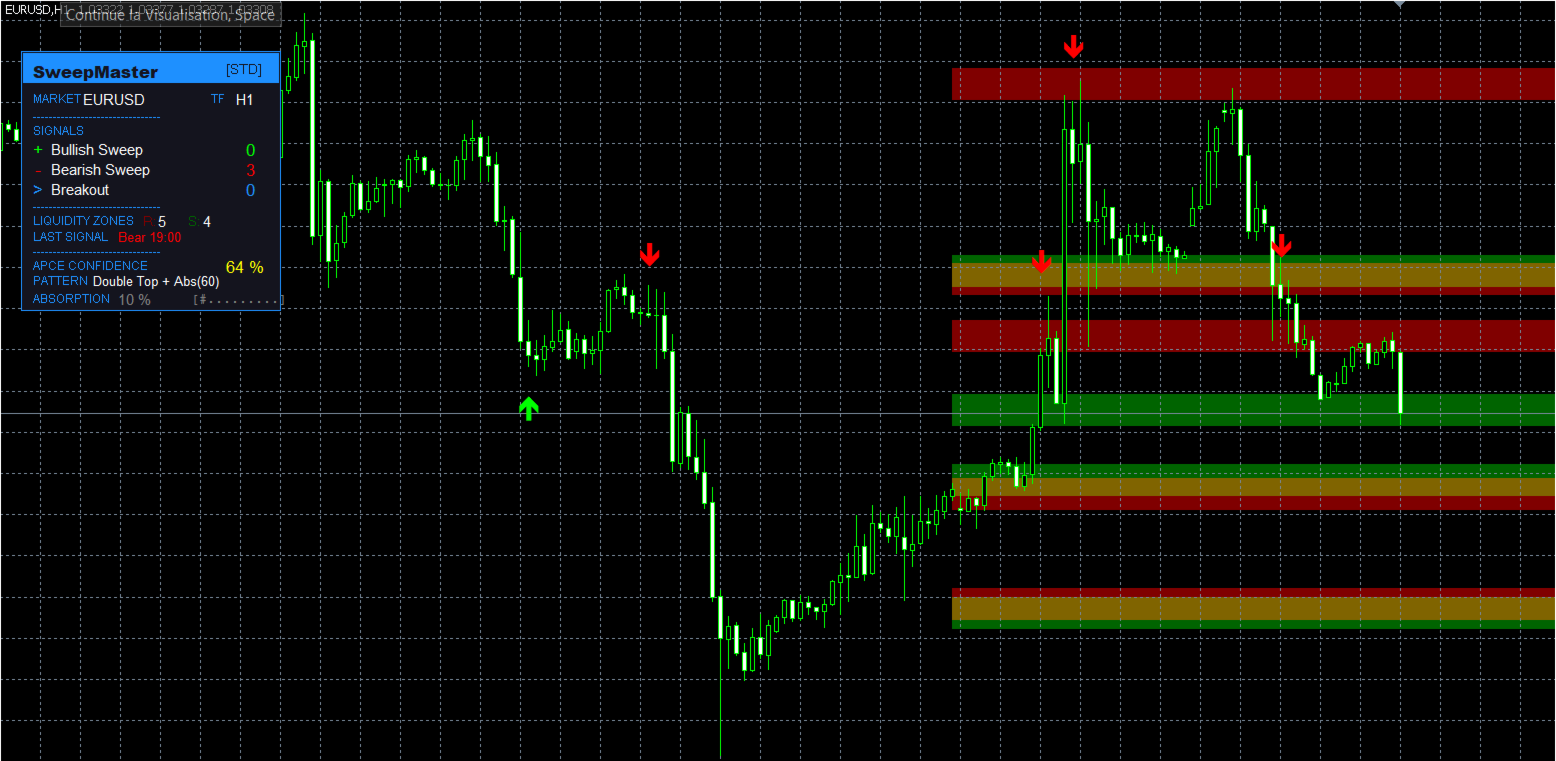
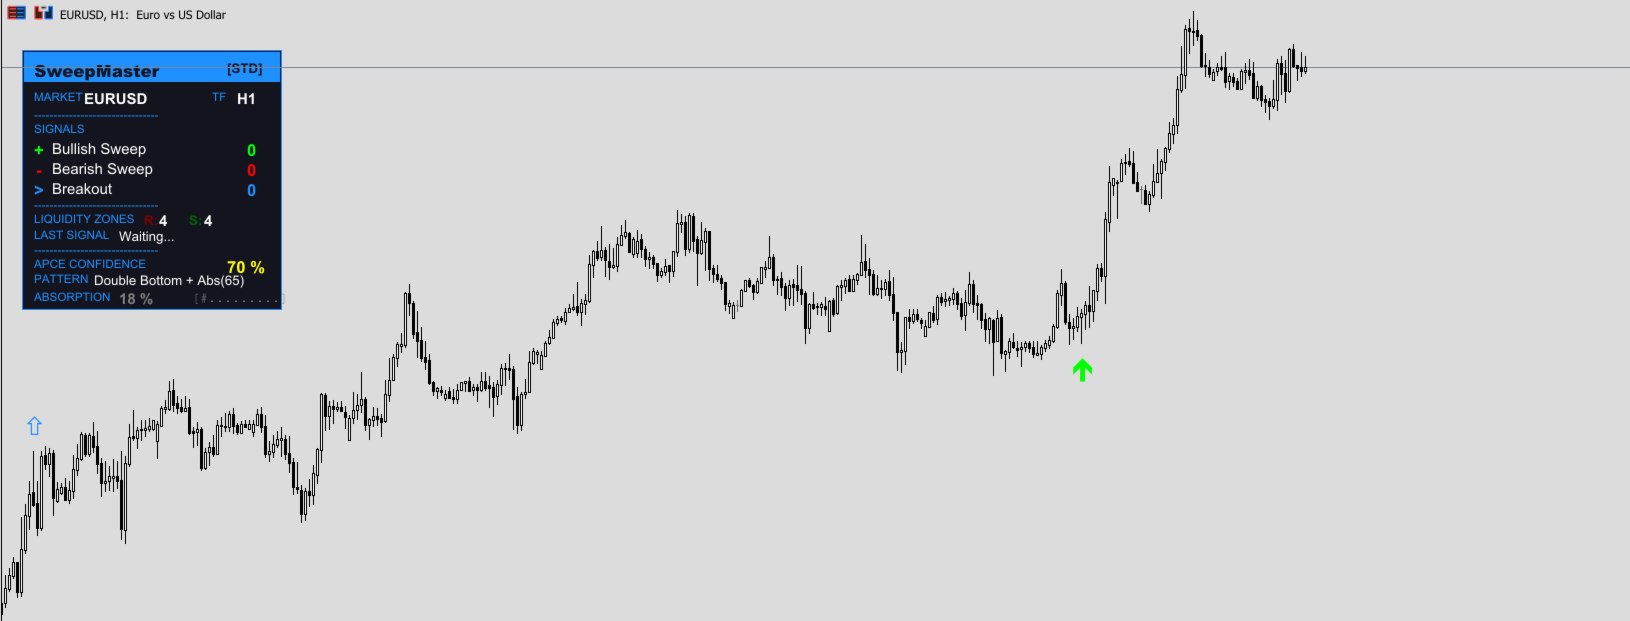
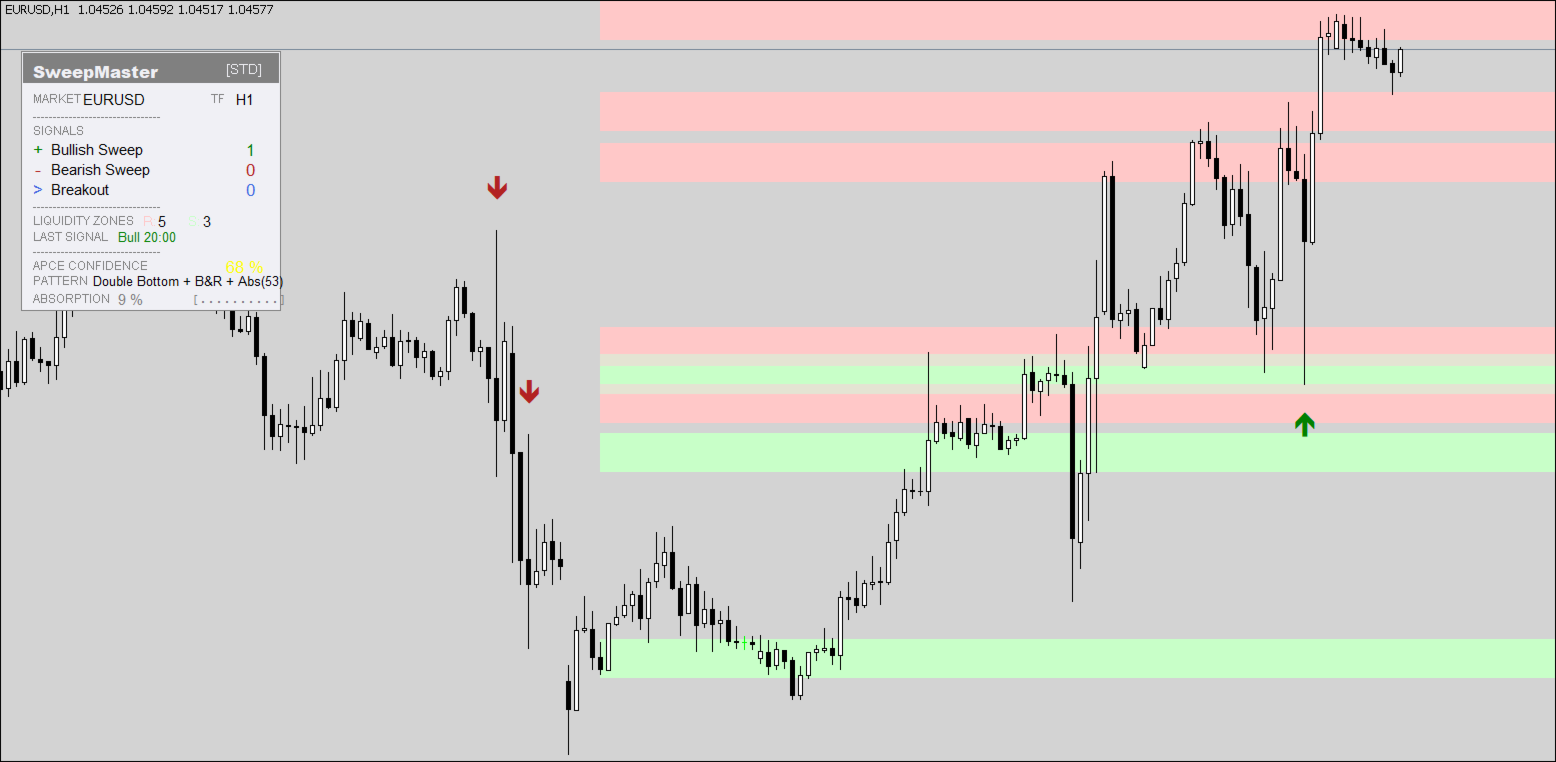
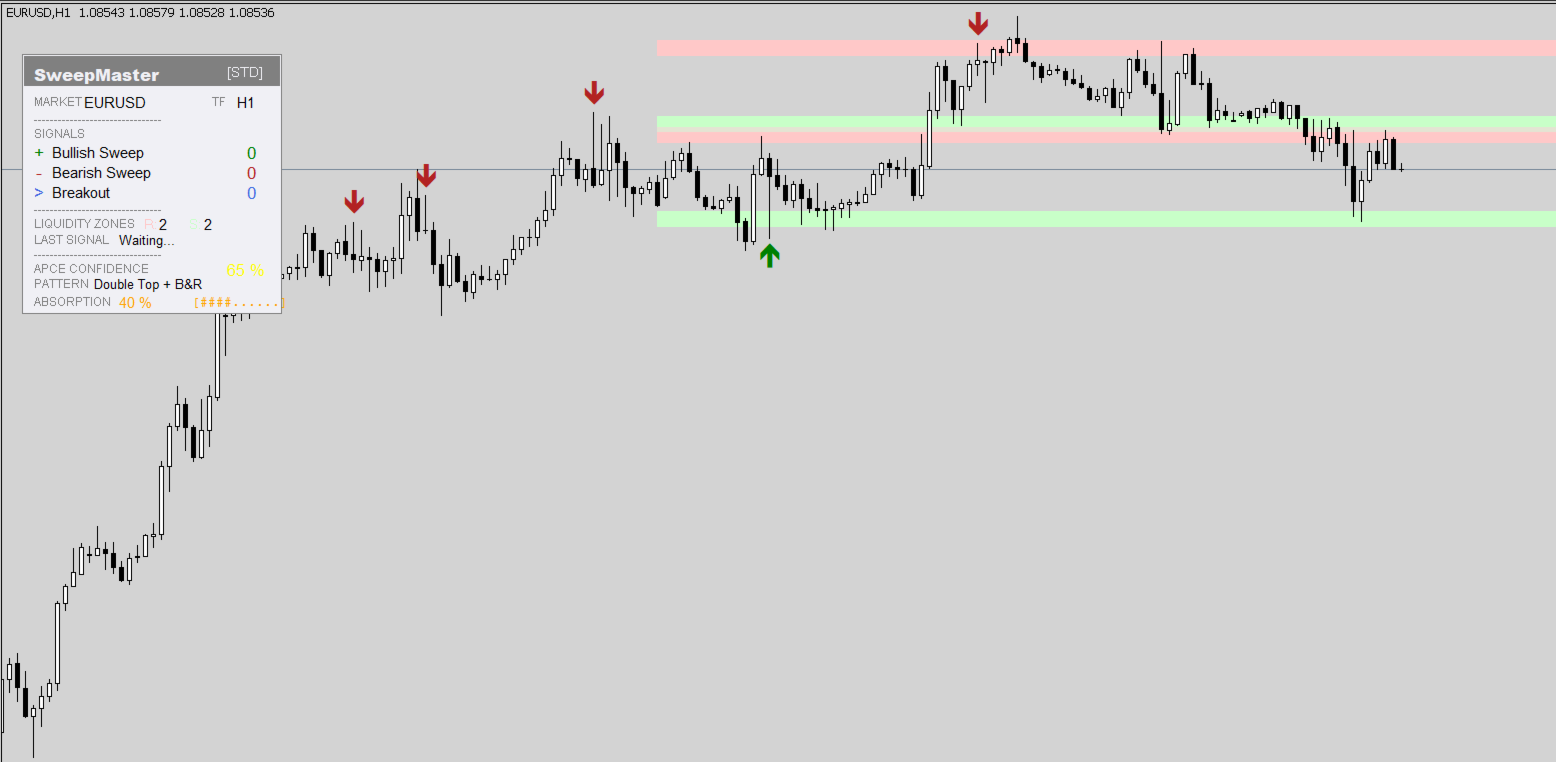
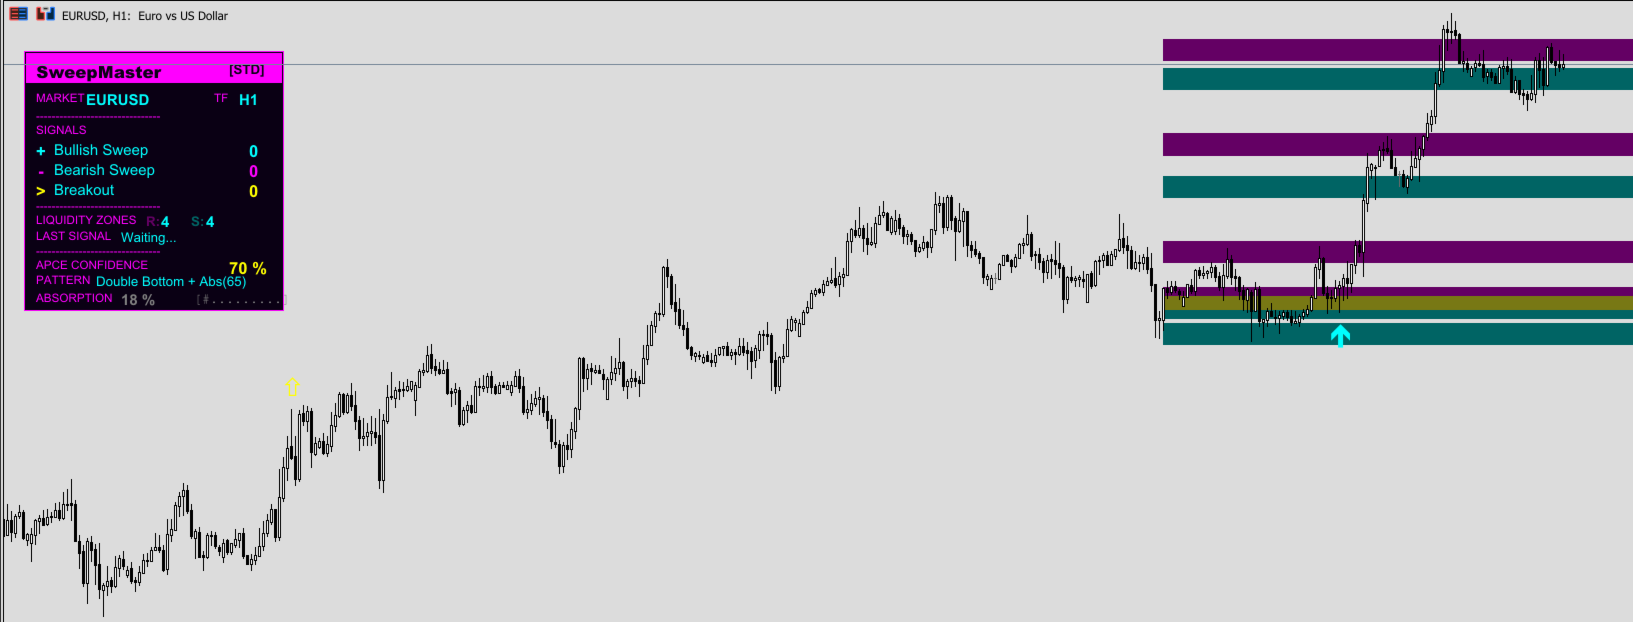
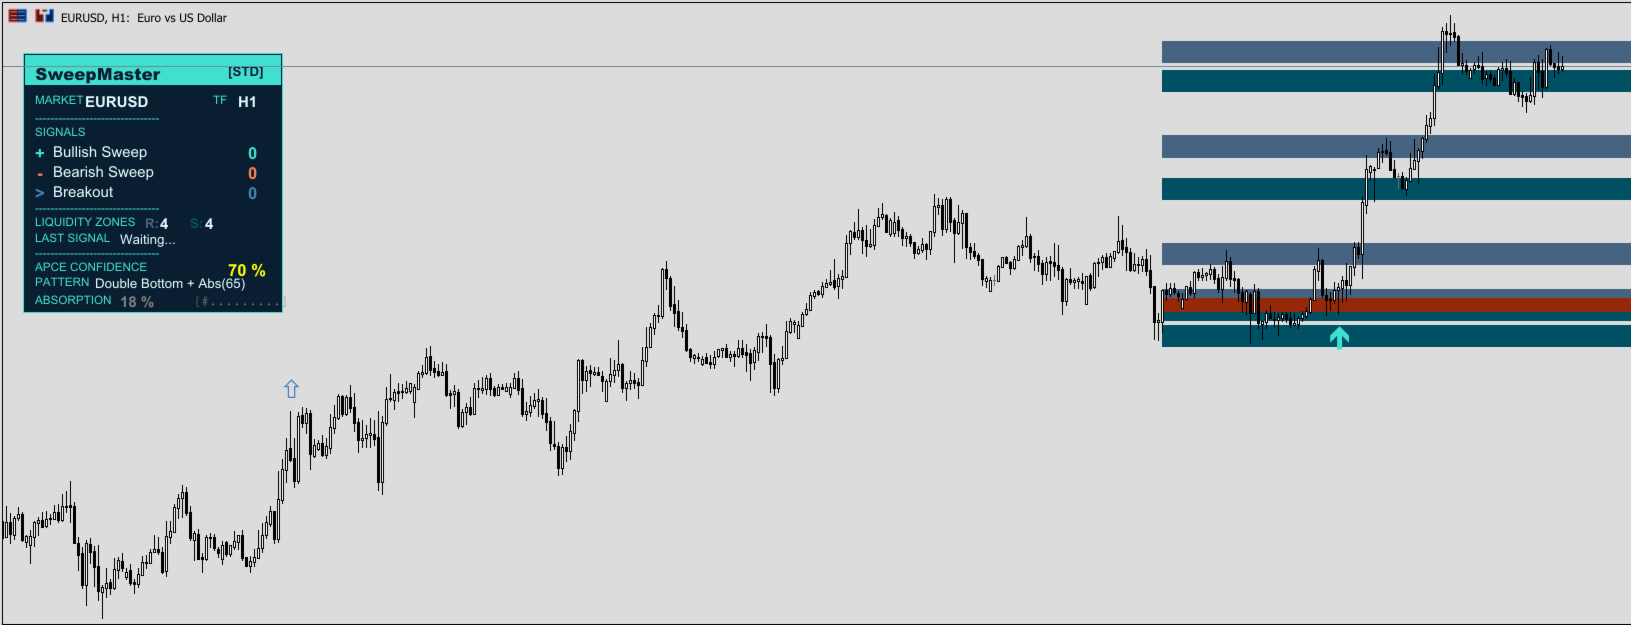
Dashboard

Contatore segnali in tempo reale

Visualizzazione del punteggio di fiducia APCE

Indicatore di forza di assorbimento

Visualizzazione della modalità di trading attiva

Sei temi colore disponibili

Modalità di visualizzazione

Standard: frecce e zone

Discrete: solo dashboard

Complete: tutti gli elementi visibili

Sistema di assorbimento del volume

Principio: alto volume combinato con movimento limitato del prezzo

Distribuzione del punteggio (0–100%):

Intensità del volume

Compressione del range

Coerenza comportamentale

Rifiuto delle candele

Equilibrio del prezzo

Climax di volume

Allineamento direzionale

Workflow

Selezione della modalità di trading

Rilevazione della rottura di livelli di supporto/resistenza

Conferma tramite analisi del volume

Validazione del riconoscimento dei pattern

Valutazione dell’assorbimento

Visualizzazione del segnale con punteggio di fiducia

Due scorciatoie da tastiera: P e Z


Prodotti consigliati
Indicatore Crypto_Forex "Hanging Man and Inverted Hammer pattern" per MT5. - L'indicatore "Hanging Man and Inverted Hammer pattern" è un indicatore molto potente per il trading Price Action: nessuna rielaborazione, nessun ritardo. - L'indicatore rileva i pattern rialzisti Inverted_Hammer e ribassisti Hanging_Man sul grafico: - Bullish Inverted_Hammer - Segnale freccia blu sul grafico (vedi immagini). - Bearish Hanging_Man - Segnale freccia rossa sul grafico (vedi immagini). - PC &  Mobile aler
Pips On Candles
Giuseppe Nittoli
Pips on Candles mostra il numero di pips coinvolte in ogni candela del grafico. E' possibile impostare 3 range differenti per il conteggio su ogni singola candela tramite il parametro RangeType : Con " HighLow " si contano le pips presenti tra il minimo e il massimo. Il numero viene mostrato sotto ogni candela del grafico. Con " OpenClose " si contano le pips presenti tra il prezzo d'apertura e quello di chiusura della candela.   Il numero viene mostrato sotto ogni candela del grafico. Con " Hi
Indicatore di inversione a barre - FTU Lenster MT5 Un comune indicatore di analisi a barre di tipo inversione - input per un'osservazione unica L'inversione di prezzo è un valido strumento per studiare potenziali movimenti di prezzo. Il prezzo sta testando o rifiutando un'area e il suo comportamento rispetto alle barre precedenti indica la futura azione del prezzo. Combinalo con altri indicatori e studi di prezzo per il tuo sistema di trading. //---- Installa ----// Dopo il download, colle
Liga
Andriy Sydoruk
The indicator connects the price in a cyclical-wave relationship. Thus, all intersection points will be optimal points at which the movement changes taking into account the indicator period. Crossing points can be used as potential market reversal points. But do not forget that the approach must be complex, the indicator signals require additional information to enter the market. Suitable for forex, futures and binary options without redrawing. It gives a lot of signals, which requires additio
A useful and convenient tool for traders when analyzing and making decisions. Peculiarity The main feature of this indicator is its fast algorithm . The gain in the speed of calculating the polynomial and its value of the standard deviation in comparison with classical algorithms reaches several thousand times. Also, this indicator includes a Strategy Tester with a clear visualization of transactions, an equity chart and simultaneous calculation and display of the following data in the form of
Beauty Trend
Nikolay Kositsin
Простой индикатор тренда в NRTR виде с отрисовкой линий стоплосса и тейпрофита, цвет и направление движения которых определяются действующим трендом. Индикатор имеет возможность подавать алерты, отправлять почтовые сообщения и push-сигналы при смене направления тренда. Следует учесть что значение входного параметра индикатора Deviation of the take profit line in points для каждого финансового актива на каждом таймфрейме   необходимо подбирать индивидуально!
Ticks ADX
Andrej Nikitin
The Average Directional Movement Index indicator drawn using a tick chart. After launching it, wait for enough ticks to come. Parameters: Period - period of averaging. Сalculated bar - number of bars on the chart for the indicator calculation. Buffer indexes: 0 - MAIN_LINE, 1 - PLUSDI_LINE, 2 - MINUSDI_LINE.
LevelPAttern MT5 is a technical indicator based on the daily levels and Price Action patterns. The indicator is based on the standard ZigZag indicator + reversal candlestick pattens, such as Star, Hammer (also knows as Pin bar), Engulfing and others. The indicator generates audio and text notifications when a pattern is formed and a level is touched. It also supports sending email and push notifications. Indicator operation features It is suitable for working with any CFD and FOREX trading inst
Gecko EA MT5
Profalgo Limited
5 (1)
NEW PROMO: Only a few copies copies available at 349$ Next price: 449$ Make sure to check out our " Ultimate EA combo package " in our   promo blog ! Gecko runs a simple, yet very effective, proven strategy.  It looks for important recent support and resistance levels and will trade the breakouts.  This is a "real" trading system, which means it will use a SL to protect the account.  It also means it will not use any dangerous techniques like martingale, grid or averaging down. The EA shows its
Separating Lines Trading System for MetaTrader 5 Separating Lines Trading System is a price action indicator for MT5 designed to detect 2-bar continuation patterns where both candles share the same opening level and the second candle resumes the prevailing trend. A detailed user guide is available on the author’s MQL5 Blog . Additional updates are available through the author’s   MQL5 Channel . Depending on the current support policy, buyers may receive additional access to selected companion t
RBreaker
Zhong Long Wu
RBreaker Gold Indicators is a short-term intraday trading strategy for gold futures that combines trend following and intraday reversal approaches. It not only captures profits during trending markets but also enables timely profit-taking and counter-trend trading during market reversals. This strategy has been ranked among the top ten most profitable trading strategies by the American magazine   Futures Truth   for 15 consecutive years. It boasts a long lifecycle and remains widely used and st
ZeroLag TrendCandle Signal
Martin Alejandro Bamonte
ZeroLag TrendCandle — Sistema di colorazione delle candele e allarmi in tempo reale (Senza Repainting) ZeroLag TrendCandle è uno strumento di rilevamento del trend in tempo reale che applica una colorazione delle candele senza repaint basata su un'analisi avanzata dell'indicatore Williams Percent Range (WPR). Evidenzia i cambiamenti di trend, le variazioni di momentum e i potenziali inversioni tramite un sistema cromatico dinamico — consentendo ai trader di capire immediatamente la direzione d
"Adjustable Fractals" - è una versione avanzata dell'indicatore frattale, uno strumento di trading molto utile! - Come sappiamo, l'indicatore MT5  Standard fractals non ha impostazioni, il che è molto scomodo per i trader. - Adjustable Fractals ha risolto questo problema, ha tutte le impostazioni necessarie: - Periodo regolabile dell'indicatore (valori consigliati: superiori a 7). - Distanza regolabile dai massimi/minimi del prezzo. - Design regolabile delle frecce frattali. - L'indicatore è do
Japanese Candlestick Indicator
Alexander Denisovich Jegorov
Simple Japanese candlestick indicator Contains 3 patterns: - bearish engulfing - bullish engulfing - doji Only contains these 3 because after rigorous testing and trading (data) these seem to be the most efficient. Also contains: - alerts if enabled  When japanese candlestick is detected it is colored with relevant color depending on bias, and also shows label next to it. Labels: - BEG = Bearish engulfing - BE = Bullish engulfing - DO = Doji
Indicator Description (based on AVPT EA ): This indicator visualizes a Volume Profile-based liquidity architecture on the chart by analyzing where trading volume is concentrated across price levels over a specified lookback period. It calculates key volume structures such as: Point of Control (POC): the price level with the highest traded volume. Value Area (VA): the range containing a configurable percentage of total volume (typically ~70%). High-Volume Nodes (HVNs): price levels with sign
FREE
Horizon MACD Radar is an MT5 indicator that monitors the direction of MACD (or OsMA) across three timeframes—long, mid, and short—and plots an arrow signal only at the moment all three align in the same direction. The default setup is H1 (Long) → M15 (Mid) → M5 (Short). This helps reduce entries against the higher-timeframe flow and prevents impulsive trades when the market is not fully aligned, allowing you to focus only on situations where the overall environment is properly set. The dashboard
Tops and Bottoms Indicator
Josue De Matos Silva
4.6 (5)
Tops & Bottoms Indicator FREE   Tops abd Bottoms:   An effective indicator for your trades The tops and bottoms indicator helps you to find  ascending and descending channel formations with indications of ascending and/or descending tops and bottoms. In addition, it  show possibles  opportunities with a small yellow circle when the indicator encounters an impulse formation. This indicator provide to you  more security and speed in making entry decisions. Also test our FREE advisor indicator:  
FREE
RSI Trendline Breakout Pro   RSI indicator with automatic trendline detection and high-precision breakout signals. Overview Transform your trading with the most advanced RSI trendline breakout system available on the market. This professional indicator combines sophisticated zone-based analysis with automatic trendline detection to deliver high-precision trading signals that work across all timeframes and market conditions. Key Features Advanced Signal Detection Zone-based RSI analysis with aut
Upper and Lower Reversal - Sistema per la previsione anticipata dei momenti di inversione. Ti consente di trovare punti di svolta dei prezzi ai confini dei canali di movimento dei prezzi superiore e inferiore. L'indicatore non si ricolorerà né cambierà mai la posizione delle frecce del segnale. Le frecce rosse sono un segnale di acquisto, le frecce blu sono un segnale di vendita. Si adatta a qualsiasi intervallo temporale e strumento di trading L'indicatore non si ridisegna, funziona solo quan
C300 SYNTHETIC INDICATOR 1MIN CHART Update V2 No repaint  *The indicator will not give a sell sign if the market conditions are not in place.  *With all 3 strategy criteria in place the strategy based indicator signals 1-3 trades per day. *The drawdown can range to very high you need to place your own target profit and stop loss according to your risk management system .  *The indicator is designed for only C300 and the 1min chart .  NB :Note this strategy based indicator will be free only for
Permettetemi di presentarvi il Golden Sniper Indicator , un potente strumento MQL5 creato con cura per i trader che desiderano migliorare la propria esperienza di trading. Sviluppato da un team di trader esperti con oltre 6 anni di esperienza , questo indicatore offre un metodo affidabile per identificare opportunità di trading con una notevole precisione. Caratteristiche principali : Allarmi e frecce di segnale : Il Golden Sniper Indicator fornisce allarmi tempestivi e frecce di segnale visive
KDJ Index 4   交易实用必备工具指标 波浪自动计算指标,通道趋势交易 完美的趋势-波浪自动计算通道计算 , MT4版本 完美的趋势-波浪自动计算通道计算 , MT5版本 本地跟单复制交易 Easy And Fast Copy , MT4版本 Easy And Fast Copy , MT5版本 本地跟单复制交易 模拟试用 Easy And Fast Copy , MT4 模拟账号运行 Easy And Fast Copy , MT5 模拟账号运行 "Cooperative QQ:556024  "  "Cooperation wechat:556024"  "Cooperative email:556024@qq.com" 强烈推荐趋势指标, 波浪的标准自动计算   和   波浪的标准自动计算MT5版本     KDJ指标又叫 随机指标 ,是一种相当新颖、实用的技术分析指标,它起先用于期货市场的分析,后被广泛用于股市的中短期趋势分析,是期货和股票市场上最常用的技术分析工具。 随机指标KDJ一般是用于股票分析的统计体系,根据统计学原理,通过一个特定的周期(常为9日、9周等)
Free Meta Trader 5 Professional Marketplace Description (Formal & Detailed) Title: RSI Cloud Momentum & Trend Visualizer Overview: The RSI Cloud is an advanced trend-following indicator that transforms the classic Relative Strength Index (RSI) into a comprehensive visual system. By utilizing a dual-line approach—typically an RSI line and its smoothed Signal average—it creates a dynamic "Cloud" (filling) that identifies the current market sentiment at a glance. Key Features: Trend Identification
Outside bars  (Außenstäbe)  are important in professional price action trading and were made popular by Michael Voigt.  Highs and lows of outside bars ( Aussenstäbe ) can be utilized as entry and exit for trades following different strategies. With combining different timeframes you can more easily detect the overall trend of the market, see potential resistance and support levels and also detect change in trend and framing of the market.  Examples for strategies with inside bars (Innenstäbe) an
A lot of professional traders use high quality divergence signals as a part of their strategy to enter a position. Spotting correct divergences quickly can often be hard, especially if your eye isn’t trained for it yet. For this reason we’ve created a series of easy to use professional oscillator divergence indicators that are very customisable so you get only the signals you want to trade. We have this divergence indicator for RSI, MACD, Stochastics, CCI and OBV. RSI:   https://www.mql5.com/en/
Engulfing with EMAs Indicator Unlock the power of advanced candlestick pattern detection with the Engulfing with EMAs Indicator , a cutting-edge tool designed for MetaTrader 5. This futuristic indicator combines the precision of engulfing pattern analysis with the trend-following strength of Exponential Moving Averages (EMA 21 and EMA 50), empowering traders to identify high-probability setups across all currency pairs and timeframes. Key Features: Comprehensive Engulfing Detection : Detects b
Neon Trade — una soluzione di trading all'avanguardia che ti apre la porta alla libertà finanziaria e al più alto livello di trading Ho cercato di creare una soluzione di trading unica in grado di soddisfare le esigenze di qualsiasi trader, indipendentemente dai suoi obiettivi. L'idea principale era combinare l'apprendimento automatico con tecniche di trading avanzate in modo da massimizzare i benefici del loro uso combinato. Il sistema è adatto sia per far crescere piccoli depositi in 1-2 mesi
I've combined two trading strategies, the Order Block Strategy and the FVG Trading Strategy, by utilizing a combination of the FVG indicators and Order Blocks. The results have been surprisingly effective. This is a two-in-one solution that makes it easy for traders to identify critical trading zones. I've optimized the settings so that all you need to do is install and trade; it's not overly complex to explain further. No need for any usage instructions regarding the trading method. You shoul
I am placing the indicator obtained as a result of market analysis, it may be useful to someone. The indicator shows how quickly the price changes (where there is a trend), and where there is no obvious trend. With the right settings, you can know the beginning of the trend in advance. The indicator measures the slope / rate of change / ratio of the moving average on the current bar relative to the previous bar. The settings specify the ratio limit for a downtrend and a ratio limit for an upt
MercariaPattern1-2-3 відстежує рух ціни, знаходить трьоххвильові структури 1-2-3 та підсвічує момент, коли сценарій підтверджується пробоєм ключового рівня. MercariaPattern1-2-3 tracks price movement, detects three-leg 1-2-3 structures and highlights the moment when the scenario is confirmed by a key level breakout. Індикатор збирає локальні свінги в компактну фігуру 0–1–2–3 , чекає підтвердженого пробою та будує стрілку входу з готовими рівнями SL/TP. The indicator combines local swings into a
Gli utenti di questo prodotto hanno anche acquistato
Divergence Bomber
Ihor Otkydach
4.9 (86)
Ogni acquirente dell’indicatore riceverà inoltre gratuitamente: L’utilità esclusiva “Bomber Utility”, che gestisce automaticamente ogni operazione, imposta i livelli di Stop Loss e Take Profit e chiude le posizioni secondo le regole della strategia I file di configurazione (set file) per adattare l’indicatore a diversi asset I set file per configurare il Bomber Utility in tre modalità: “Rischio Minimo”, “Rischio Bilanciato” e “Strategia di Attesa” Una guida video passo-passo per installare, conf
Entry In The Zone and SMC Multi Timeframe is a real-time 2-in-1 market analysis tool that combines market structure analysis and a No Repaint BUY / SELL signal system into a single indicator, built on Smart Money Concepts (SMC) — a widely adopted framework used by professional traders to understand market structure. This indicator helps you see the market more clearly, make decisions based on structure rather than guesswork, and focus on high-probability zones where price is more likely to react
Quantum TrendPulse
Bogdan Ion Puscasu
5 (23)
Ecco   Quantum TrendPulse   , lo strumento di trading definitivo che combina la potenza di   SuperTrend   ,   RSI   e   Stocastico   in un unico indicatore completo per massimizzare il tuo potenziale di trading. Progettato per i trader che cercano precisione ed efficienza, questo indicatore ti aiuta a identificare con sicurezza le tendenze di mercato, i cambiamenti di momentum e i punti di entrata e uscita ottimali. Caratteristiche principali: Integrazione SuperTrend:   segui facilmente l'andame
Se acquisti questo indicatore, riceverai il mio Trade Manager Professionale + EA  GRATUITAMENTE. Innanzitutto è importante sottolineare che questo sistema di trading è un indicatore Non-Repainting, Non-Redrawing e Non-Lagging, il che lo rende ideale sia per il trading manuale che per quello automatico. Corso online, manuale e download di preset. Il "Sistema di Trading Smart Trend MT5" è una soluzione completa pensata sia per i trader principianti che per quelli esperti. Combina oltre 10 indicat
Gann Made Easy è un sistema di trading Forex professionale e facile da usare che si basa sui migliori principi del trading utilizzando la teoria di mr. WD Gann. L'indicatore fornisce segnali ACQUISTA e VENDI accurati, inclusi i livelli di Stop Loss e Take Profit. Puoi fare trading anche in movimento utilizzando le notifiche PUSH. CONTATTAMI DOPO L'ACQUISTO PER RICEVERE GRATUITAMENTE LE ISTRUZIONI DI TRADING E OTTIMI INDICATORI EXTRA! Probabilmente hai già sentito parlare molte volte dei metodi d
Azimuth Pro
Ottaviano De Cicco
5 (6)
Azimuth Pro V2: Synthetic Fractal Structure and Confirmed Entries for MT5 Overview Azimuth Pro is a multi-level swing structure indicator by Merkava Labs . Four nested swing layers, swing-anchored VWAP, ABC pattern detection, three-timeframe structural filtering, and closed-bar confirmed entries — one chart, one workflow from micro-swings to macro-cycles. This is not a blind signal product. It is a structure-first workflow for traders who care about location, context, and timing. V2 Launch Offe
OmniSync Projection
Antonio-alin Teculescu
5 (1)
Chronos Fractal Engine is an innovative price projection indicator for MetaTrader 5, designed to transform your technical analysis by intelligently identifying and projecting historical price patterns. Built upon an advanced correlation algorithm and the fractal principles of the market, this powerful tool visualizes potential future price movements, giving you a unique edge in your trading decisions. What is Chronos Fractal Engine? At its core, the Chronos Fractal Engine employs a sophisticat
FX Trend MT5 NG
Daniel Stein
5 (4)
FX Trend NG: La Nuova Generazione di Intelligenza di Trend Multi-Mercato Panoramica FX Trend NG è uno strumento professionale di analisi del trend multi-timeframe e monitoraggio dei mercati. Ti consente di comprendere la struttura completa del mercato in pochi secondi. Invece di passare tra numerosi grafici, puoi identificare immediatamente quali strumenti sono in trend, dove il momentum sta diminuendo e dove esiste un forte allineamento tra i timeframe. Offerta di Lancio – Ottieni FX Trend NG
Trend Screener Pro MT5
STE S.S.COMPANY
4.85 (104)
Indicatore di tendenza, soluzione unica rivoluzionaria per il trading di tendenze e il filtraggio con tutte le importanti funzionalità di tendenza integrate in un unico strumento! È un indicatore multi-timeframe e multi-valuta al 100% non ridipingibile che può essere utilizzato su tutti i simboli/strumenti: forex, materie prime, criptovalute, indici e azioni. Trend Screener è un indicatore di tendenza che segue un indicatore efficiente che fornisce segnali di tendenza a freccia con punti nel gra
Grabber System MT5
Ihor Otkydach
4.83 (23)
Ti presento un eccellente indicatore tecnico: Grabber, che funziona come una strategia di trading "tutto incluso", pronta all’uso. In un solo codice sono integrati strumenti potenti per l’analisi tecnica del mercato, segnali di trading (frecce), funzioni di allerta e notifiche push. Ogni acquirente di questo indicatore riceve anche gratuitamente: L’utility Grabber: per la gestione automatica degli ordini aperti Video tutorial passo dopo passo: per imparare a installare, configurare e utilizzare
Scopri quale strategia funziona davvero sul tuo simbolo - prima di rischiare denaro reale. Power Bar rileva le barre di prezzo estreme su qualsiasi simbolo e qualsiasi timeframe, poi esegue istantaneamente il backtest di 3 diverse strategie di trading per confrontare tassi di vincita, fattori di profitto e P&L fianco a fianco. Tutto in un unico pannello interattivo. Niente supposizioni. Niente curve-fitting. Solo dati. Cosa rende Power Bar unico? La maggior parte degli indicatori fornisce un se
CGE Trading Suite
Carl Gustav Johan Ekstrom
5 (2)
Institutional-Grade Analytics for MT5 C GE Trading Suite delivers the analytical edge typically reserved for professional trading desks. The platform integrates a full suite of analytical tools into one seamless workflow: dynamic grid mapping, liquidity behavior analysis, ECM, trend lines, MIDAS, trade cycles, and directional channel projections. Together, these provide a unified view of market structure and momentum. Directional clarity is further enhanced by the capital flow index, which meas
SignalTech MT5 is a trading system for EURUSD, USDCHF, USDJPY, AUDUSD, NZDUSD, EURJPY, AUDJPY, NZDJPY, CADJPY H2 and H3 Timeframe.  It can generate signals with Buy/Sell Arrows and Pop-Up/Sound Alerts. Each signal has clear Entry and Stop Loss levels, which should be automatically flagged on the chart, as well as potential Targets 1, 2, and 3. The Entry and TP levels are fixed after the trade is taken. The exit level is dynamic. If there are signs of a potential short-term trend reversal, the
Atomic Analyst MT5
Issam Kassas
3.94 (31)
Innanzitutto, vale la pena sottolineare che questo indicatore di trading non è repaint, non è ridisegno e non presenta ritardi, il che lo rende ideale sia per il trading manuale che per quello automatico. Manuale utente: impostazioni, input e strategia. L'Analista Atomico è un indicatore di azione del prezzo PA che utilizza la forza e il momentum del prezzo per trovare un miglior vantaggio sul mercato. Dotato di filtri avanzati che aiutano a rimuovere rumori e segnali falsi, e aumentare il pote
FX Power MT5 NG
Daniel Stein
5 (31)
FX Power: Analizza la Forza delle Valute per Decisioni di Trading Più Intelligenti Panoramica FX Power è lo strumento essenziale per comprendere la reale forza delle principali valute e dell'oro in qualsiasi condizione di mercato. Identificando le valute forti da comprare e quelle deboli da vendere, FX Power semplifica le decisioni di trading e rivela opportunità ad alta probabilità. Che tu segua le tendenze o anticipi inversioni utilizzando valori estremi di Delta, questo strumento si adatta
Btmm state engine pro
Garry James Goodchild
5 (4)
BTMM State Engine Pro is a MetaTrader 5 indicator for traders who use the Beat The Market Maker approach: Asian session context, kill zone timing, level progression, peak formation detection, and a multi-pair scanner from a single chart. It combines cycle state logic with a built-in scanner dashboard so you do not need the same tool on many charts at once. What it does Draws the Asian session range; session times can follow broker server offset or be set in inputs. Tracks level progression (L
Presentazione       Quantum Breakout PRO   , l'innovativo indicatore MQL5 che sta trasformando il modo in cui scambi le zone di breakout! Sviluppato da un team di trader esperti con un'esperienza di trading di oltre 13 anni,       Quantum Breakout PRO       è progettato per spingere il tuo viaggio di trading a nuovi livelli con la sua strategia innovativa e dinamica della zona di breakout. Quantum Breakout Indicator ti fornirà frecce di segnalazione sulle zone di breakout con 5 zone target di
Bill Williams Advanced
Siarhei Vashchylka
5 (11)
Bill Williams Advanced is designed for automatic chart analysis using Bill Williams' "Profitunity" system. The indicator analyzes four timeframes at once. Manual (Be sure to read before purchasing) Advantages 1. Analyzes the chart using Bill Williams' "Profitunity" system. Signals are displayed in a table in the corner of the screen and on the price chart. 2. Finds all known AO and AC signals, as well as zone signals. Equipped with a trend filter based on the Alligator. 3. Finds "Divergence Bar
Berma Bands
Muhammad Elbermawi
5 (8)
L'indicatore Berma Bands (BBs) è uno strumento prezioso per i trader che cercano di identificare e capitalizzare i trend di mercato. Analizzando la relazione tra il prezzo e le BBs, i trader possono discernere se un mercato è in una fase di trend o di range. Visita il [ Berma Home Blog ] per saperne di più. Le Berma Bands sono composte da tre linee distinte: la Upper Berma Band, la Middle Berma Band e la Lower Berma Band. Queste linee sono tracciate attorno al prezzo, creando una rappresentazion
Auto Optimized Parabolic RSI: Motore di Momentum 3D Avanzato La maggior parte degli indicatori per trader privati fallisce perché si affida a parametri statici che smettono di funzionare nel momento in cui la volatilità del mercato cambia. Auto Optimized Parabolic RSI risolve il problema dell'"obsolescenza dell'indicatore" ricalcolando continuamente il proprio vantaggio matematico, portando un adattamento quantitativo di livello istituzionale direttamente sul tuo terminale MT5. Il Vantaggio Prin
Meridian Pro
Ottaviano De Cicco
5 (1)
Meridian Pro: Professional Multi-Timeframe Trend Matrix for MT5 Overview Meridian Pro is a multi-timeframe trend matrix by Merkava Labs that compresses directional state, strength, momentum condition and matrix agreement into one compact panel. One adaptive engine, applied consistently from M1 to W1. No per-symbol tuning. No indicator stacking. One structured readout across every asset and every timeframe. Launch Offer — Get Meridian Pro for USD 99 (introductory). Regular price: USD 149. 1. Why
ARICoins
Temirlan Kdyrkhan
ARICoin is a powerful trading companion designed to generate high-probability entry signals with dynamic TP/SL/DP levels based on volatility. Built-in performance tracking shows win/loss stats, PP1/PP2 hits, and success rates all updated live. Key Features: Buy/Sell signals with adaptive volatility bands Real-time TP/SL/DP levels based on ATR Built-in MA Filter with optional ATR/StdDev volatility Performance stats panel (Success, Profit/Loss, PP1/PP2) Alerts via popup, sound, push, or email Cust
Meravith Scanner
Ivan Stefanov
5 (1)
MERAVITH SCANNER è un indicatore professionale per i mercati finanziari su MetaTrader 5, che integra più strumenti di analisi in un unico sistema. Esegue tutti i calcoli automaticamente utilizzando una metodologia proprietaria basata sul prezzo medio ponderato per il volume (VWAP), eliminando completamente l’interpretazione soggettiva. L’indicatore funziona su tutte le classi di asset (Forex, Azioni, Indici, Commodities, Criptovalute) e su tutti i timeframe, da M1 a Mensile. Il principio fondame
La Master Edition è uno strumento analitico di livello professionale progettato per visualizzare la struttura del mercato attraverso l'obiettivo del volume e del flusso di denaro. A differenza degli indicatori di volume standard, questo strumento visualizza un Profilo di Volume Giornaliero direttamente sul tuo grafico, permettendoti di vedere esattamente dove si è verificata la scoperta dei prezzi e dove è posizionato il "denaro intelligente". Questa Master Edition è progettata per chiarezza e v
L'indicatore Quadrato di Gann è uno strumento potente di analisi di mercato basato sull'articolo "Formula Matematica per le Previsioni di Mercato" scritto da W.D. Gann. Questo strumento utilizza concetti matematici e teorie di Gann per effettuare un'analisi precisa del mercato. Utilizza i quadrati di 144, 90, 52 e anche il quadrato di 9. Inoltre, integra il metodo del  per il quadrato di 9 e la sua relazione con canali e modelli stellari di quel quadrato. Manuale Utente e Applicazione: Prima di
Cvd Divergence
Thalles Nascimento De Carvalho
CVD Divergence – Analisi Professionale del Flusso Ordini e delle Divergenze CVD Divergence è un indicatore tecnico progettato per rilevare divergenze affidabili tra il prezzo e il Cumulative Delta Volume (CVD). Identifica con precisione i momenti in cui il flusso reale degli ordini non conferma il movimento del prezzo, rivelando possibili inversioni, esaurimento del momentum e manipolazioni istituzionali. L’indicatore combina la lettura del volume aggressivo con l’analisi strutturale del prezzo,
FX Volume MT5
Daniel Stein
4.79 (24)
FX Volume: Scopri il Vero Sentimento di Mercato dalla Prospettiva di un Broker Panoramica Rapida Vuoi portare la tua strategia di trading a un livello superiore? FX Volume ti offre informazioni in tempo reale su come i trader retail e i broker sono posizionati—molto prima che compaiano report in ritardo come il COT. Che tu miri a guadagni costanti o desideri semplicemente un vantaggio più solido sui mercati, FX Volume ti aiuta a individuare grandi squilibri, confermare i breakout e perfezionar
Innanzitutto, vale la pena sottolineare che questo Strumento di Trading è un Indicatore Non-Ridipingente, Non-Ridisegnante e Non-Laggante, il che lo rende ideale per il trading professionale. Corso online, manuale utente e demo. L'Indicatore Smart Price Action Concepts è uno strumento molto potente sia per i nuovi che per i trader esperti. Racchiude più di 20 utili indicatori in uno solo, combinando idee di trading avanzate come l'Analisi del Trader del Circolo Interno e le Strategie di Tradin
Gartley Hunter Multi
Siarhei Vashchylka
5 (11)
Gartley Hunter Multi - An indicator for searching for harmonic patterns simultaneously on dozens of trading instruments and on all possible timeframes. Manual (Be sure to read before purchasing) | Version for MT4 Advantages 1. Patterns: Gartley, Butterfly, Shark, Crab. Bat, Alternate Bat, Deep Crab, Cypher 2. Simultaneous search for patterns on dozens of trading instruments and on all possible timeframes 3. Search for patterns of all possible sizes. From the smallest to the largest 4. All fou
Questo cruscotto mostra gli ultimi   pattern armonici   disponibili per i simboli selezionati, in modo da risparmiare tempo ed essere più efficienti /   versione MT4 . Indicatore gratuito:   Basic Harmonic Pattern Colonne dell'indicatore Symbol :   vengono visualizzati i simboli selezionati Trend:   rialzista o ribassista Pattern:   tipo di pattern (gartley, butterfly, bat, crab, shark, cypher o ABCD) Entry:   prezzo di ingresso SL:   prezzo di stop loss TP1:   1 prezzo di take profit TP2:
Altri dall’autore
Volume Profile Density V2.40 Mostra la distribuzione del volume per livello di prezzo, evidenziando le zone di interesse istituzionale. A differenza del volume tradizionale (nel tempo), indica dove il volume si è realmente concentrato. Principi base: Barre orizzontali = volume scambiato a ciascun prezzo Barra più lunga → volume maggiore Zone rosse = principali supporti/resistenze Utilizzi principali: Identificare supporti e resistenze reali Determinare il POC (Point of Control) Definire la Value
FREE
Iceblock Volume
Vincent Jose Proenca
5 (1)
Frase breve: Iceblock — indicatore MT4 che identifica cluster di alto volume con limitato movimento di prezzo (comportamento simile a iceberg). TF: Funziona su tutti i timeframe (M1–D1). Coppie: Compatibile con Forex, indici, oro e CFD. Impostazioni: VolumeLookback – numero di candele per la media del volume VolumeThreshold – moltiplicatore per considerare il volume anormale ClusterSize – numero di candele vicine per confermare un cluster RangeComparisonPeriod – periodo per la media degli int
FREE
CustomBreakout
Vincent Jose Proenca
Range Breakout EA – Simple Description Concept An automated trading robot for MetaTrader 5 that exploits range breakouts with two key periods: Features Automatic market hours management Customizable Stop Loss and Take Profit Smart Trailing Stop Built-in testing mode for simulation Detailed logs for monitoring How It Works Records extreme prices at the start of the day Waits for a breakout of the secondary range Opens a position in the breakout direction Automatically manages the trade (SL/TP/Tr
FREE
Pivot PDHL Levels
Vincent Jose Proenca
AutoPivot – Indicatore automatico dei punti pivot Indicatore MT4 che mostra i punti pivot (PP, R1/R2/R3, S1/S2/S3) e i livelli del giorno precedente (PDH/PDL). Caratteristiche principali: Adattamento automatico al timeframe del grafico (H4/D1/W1) Zone tra PDH/PDL e il livello di supporto/resistenza più vicino 8 temi di colore preconfigurati Personalizzazione completa di colori, stili di linea e opacità delle zone Etichette compatte con visualizzazione opzionale del prezzo Aggiornamenti automatic
VWAP Personnal Custom
Vincent Jose Proenca
VWAP_PC_MQL5 — a simple home-built VWAP indicator showing real-time volume-weighted price levels directly on your MT5 chart. TF: Works on all timeframes. Pair: Compatible with all symbols — Forex, indices, commodities, and stocks. Settings: Applied Price – price type used for VWAP calculation (Close, Typical, Weighted, etc.) Line Color / Width / Style – customize VWAP line appearance Session Reset – optional reset per day or continuous mode How it works (VWAP principle): VWAP (Volume Weighted
FREE
PDHL – simply displays the highs and lows of previous days directly on your chart, providing a quick and visual reference of past key levels. The indicator is lightweight and easily customizable , allowing you to adjust the number of days displayed, the colors, as well as the style and thickness of the lines to suit your preferences. It is designed to be simple and practical, but may not work on all instruments or platforms . Only teste Tested only with CFDs
FREE
VolumeSR MT4
Vincent Jose Proenca
his indicator automatically identifies key support and resistance levels by analyzing volume patterns. Unlike traditional S/R tools that rely only on price, Volume S/R finds levels where the market truly reacted.   DETECTION LOGIC: - High Volume Zones: Price levels where strong buying/selling occurred - Low Volume Zones: Areas of weak interest - potential breakout or reversal zones   SMART FILTERING: - Nearby levels are automatically merged to avoid chart clutter - Maximum levels limit keeps yo
FREE
Custom Box CFDs
Vincent Jose Proenca
Range Box Indicator for Trading Sessions This indicator allows traders to visualize and analyze specific time ranges directly on their chart by drawing rectangular boxes for each trading session. Key Features: Customizable session interval: set your own session start and end times. Number of days displayed: choose how many past sessions are visible. Default color and special color for Monday: easily highlight weekly patterns. Adjustable border width: customize the appearance of the rectangles to
FREE
VMS Oscillator
Vincent Jose Proenca
Volume & Move Strength (VMS) Indicator for MT5 The VMS Indicator displays the relationship between trading volume and price movement strength, helping traders assess how well market activity supports price action. How It Works: Measures tick volume as trading activity. Calculates move strength using a normalized True Range (%). Both values can be smoothed (default: 5) and optionally normalized (0–100) for consistency across markets. Plots two lines in a separate window: Blue (Volume) – trading a
FREE
Dynamic Pivot Zones
Vincent Jose Proenca
Dynamic Pivot Zones – Your Level Assistant on the Chart This indicator is a bit like a GPS for your trading . It shows you where the price likes to hang out, where it gets nervous, and where it flies through. No more calculating pivots by hand or guessing support and resistance levels. What it does: Automatically plots H1, H4, and D1 pivots . Shows support and resistance zones : R1, R2, S1, S2. Lines are colored and easy to read , so you can instantly see what’s hot or cold. Why you’ll love it:
FREE
Daily Bar Number CFD
Vincent Jose Proenca
indicator that numbers the bars (candles) in a custom trading session. The indicator allows: Defining the session start time (StartHour and StartMinute) Displaying numbers only on odd bars (if AfficherUniquementImpairs is true) Displaying numbers on the last N days (NbJours) Customizing the color and font size of the text The indicator will loop through the bars of the last N days and, for each day, start counting from the session start time. It will display the bar number (starting at 1) belo
FREE
Volume-to-Price Movement Oscillator (VP Oscillator) for MT5 The VP Oscillator highlights the balance (or imbalance) between trading volume and price movement, helping traders spot hidden accumulation, distribution, or weakening trends. How It Works: Calculates each bar’s price range (High–Low) and tick volume. Normalizes both values over a set period (default: 14). Plots the absolute difference between them ×100 — showing how closely price action aligns with trading activity. Interpretation: Hig
FREE
STRUCTURAL TREND LINES - MT4/MT5 Indicator Simple indicator that automatically draws trend lines based on market structure. Features: - 3 degrees of structure detection (short, medium, long term) - Configurable swing strength for each degree - Single color per degree for clean visualization - Adjustable number of lines per degree - Customizable colors and line widths How it works: The indicator identifies swing highs and lows based on the strength parameter, then connects these points to crea
FREE
This indicator allows you to number bars within a trading session for CFDs. It works on GER40, UK100, US30, US100, and US500 and is fully customizable to fit your trading style and chart preferences. Key Features & Parameters: Customizable session interval: define your own session start and end times Option to hide even numbers for a cleaner chart Adjust number distance to position the bar numbers as you prefer Font size and color: choose the size and color that suit your chart Number of days di
FREE
Adaptive Flow MAs
Vincent Jose Proenca
Adaptive Flow MAs is a moving average indicator designed to naturally adjust to market movements. Unlike traditional averages, it dynamically adapts its periods based on recent volatility and the current trend. The EMA closely follows rapid price swings to capture every impulse, while the SMA remains smoother, providing a stable and reliable reference. With a clean display showing the current adaptive periods, this tool helps traders feel the “flow” of the market without visual clutter. It’s cr
FREE
Better Moving Average
Vincent Jose Proenca
STRUCTURAL TREND LINES - MT4 Indicator Simple indicator that automatically draws trend lines based on market structure. Features: - 3 degrees of structure detection (short, medium, long term) - Configurable swing strength for each degree - Single color per degree for clean visualization - Adjustable number of lines per degree - Customizable colors and line widths How it works: The indicator identifies swing highs and lows based on the strength parameter, then connects these points to create t
FREE
The Candle Activity Visualizer turns your chart into a dynamic heatmap, giving you a clear view of buying and selling pressure. In-Depth Market Insight: Active Zone Detection: The algorithm highlights areas where high volume builds up within a narrow price range, revealing key pressure zones. Real-Time Intensity: Colors adjust in real time, shifting smoothly from cool tones to warmer shades as activity increases. Visual Customization: 5 Color Palettes: Choose from five professionally designed th
Rainbow Price Visualizer v1.21 See where the market really breathes. Turns your MT4 chart into an ultra-precise heatmap that highlights price zones favored by big players. Why it matters 300 price levels at 0.2‑pip resolution — microscopic detail. 8 visual themes (Rainbow, Fire, Ocean…) for instant readibility. Smart opacity: low noise fades, real zones pop. Lightweight rendering with automatic cleanup. Fully customizable: saturation, opacity, resolution, history depth. Bands project into the f
Indicatore a Bolle — Rallentamento del Prezzo + Picco di Volume Uno strumento visivo semplice che mostra quadrati colorati sul grafico quando il prezzo rallenta improvvisamente accompagnato da un picco di volume. (Funzione di riempimento con effetto bolle concentriche) Aiuta a individuare i momenti chiave in cui il mercato si prepara a muoversi. Cosa fa l’indicatore: Rileva i momenti in cui il mercato “esita” prima di muoversi Mostra dove entra grande volume senza variazioni significative di pre
Institutional Flow Indicator A smart volume-based tool that detects institutional activity zones through direct order flow patterns. It reveals where large institutions operate. An advanced volume indicator that filters out noise to identify probable institutional patterns. Key Features Smart cluster detection Automatic identification Signal classification: Violet / Yellow – Institutional Zone – Strong, sustained institutional activity Red / Green – Strong Signal – Significant buying/selling pre
AMD Adaptive MA MT4
Vincent Jose Proenca
5 (1)
Media Mobile Adattiva AMD (AAMA) AAMA è un indicatore di media mobile adattiva per MetaTrader 4 che regola automaticamente la sua reattività in base alle condizioni di mercato. Caratteristiche principali: Media mobile adattiva basata sul Rapporto di Efficienza di Kaufman – reagisce rapidamente durante i trend e filtra il rumore nelle fasi laterali Rilevamento automatico delle 4 fasi di mercato AMD: Accumulazione, Markup (rialzo), Distribuzione, Markdown (ribasso) Adattamento alla volatilità tra
STRUCTURAL TREND LINES - MT4 Indicator Simple indicator that automatically draws trend lines based on market structure. Features: - 3 degrees of structure detection (short, medium, long term) - Configurable swing strength for each degree - Single color per degree for clean visualization - Adjustable number of lines per degree - Customizable colors and line widths How it works: The indicator identifies swing highs and lows based on the strength parameter, then connects these points to create t
Volume Profil MT4
Vincent Jose Proenca
Volume Profile Rectangle – Descrizione del Prodotto Sommario Indicatore interattivo del profilo di volume che mostra un’analisi orizzontale del volume scambiato a ciascun livello di prezzo all’interno di un’area selezionata. Crea automaticamente un rettangolo mobile e visualizza barre colorate che rappresentano la distribuzione del volume rialzista e ribassista. Cosa fa: Mostra il volume orizzontale : Visualizza la distribuzione del volume a ciascun livello di prezzo tramite barre orizzontali An
Proxy OrderFlow MT4
Vincent Jose Proenca
5 (1)
Indicatore basato sul disequilibrio del tick-spread. TF: Funziona su tutti i timeframe (da M1 a D1). Coppie: Compatibile con Forex, indici, oro e CFD (regolazione automatica per JPY, Oro e CFD). Impostazioni: TickWindow (200) – finestra di osservazione dei tick SpreadWeight (1.5) – peso dello spread NormalizationPeriod (20) – periodo di normalizzazione (z-score) Overbought / Oversold (±3.0) – soglie di allerta AlertCooldown (300s) – tempo di raffreddamento tra gli avvisi Conclusione: Proxy Or
Nexus Signal System
Vincent Jose Proenca
DESCRIZIONE TECNICA Nexus Signal System è un indicatore MT4 che combina 12 criteri tecnici per generare segnali di trading. Il sistema analizza la congiunzione di più fattori (trend, momentum, volume, zone di supporto/resistenza) prima di confermare un segnale, riducendo il numero di falsi segnali rispetto agli indicatori che utilizzano un solo criterio. CRITERI DI ANALISI (Punteggio 0–15): Rilevamento pattern (pin bar, engulfing) Analisi Multi-Timeframe (conferma del trend su timeframe superior
NexusSignal Scalping
Vincent Jose Proenca
DESCRIZIONE TECNICA Nexus Signal System è un indicatore MT4 che combina 12 criteri tecnici per generare segnali di trading. Il sistema analizza la congiunzione di più fattori (trend, momentum, volume, zone di supporto/resistenza) prima di confermare un segnale, riducendo il numero di falsi segnali rispetto agli indicatori che utilizzano un solo criterio. CRITERI DI ANALISI (Punteggio 0–15): Rilevamento pattern (pin bar, engulfing) Analisi Multi-Timeframe (conferma del trend su timeframe superior
VR Signal
Vincent Jose Proenca
VolumeRejectionSignals v5.0 Indicatore avanzato di analisi del volume Descrizione generale VolumeRejectionSignals v5.0 è un indicatore tecnico avanzato progettato per identificare con precisione movimenti significativi dei prezzi attraverso un’analisi approfondita dei rifiuti di volume. Combinando la dinamica del flusso di ordini e la struttura del mercato, rileva le zone in cui la pressione di acquisto o vendita diminuisce, permettendo di anticipare inversioni o accelerazioni di tendenza. Sist
Liquidity Compression MT4
Vincent Jose Proenca
5 (1)
Indicatore Istituzionale di Compressione della Liquidità L’indicatore misura in tempo reale il restringimento della liquidità utilizzando la larghezza normalizzata delle Bande di Bollinger, il volume e lo spread medio, per individuare le fasi di compressione prima dei breakout di prezzo. Visualizzazione: Finestra separata in stile professionale, con istogramma “Compression Score” e linea di soglia (“Threshold”). Caratteristiche Principali Rilevamento precoce: Identifica le zone di contrazione p
Mean Reversion Probability – Indicatore di Reversione Statistica Descrizione breve Indicatore istituzionale che calcola la probabilità statistica di un ritorno alla media mobile 200, basato sull’analisi delle sovra-estensioni storiche. Identifica con precisione quantitativa le zone di affaticamento del mercato. Caratteristiche principali Analisi statistica avanzata – Costruisce un database di oltre 500 estensioni storiche per calcolare probabilità reali Punteggio di probabilità 0–99% – Quantif
WBP Chart Signals
Vincent Jose Proenca
Italiano – WBP Chart Signals – Indicatore di pressione di acquisto/vendita multi-timeframe Descrizione: WBP Chart Signals è un indicatore avanzato che misura la pressione del mercato attraverso l’analisi di volume, spread e price action. Ideale per i trader che desiderano segnali precisi con conferma multi-timeframe e analisi in stile istituzionale. Caratteristiche principali: Weighted Buy Pressure (WBP): Algoritmo proprietario che combina VWAP, MA200, forza del volume, liquidità e momentum Ana
Filtro:
Nessuna recensione
Rispondi alla recensione