SweepMaster
- 지표
-
Vincent Jose Proenca
 저는 10년 이상 트레이더로 일해 왔으며, 주로 CFD(차액결제거래)를 전문으로 하고 있습니다. 트레이딩에서 제가 가장 좋아하는 것은 논리, 규율, 그리고 의사결정을 단순화하는 도구를 만드는 과정입니다. 제 방식에 맞는 지표를 찾지 못해 처음에는 필요에 의해, 이후에는 즐거움으로 직접 코딩을 시작했습니다.
 - 버전: 2.0
- 활성화: 5
SweepMaster – LSSD & APCE
유동성 스윕, 스톱 헌트 감지기 및 적응형 패턴 신뢰도 엔진
3가지 거래 모드(스캘핑, 표준, 스윙), APCE 신뢰도 엔진, 거래량 흡수 분석, 적응형 지지/저항 구역을 통합한 유동성 스윕 감지 지표. 실시간 주문 흐름 분석용으로 설계됨.
권장 타임프레임: H1
SweepMaster는 가격, 거래량, 시장 구조의 종합 분석을 통해 실시간으로 유동성 스윕, 스톱 헌트, 축적/분배 단계를 식별하도록 설계된 기술적 분석 지표입니다.
주요 기능
거래 모드
Scalping Mode: 낮은 임계값으로 빠른 감지
Standard Mode: 균형 잡힌 사용자 정의 가능 매개변수
Swing Mode: 상위 타임프레임 신호용 엄격한 기준
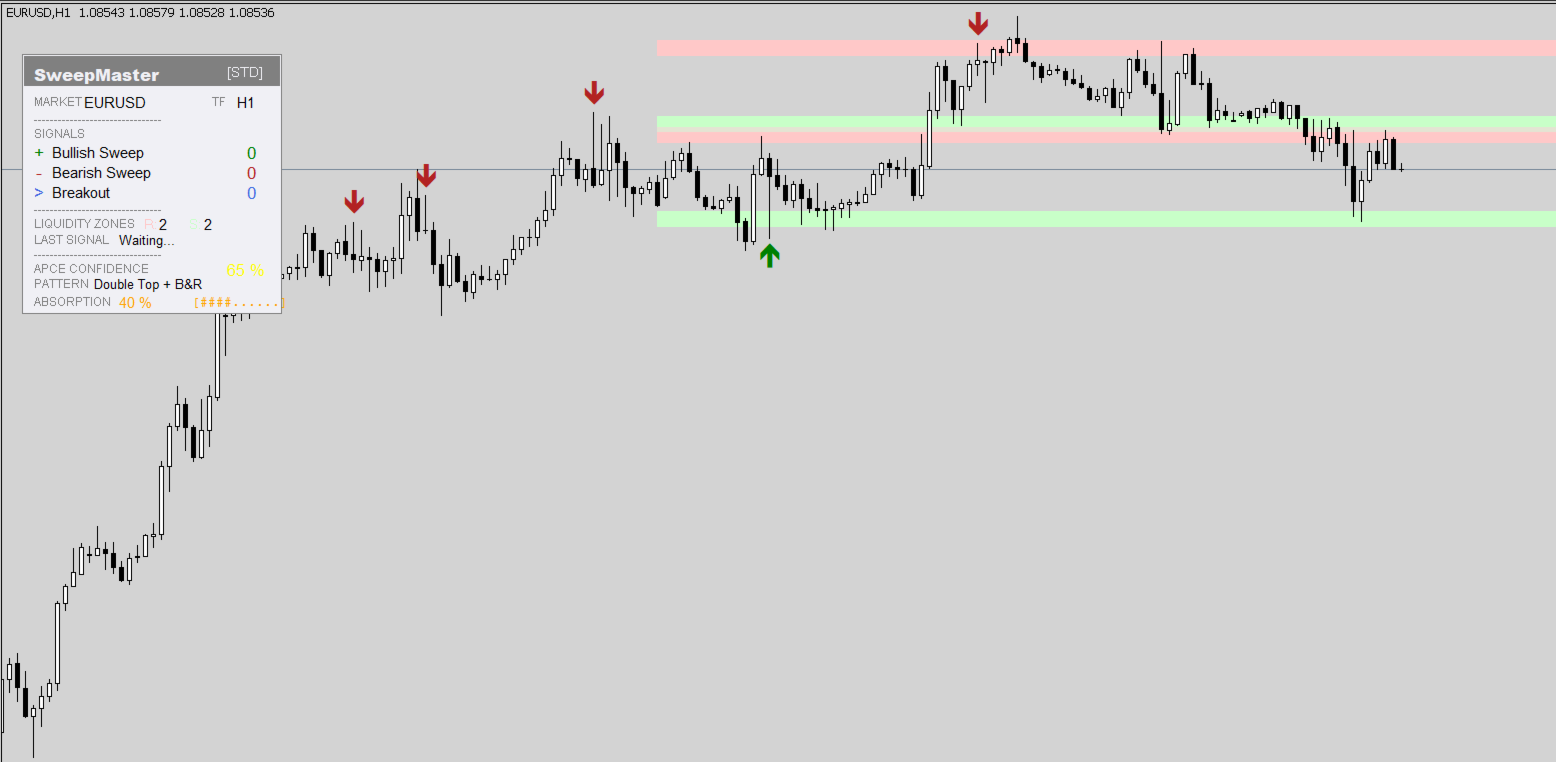
유동성 스윕 감지
상승 및 하락 유동성 스윕 식별
거래량 확인이 포함된 꼬리 분석
유효한 돌파와 반발 구분
타임프레임 기반 적응형 지지/저항 수준
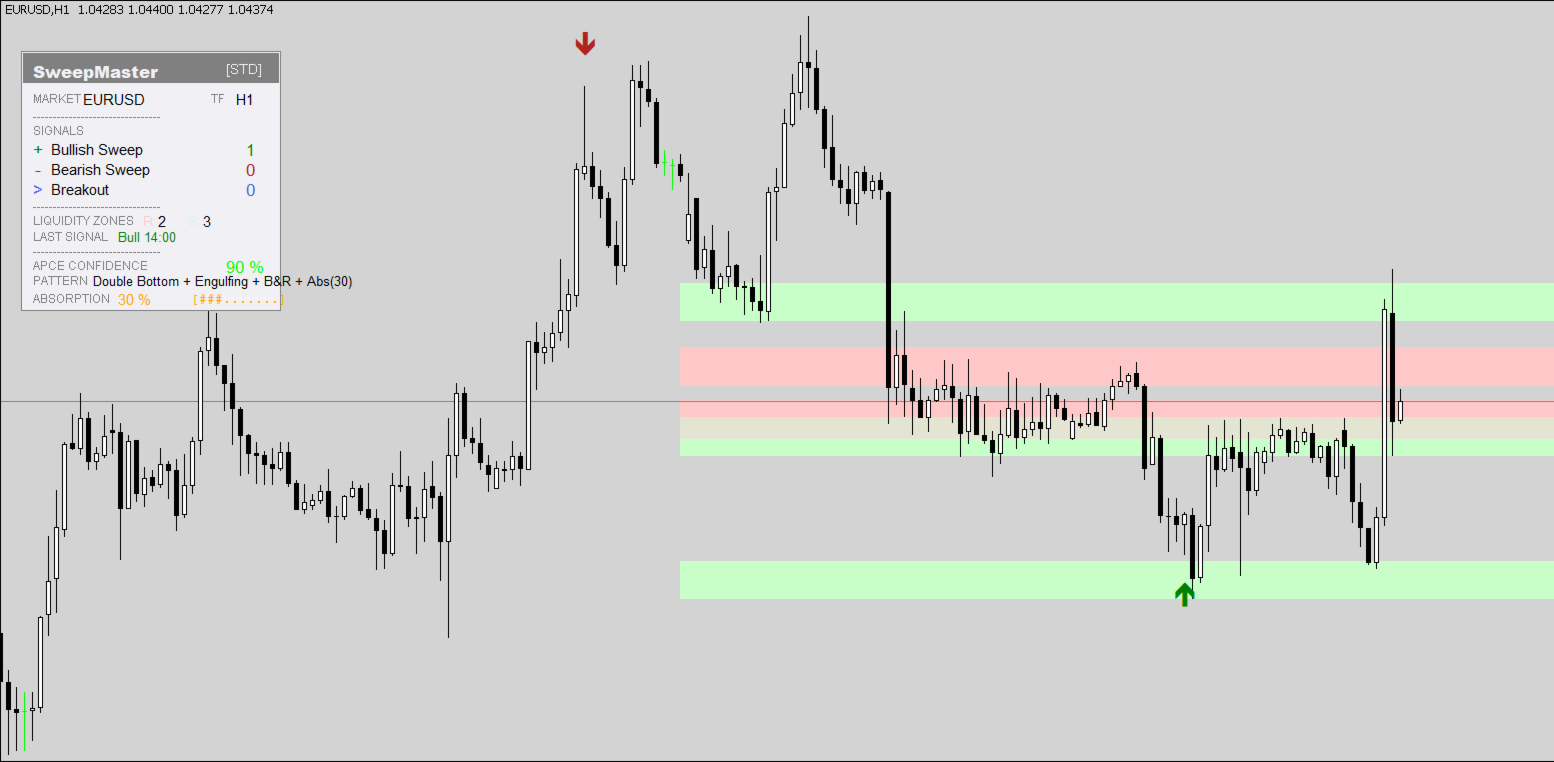
APCE 엔진 (Adaptive Pattern Confidence Engine)
신뢰도 점수 0–100%
이중 천정 및 이중 바닥 감지
Engulfing 패턴 인식
돌파 및 재테스트 구성 검증
현재 캔들 실시간 계산
거래량 흡수 분석
8가지 기준 기반 점수 시스템 (0–100%)
거래량 강도 및 범위 압축 분석
꼬리 반발 및 가격 균형 감지
거래량 클라이맥스 식별
실시간 시각 지표
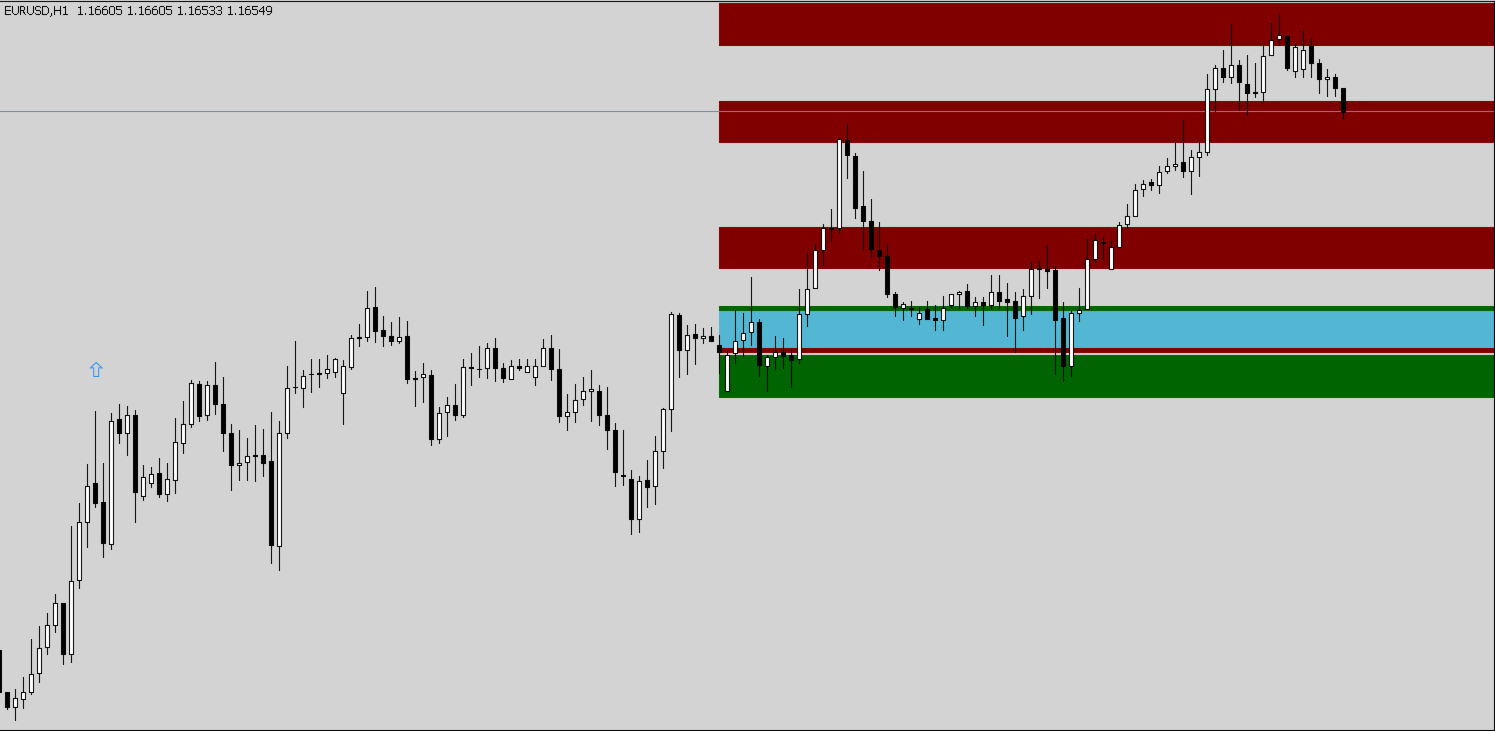
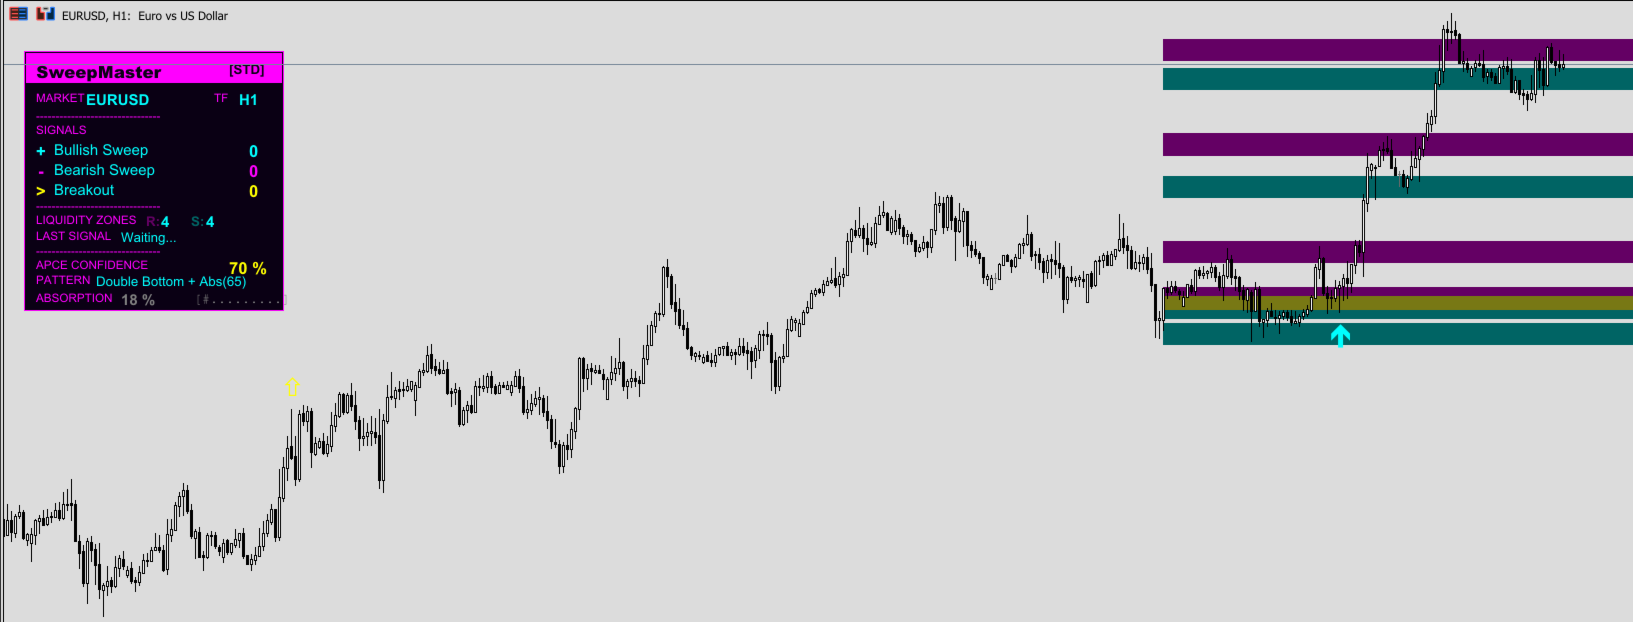
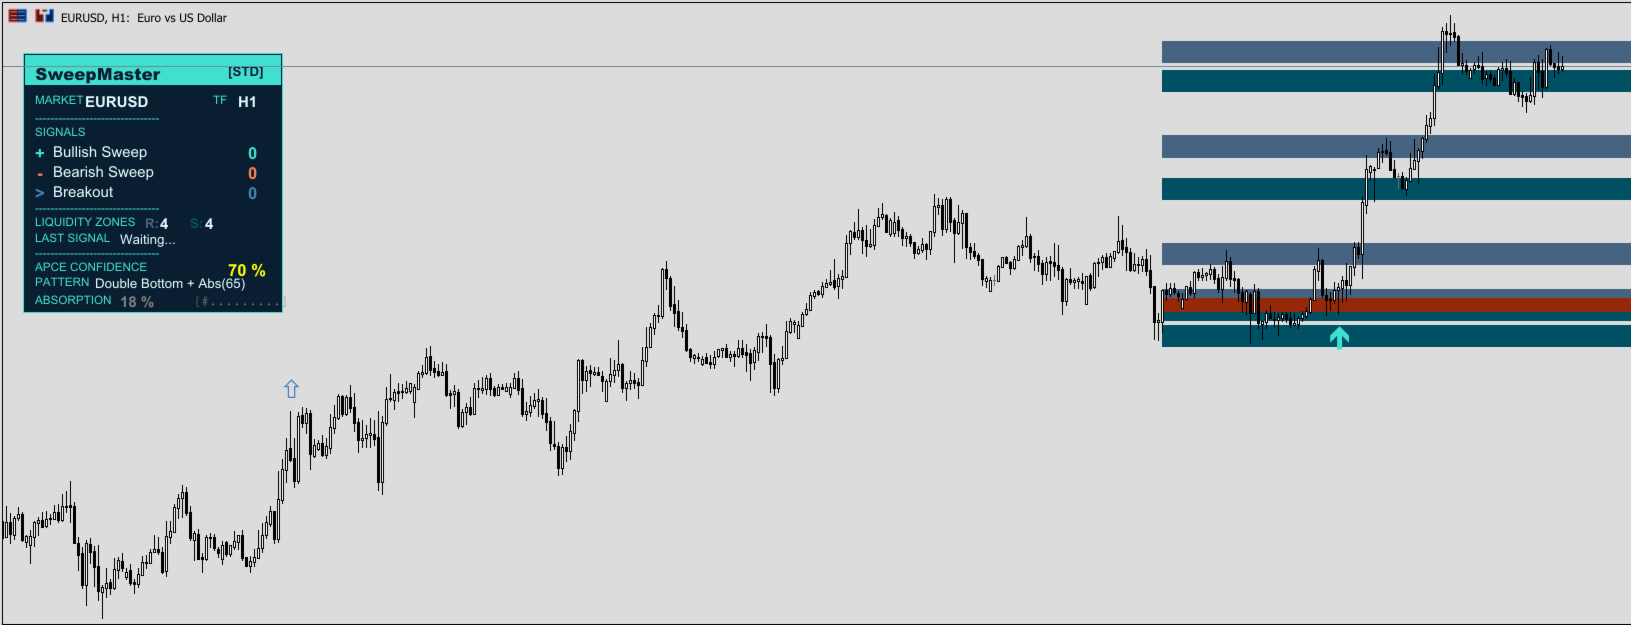
적응형 지지 및 저항 구역
변동성에 맞춘 ATR 기반 허용 오차
타임프레임에 맞춘 스윙 감지
수준 가중 평균
가격 상호작용 수로 검증
하위 타임프레임 강화 필터링
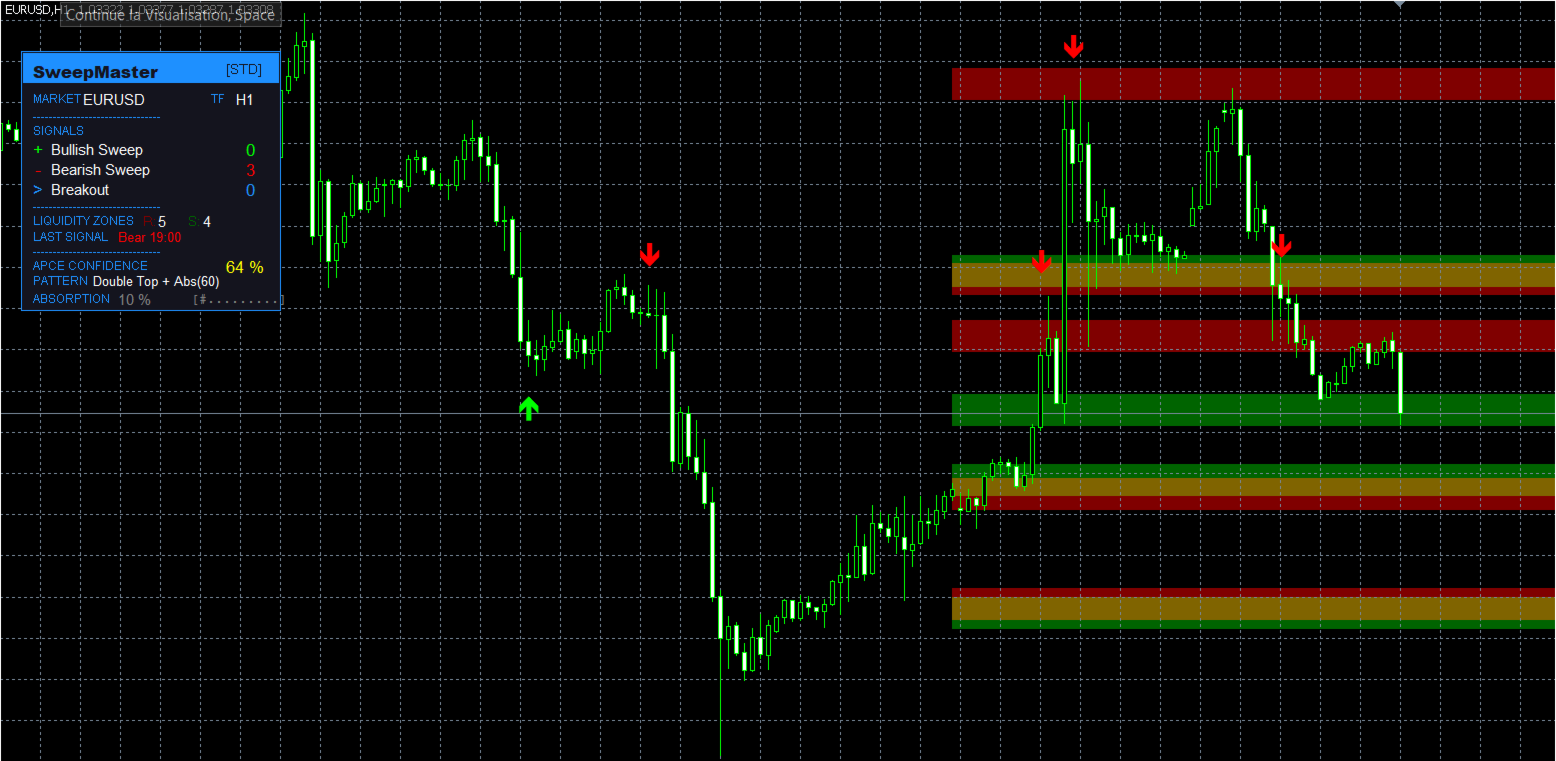
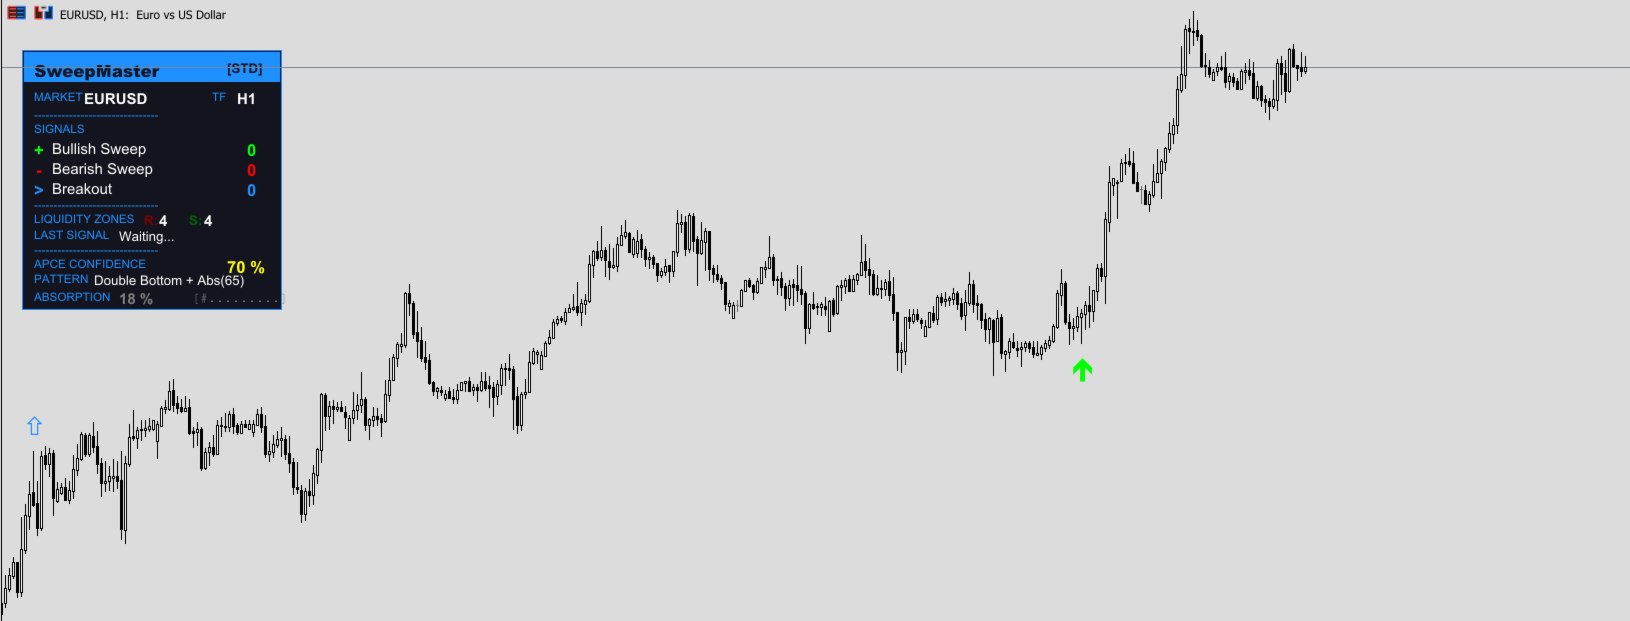
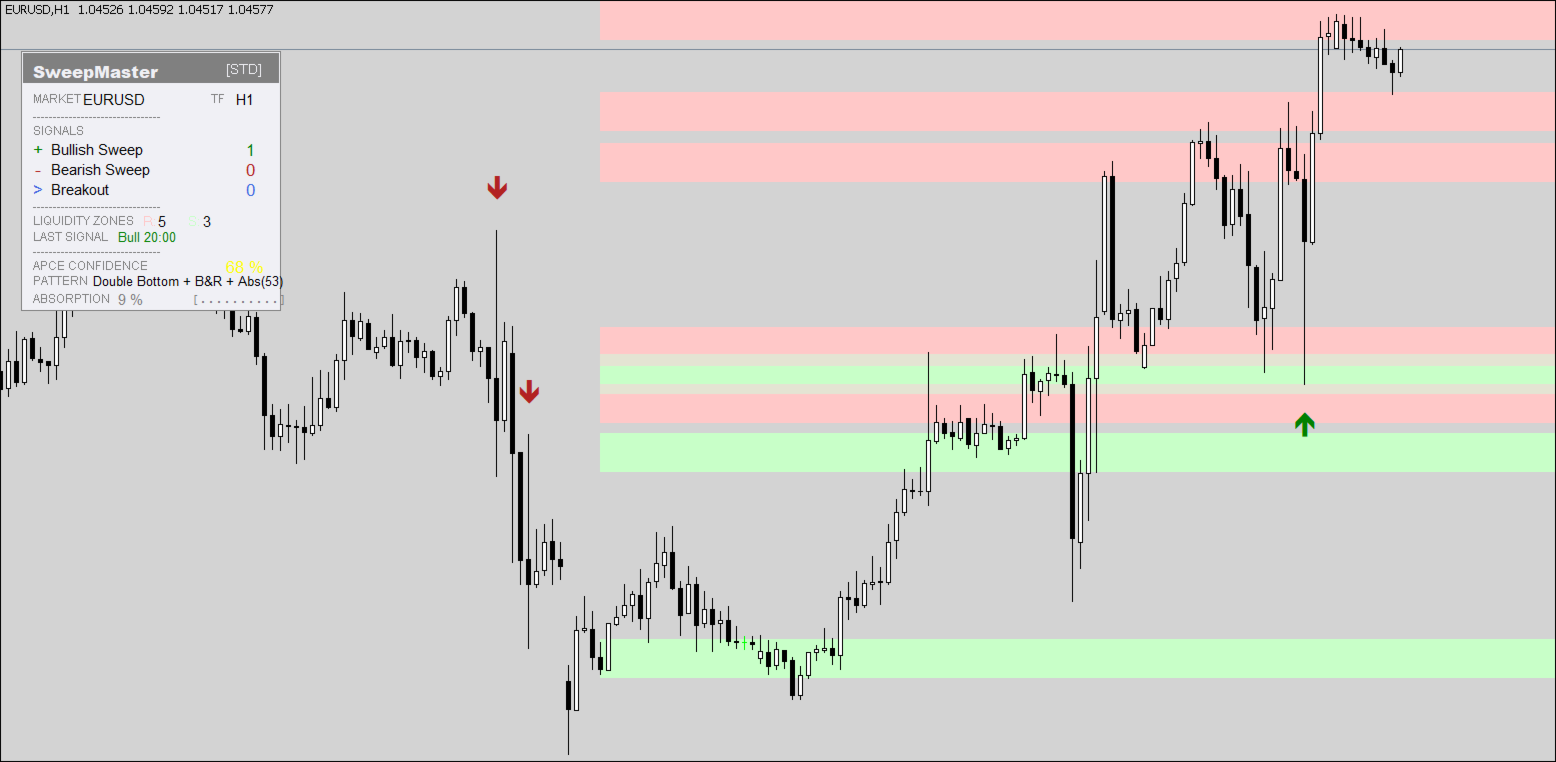
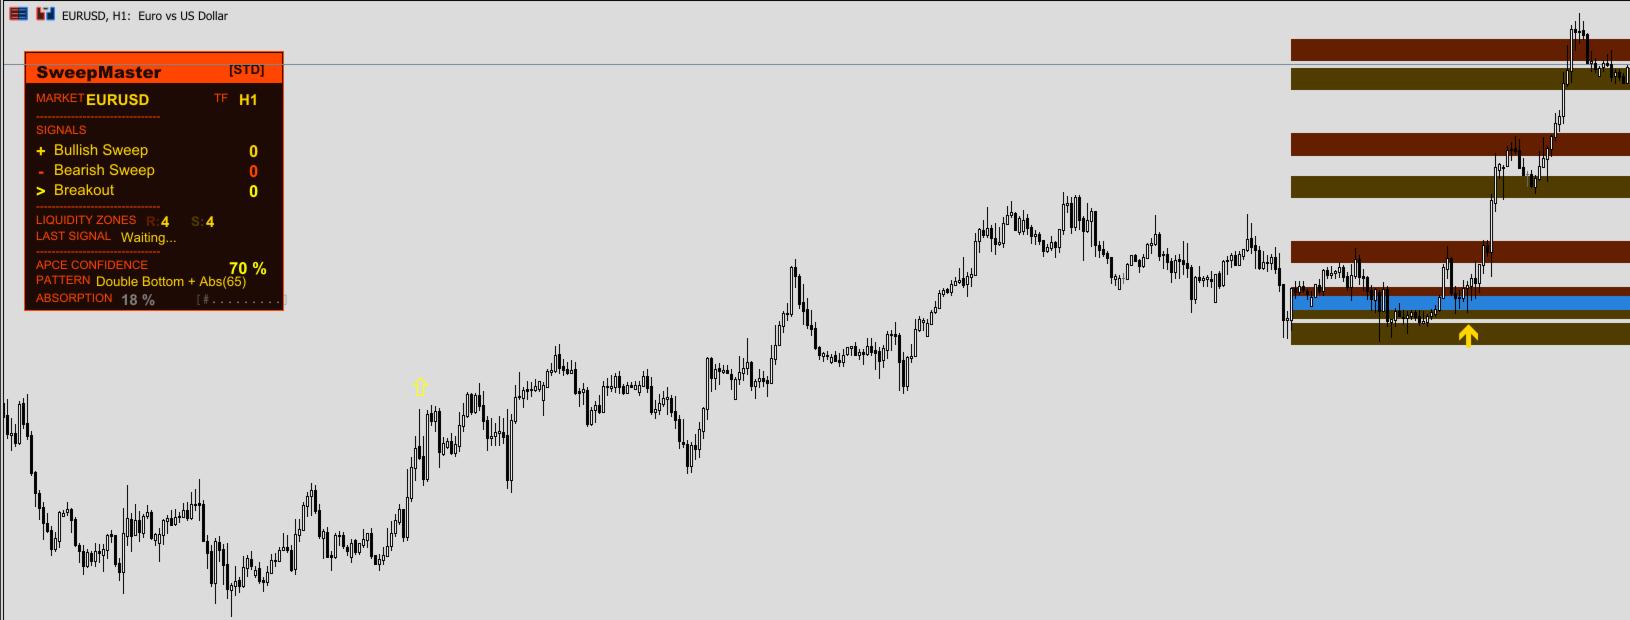
대시보드
실시간 신호 카운터
APCE 신뢰도 점수 표시
흡수 강도 지표
활성 거래 모드 표시
6가지 색상 테마
표시 모드
Standard: 화살표 및 구역
Discrete: 대시보드만
Complete: 모든 요소 표시
거래량 흡수 시스템
원리: 제한된 가격 움직임과 높은 거래량 결합
점수 분포 (0–100%):
거래량 강도
범위 압축
행동 일관성
꼬리 반발
가격 균형
거래량 클라이맥스
방향 정렬
작업 흐름
거래 모드 선택
지지/저항 수준 돌파 감지
거래량 분석으로 확인
패턴 인식 검증
흡수 평가
신뢰도 점수와 함께 신호 표시
두 가지 키보드 단축키: P와 Z