Guarda i video tutorial del Market su YouTube
Come acquistare un Robot di Trading o un indicatore
Esegui il tuo EA
hosting virtuale
hosting virtuale
Prova un indicatore/robot di trading prima di acquistarlo
Vuoi guadagnare nel Market?
Come presentare un prodotto per venderlo con successo
Expert Advisors e Indicatori per MetaTrader 5 - 171

AntiSwapCleaner is an Expert Advisor (EA) designed to protect a trading account against losses caused by negative swaps (overnight fees charged for holding an open position). It runs in the background and monitors open positions matching a given Magic Number (or manual trades if enabled).
It calculates the applicable swap for each position (long or short) and compares the current profit of the position with the estimated swap.
If the profit is lower than the swap (i.e. the position risks costin

Un grafico. Controllo totale. Smetti di perdere tempo a gestire oggetti, colori e impostazioni su ogni grafico separatamente. Con Chart Sync Manager , puoi sincronizza, copia e controlla tutti i tuoi grafici MetaTrader all'istante, utilizzando un solo pannello e poche scorciatoie. Disegna una volta, aggiorna ovunque. Apri e chiudi i grafici con un solo clic. Mantieni pulito il tuo spazio di lavoro con gestione degli oggetti basata sui simboli . E non perdere mai detta

Bank Your Profits & Secure Your Trade in One Click The Ultimate "Scale Out" Tool for Professional Traders. Close Partial (MT5 Utility) is designed for traders who want to lock in profits without killing the trend. With a single click, you can bank a percentage of your profit instantly. New Feature (Auto-Secure): Stop wasting time dragging your Stop Loss after taking profit. This manager can now automatically move your Stop Loss to Break-Even the moment you click the "Close Partial" button. B

Questa strategia EA ha mostrato ottimi rendimenti nei test su BTC dal giugno 2016 al giugno 2017. Questa strategia EA non è una strategia singola, ma è stata sviluppata in modo indipendente attraverso una lunga fase di调试 personale e affinamento. Il capitale iniziale per questa strategia EA può variare da 3.000 a 10.000 dollari USA. Dispone di un eccellente controllo dei rischi e può generare buoni profitti dal mercato quando le condizioni di mercato sono favorevoli.

In a market flooded with lagging indicators and overfit strategies, this utility offers a fresh edge: real-time statistical arbitrage powered by an adaptive neural network , built entirely in MQL5—no DLLs, no external dependencies. Key Advantages Smart Spread Modeling
It dynamically calculates a hedge ratio between two correlated instruments (like EURUSD vs GBPUSD), forming a synthetic spread that reflects true relative value. This isn’t just correlation—it’s cointegration-aware logic. Neur
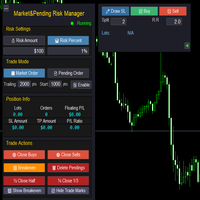
Market & Pending Risk Manager EA Operation Manual Market & Pending Risk Manager is a professional MT5 trading panel EA that integrates multiple functions such as market order trading, pending order trading, risk management, and trailing stop loss, providing traders with a comprehensive trading solution. Core Advantages Intelligent Dual-Mode Trading Market Order Mode: One-click buy/sell for fast execution Pending Order Mode: Precise entry to wait for the optimal timing Seamless Switching:

MomentumDeploy Scalping Advisor
Precision Entry. Momentum-Driven Execution. MomentumDeploy is a high-performance scalping advisor designed to identify and exploit short-term price bursts with surgical precision. Built for fast-moving markets, it doesn’t just react to volatility — it anticipates it. At its core is a proprietary momentum detection engine that scans live price action for optimal deployment zones. Whether you're trading manually or automating execution, MomentumDeploy acts as your

SMC_LiquidityGrab_EA - Smart Money Concept (SMC) Ai Automated Trading Expert Advisor (EA) Sale 75% First 10 Order!!!!!!! You Can Tracking All EA Status and Update in This Link https://www.notion.so/Kaws-Ea-Tracking-25e8e514bbfe8003b336ce3c2f27fe85 In Screenshot Tester is XAUUSD TF M5 Default Config Overview:
The SMC_LiquidityGrab_EA is an Expert Advisor (EA) developed for the MetaTrader 5 (MT5) platform, aiming to detect and capitalize on trading opportunities based on Smart Money Concept (SMC

BigBoss Ultra Z Scalper EA è un EA di scalping accurato per EURUSD sul timeframe M5 (5 minuti).
BigBoss Scalper Ultra Z è un Expert Advisor (EA) specificamente progettato per strategie di scalping di precisione sulla coppia EURUSD, operante sulla piattaforma MetaTrader 5 sul timeframe M5 (5 minuti). Questo EA è progettato per i trader che cercano un'esecuzione rapida e una gestione del rischio controllata, poiché utilizza un Take Profit a 12 pip e uno Stop Loss a 11 pip.
Risultati del backtes

Fibonacci Grid EA representa la evolución definitiva en sistemas de trading semi automatizado. Combina la precisión matemática de los niveles Fibonacci con una gestión de riesgo inteligente que hace que las operaciones sean casi infalibles. CARACTERÍSTICAS PRINCIPALES ESTRATEGIA BASADA EN FIBONACCI PROBADA Utiliza los niveles dorados de Fibonacci (0.236, 0.382, 0.618, 0.786) Reconoce automáticamente los puntos swing highs y lows Coloca órdenes pendientes en múltiples nivele

Volatility 75 Trend - Specialized Technical Indicator Overview The Volatility 75 Trend is an advanced technical indicator designed specifically for trading synthetic indices, particularly the Volatility 75 (V75). This indicator combines multiple technical analysis tools to provide accurate trend signals and timely alerts in highly volatile markets.
Key Features 1. Adaptive Trend Algorithm Uses the Average True Range (ATR) as a basis for calculating dynamic support and resistance levels Impleme

SmartSMC EA – Liquidity Sweeps For over 10 years in the Gold market I’ve watched how price hunts liquidity before the real move. SmartSMC EA is my distilled version of that edge: a simple, disciplined SMC liquidity-sweep engine that trades XAUUSD with clean risk and professional execution.
Why choose SmartSMC?
Because it blends Smart Money Concepts with rock-solid automation. You don’t need to second-guess the chart—attach the EA, choose your risk, and let it handle entries, exits, sizing and
Super Trend Scalper v1.0 Overview The Super Trend Scalper is an advanced technical indicator designed specifically for scalping in the synthetic index Deriv market. It combines the power of three renowned technical indicators—SuperTrend, RSI, and MACD—to provide accurate and timely trading signals, ideal for traders looking to take advantage of short-term price movements with a high probability of success.
Technical Methodology Main Components 1. Adaptive SuperTrend
Uses the Average True Rang

Velocità di scalping; disciplina sistematica Decidi con Nirvana; calcoli e freno di sicurezza con noi. Non stupirti; hai di fronte lo strumento di gestione del capitale più avanzato e intelligente, che offre la massima flessibilità nei mercati finanziari. Un trade vincente non è solo “buona analisi”; “esecuzione fluida” e “disciplina” sono la chiave. Nirvana è il tuo assistente: calcola rischio/volume in tempo reale, imposta R:R con un clic, mostra anteprime live di rischio e profitto, e il “blo

Tokyo Session Range Breakout EA – Smart Trading for Prop Firms & Retail Traders Looking for a disciplined breakout system that trades with precision, manages risk intelligently, and avoids overnight exposure?
The Tokyo Session Range Breakout EA is built exactly for that. How It Works
The EA automatically detects the Asian session range (00:00 – 08:59) UTC by mapping the highest and lowest price levels.
A box is drawn to clearly mark this range on your chart.
During the London session and early

Visual Cobra Momentum Wave: Ride the Trend with Unmatched Clarity Unlock the true direction of the market and trade with newfound confidence. The Visual Cobra Momentum Wave is a professional-grade trend analysis tool designed to eliminate the noise and confusion of volatile markets. Instead of relying on lagging or conflicting signals, this indicator provides a single, clear visual guide, allowing you to identify and ride strong trends from their inception to their conclusion. For just $30, you

Visual Panther: Your Ultimate Trend Trading Companion Unlock the full potential of your trading with the Visual Panther, a meticulously engineered trend-following indicator for MetaTrader 5. Designed for traders who demand clarity, precision, and control, this tool eliminates guesswork by providing clear, non-repainting signals to help you capture and ride market trends effectively. For just $30, gain a professional-grade tool that could redefine your trading strategy. The Logic Behind the Pant

Visual Falcon Indicator for MetaTrader 5 Trade with Clarity and Confidence. Capture Trend Reversals with Precision. Are you tired of noisy indicators that generate countless false signals? The Visual Falcon Indicator is a professional-grade trend analysis tool designed to cut through the market noise and identify high-probability trend reversals with exceptional accuracy. For just $30, you can equip your chart with a powerful, non-repainting indicator that helps you see the market's true direct

Visual Falcon Wave Indicator: Trade with Clarity and Confidence Are you tired of navigating the chaotic market with lagging indicators and confusing signals? Do you struggle to identify the true trend direction amidst unpredictable price swings? The Visual Falcon Wave Indicator was engineered from the ground up to solve this exact problem, providing a crystal clear, intuitive, and powerful tool for trend traders. For a one-time price of just $30, you can equip yourself with an indicator designe

A comprehensive multi-feature indicator combining trend analysis, smart money concepts, and automated risk management. Features adaptive trend detection with volatility-based smoothing, dynamic support/resistance levels, institutional volume analysis, and real-time signal generation with instant alerts. Key Features: Multi-condition signal system with 4-factor confirmation (Trend, S/R, RSI, MACD) Smart Money level detection based on volume analysis Automatic TP/SL calculation using ATR multipli

Visual Cheetah Wave Indicator: Trade with Speed and Precision Unlock market trends and trade with renewed confidence for just $30. Are you tired of cluttered charts and conflicting signals that leave you guessing? The Visual Cheetah Wave Indicator was developed to cut through the market noise, providing a clean, intuitive, and powerful way to identify and follow trends. Designed for traders who demand clarity, this tool helps you spot high-probability entry and exit points with exceptional accu

Visual Wave Dolphin Indicator: Ride the True Waves of the Market Tired of chaotic charts and confusing signals? The Visual Wave Dolphin Indicator is your solution to cutting through market noise and identifying high-probability trading opportunities with stunning clarity. Designed for traders of all levels, this powerful tool transforms complex price action into a simple, elegant wave, allowing you to visualize market trends and catch turning points before they happen. For just $30, you can equ

Visual Cheetah Run Indicator: Capture Market Momentum with Speed and Precision Are you tired of cluttered charts and ambiguous trading signals? Do you struggle to identify strong trends before they take off, often entering the market too late? The Visual Cheetah Run Indicator is the definitive solution designed to provide crystal-clear, high-probability entry signals by identifying powerful market momentum with unparalleled accuracy. For a one-time price of just $30, you can equip your MetaTrad

Visual Pangolin Trend Indicator Unlock the True Market Trend with Clarity and Confidence Are you tired of whipsaws and false signals that erode your trading account? The key to successful trading is not just finding a trend, but knowing when the trend is real and when it's just market noise. The Visual Pangolin Trend Indicator is a professionally designed tool that gives you a decisive edge, filtering out volatility to reveal the underlying market direction with unparalleled clarity. For a one-

Versione MT4: https://www.mql5.com/en/market/product/138049 Versione MT5: https://www.mql5.com/en/market/product/138050
"LEGION" – Expert Advisor Avanzato per il Trading BBMA
"LEGION" è un Expert Advisor professionale basato sulla strategia BBMA (Bande di Bollinger + Medie Mobili), arricchita con filtri multi-timeframe e money management adattivo. È progettato per i trader che desiderano entrate precise, livelli controllati e la massima protezione dal rischio.
Caratteristiche principali
Str
Neural Breakout v5.1 - AI-Powered Multi-Symbol Portfolio Manager Transform your MT5 terminal into an intelligent trading command center. Manage multiple forex pairs with advanced neural network technology and institutional-grade risk management from a single chart. Live Signal: <<Click Here>>
Please contact me for setfile once purchased WHAT IS NEURAL BREAKOUT? Neural Breakout is a sophisticated multi-symbol trading system that combines self-learning neural networks with proven breakout stra

Visual Polar Bear RSI - The Ultimate Momentum Indicator Stop guessing and start seeing the market's true momentum. The Visual Polar Bear RSI is not just another technical indicator; it is a complete trading tool designed to give you a distinct advantage. Engineered with a unique, proprietary calculation engine, this indicator provides smoother, clearer, and more actionable signals than the standard Relative Strength Index. At its core, the Visual Polar Bear RSI replaces the classic RSI formula

Visual Arctic Fox Trends: Trade with Adaptive Intelligence Unlock the power of a truly intelligent trend-following indicator. For just $30, the Visual Arctic Fox Trends indicator provides crystal-clear, adaptive signals designed to thrive in any market condition. Are you tired of moving averages that lag in fast-moving trends or generate false signals in choppy markets? The Visual Arctic Fox is engineered to solve this problem. It's not just another moving average; it's a sophisticated trading

Unlock Your Trading Potential with the Visual Lion Strength Indicator Are you tired of navigating choppy markets and struggling with indicators that give false signals? The Visual Lion Strength Indicator is a professionally engineered tool designed to bring clarity and confidence to your trading. Built on a unique and robust algorithm, this indicator helps you identify the true direction of the trend and provides clear, non-repainting signals for high-probability entry points. For just $30, you

Visual Tiger Momentum Indicator: See the Market's Next Move Tired of lagging indicators that leave you second-guessing your trades? The Visual Tiger Momentum Indicator is a professional-grade, on-chart analysis tool designed to give you a clear and predictive edge in any market and on any timeframe. By replacing outdated moving averages with advanced statistical analysis, this indicator provides a dynamic, forward-looking view of trend, momentum, and volatility. For a one-time price of just $30

Visual Crocodile Pulse Indicator Unlock the Market's True Momentum and Trade with Confidence Are you tired of lagging indicators and noisy charts that lead to false signals? The Visual Crocodile Pulse Indicator is a sophisticated, professional-grade trend analysis tool designed to give you a clear and decisive edge. By cutting through market noise, it identifies the powerful beginnings of new trends, helping you enter trades with higher precision and avoid choppy, unpredictable conditions. For

Visual Eagle Trend Indicator: Trade with Clarity and Confidence Are you tired of noisy charts, false signals, and missed opportunities? The Visual Eagle Trend Indicator is a professional-grade trading tool designed to cut through the market noise and provide you with clear, high-probability trend signals. By leveraging a powerful triple-confirmation strategy, this indicator helps you identify and trade with the dominant market trend, enhancing your trading precision and confidence. For just $30
Visual Panda Tracker: Trade with Adaptive Clarity Are you tired of lagging indicators that give signals too late, or noisy charts that lead to confusion and bad trades? The Visual Panda Tracker is a sophisticated, next-generation trend analysis tool designed to give you a clear and decisive edge in any market condition. Built on a powerful adaptive engine, this indicator intelligently adjusts to market volatility, providing smoother, more reliable signals that help you stay ahead of the trend.

TigrisWave IQ Binary Rocket - The Ultimate Signal Generator! From the creators of the revolutionary Scalp Rocket AI comes a game-changer for Binary Options trading. This expert advisor is meticulously engineered to generate high-probability buy/sell signals, perfectly synchronized with the market trend. While originally designed for Forex, its pinpoint accuracy makes it the ultimate tool for binary options traders seeking explosive daily profits.
How It Works: Precision Meets Power The EA

Visual Wolf Trend Line: Your Ultimate Trend Following Co-Pilot Unlock the power of clear, confident trend trading with the Visual Wolf Trend Line indicator. In a market full of noise and conflicting signals, this tool is designed to be your definitive guide, providing an intuitive, at-a-glance understanding of market dynamics combined with precise entry and exit signals. For just $30, you can stop guessing and start trading with a quantifiable edge. What is the Visual Wolf Trend Line? The Visua

Visual Fox Channel: Precision Signals for Reversal and Pullback Trading Unlock a new level of trading precision with the Visual Fox Channel, a sophisticated indicator engineered to identify high-probability turning points in the market. If you are tired of noisy charts and false signals, this tool provides a multi-layered filtering system to deliver clear, actionable buy and sell opportunities. For just $30, you can equip your charts with an institutional-grade analysis tool. The Logic Behind t

Visual Wolf Bands: Your Ultimate Reversal Signal Indicator Unlock Market Reversals with Unmatched Clarity Are you tired of navigating the market's unpredictable swings with lagging, complicated indicators? Do you struggle to find reliable entry and exit points amidst the noise? The Visual Wolf Bands indicator was developed to solve this exact problem, providing you with a clean, powerful, and intuitive tool to pinpoint high-probability market reversals. For just 30 dollars, this is an essential
Visual Eagle ATR Ratio Indicator Unlock the Market's Hidden Volatility Cycles for Just $30 Are you tired of entering trades that go nowhere? Do you struggle to identify when the market is about to make a powerful move? The Visual Eagle ATR Ratio indicator is the professional tool you need to stop guessing and start making data driven decisions based on the market's most critical element: volatility. This indicator provides a unique and powerful view of market dynamics by precisely measuring the

Zelix Gold Scalper EA
Smart Scalping Robot – Built for XAUUSD (Gold only) Fully Automated – Easy to Use
Optimized Exclusively for Gold (XAUUSD)
Scalping on M1–M5 with precision filters
ATR-based Stop Loss & Take Profit
Clean Strategy – No Grid, No Martingale
Best performance during London & New York sessions Recommended Settings: Pair: XAUUSD (Gold) Timeframe: M5 Minimum Deposit: $500+ Leverage: 1:200 or higher ️ Important Disclaimer:
Trading involves significant risk.
This

SinalTradeEA Telegram To MT5 SinalTradeEA è un Expert Advisor completamente automatizzato progettato per integrare segnali di trading direttamente in MetaTrader 5.
Offre esecuzione precisa e controllo totale su entrate, uscite e gestione del rischio. Caratteristiche principali Integrazione diretta con segnali Telegram o fonti esterne. Esecuzione completamente automatica. Gestione intelligente di Take Profit e Stop Loss. Strategie avanzate di gestione del rischio e dimensionamento del lotto. Supp
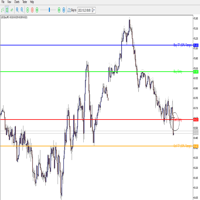
This custom MT5 indicator automatically draws trading levels based on the previous H4 candlestick. It is designed to help traders quickly identify potential entry and take profit (TP) points according to a simple breakout strategy. What it does:- Draws Buy Entry line at the previous H4 High.- Draws Sell Entry line at the previous H4 Low.- Calculates the 50% range of the previous H4 candle and plots: • Buy TP line above the High. • Sell TP line below the Low.- Adds text labels directly on the cha

Reversal Gold EA Reversal Gold EA è un sistema di trading automatico sviluppato appositamente per la coppia XAUUSD (Oro) . Opera secondo una strategia contro-tendenza, con l'obiettivo di identificare e sfruttare le potenziali inversioni di mercato. L'EA è stato costruito per gestire la volatilità e le caratteristiche di price action uniche dell'Oro. Strategia Il nucleo del Reversal Gold EA è un sistema di conferma multi-indicatore. L'algoritmo analizza le condizioni di mercato utilizzando una
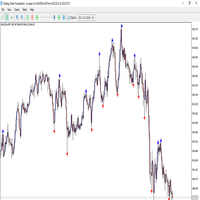
Overview The Reverse No Repair indicator is a trend-reversal detection tool that identifies potential turning points in the market with high accuracy. It is designed to provide non-repainting BUY/SELL signals based on candle body strength, volatility filtering, and future confirmation logic. The indicator marks reversal points on the chart using arrows: Red arrow (Down Signal) – Possible bearish reversal (sell opportunity). - Blue arrow (Up Signal) – Possible bullish reversal (buy opportunity).
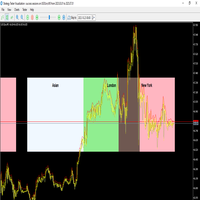
The Sessions Indicator visually highlights the major trading sessions (Asian, London, and New York) directly on the chart by drawing shaded rectangles. It helps traders quickly identify market activity zones, overlaps, and session-specific behaviors. Key Features:- Session Highlighting: Asian, London, and New York sessions are displayed using shaded rectangles with customizable colors.- Custom Session Times: Start and end times for each session can be adjusted to match broker server time.- Sessi
KeltnerStoch Consensus EA (con Martingale di Copertura e Modalità Indicatore) Che cos’è:
Un Expert Advisor che combina Keltner Channels (EMA20+ATR) + Stochastic (14,3,3) con un filtro di consenso di trend (EMA200 + ADX + MACD) . Può trattare automaticamente oppure funzionare come indicatore visivo , disegnando sul grafico frecce e testo BUY/SELL . Dove usarlo:
Funziona su qualsiasi simbolo e timeframe . I migliori risultati pratici li ho ottenuti su EURUSD H4 con TP = 40 pips e SL = 80 pips .

The most comprehensive Volume Profile Trading System in MQL
Finally, Trade Where The Smart Money Trades Stop guessing. Start seeing EXACTLY where banks and institutions are positioning their trades - and ride the wave with them. What Makes Millionaire Traders Different? They don't look at the same charts you do. They see where the money actually flows. FlowZone Pro reveals the hidden order flow that moves markets - the same data that costs hedge funds $3,000+/month on Bloomberg terminals

TrendCockpit EA – Smart Autonomous Trading TrendCockpit EA is an advanced yet user-friendly Expert Advisor designed to automate trend-following strategies with precise risk management. It’s perfect for traders of all levels who want to trade efficiently without constant monitoring. TrendCockpit is a tactical-grade Expert Advisor built for traders who treat execution as a discipline. With cockpit-style controls, dynamic risk logic, and multi-symbol heatmap intelligence, it transforms your chart i

Gold Relic EA is an automated trading robot that uses complex algorithm mainly based on MACD, Momentum, Envelopes, Bulls Power, Bears Power, Standard Deviation, ADX, RSI, Support Resistance, Candlestick Formations and other default MetaTrader indicators. This expert advisor works on all timeframes and all pairs, but it is recommended to use on GOLD H1 timeframe.
Setting Parameters: Expert Name - Expert Advisor name and trades comment. Magic Number - EA identification number. Trade

Visual Waves Indicator: Ride the Trend with Clarity Unlock a smarter way to trade with the Visual Waves Indicator, a sophisticated tool designed to provide clearer, more reliable trend signals on the MetaTrader 4 platform. Are you tired of the false signals and market noise generated by traditional moving averages? The Visual Waves Indicator is your solution. It moves beyond basic calculations to offer a truly adaptive analysis of market momentum, helping you identify trading opportunities with

Visual Dolphin Indicator Unlock the rhythm of the market with the Visual Dolphin Indicator, your ultimate tool for identifying and capitalizing on market trends with clarity and confidence. Designed for both novice and experienced traders, this indicator eliminates the noise and guesswork, providing crystal-clear buy and sell signals directly on your chart. The Logic Behind the Waves The core of the Visual Dolphin Indicator is a sophisticated yet intuitive dual-wave system based on moving avera

Visual Eagle Momentum Indicator Unlock Market Momentum and Pinpoint High-Probability Trades with Unmatched Clarity Are you tired of cluttered charts and lagging indicators that leave you guessing? The Visual Eagle Momentum Indicator is a professionally developed trading tool designed to cut through the noise, providing clear, non-repainting buy and sell signals based on a unique and powerful momentum analysis engine. For just $30, you can equip yourself with an indicator that helps you spot tur

Unleash the Power of Momentum with the Visual Wolf Indicator Are you tired of momentum indicators that give false signals and leave you caught in market chop? The Visual Wolf Momentum Indicator is a professionally engineered tool designed to cut through the noise, identify dominant market trends, and provide clear, high-probability trading signals directly on your chart. For just $30, you can equip yourself with an indicator that doesn't just follow the price—it understands the force behind it.

Visual Lynx Wave: Your Ultimate Trend Navigator Are you tired of second-guessing the market trend? Do you struggle with noisy indicators that provide late or confusing signals? The Visual Lynx Wave indicator is the definitive solution designed to transform your trading, offering crystal-clear visuals and powerful, high-quality signals for just $30. The Logic Behind the Lynx Wave The Visual Lynx Wave is built upon a sophisticated and proprietary algorithm that dynamically tracks market momentum.

Unlock Market Momentum with the Visual Eagle Momentum Cycle Indicator Are you tired of noisy charts and lagging indicators that give signals too late? Do you struggle to find clear entry and exit points in today's volatile markets? The Visual Eagle Momentum Cycle is the definitive tool designed to give you a precise, analytical edge, helping you identify high-probability trading setups with confidence. For a one-time price of $30, you can equip your trading arsenal with this powerful, professio

Visual Falcon Range Indicator: Master Market Breakouts Unlock the power of dynamic range analysis and trade breakouts with confidence. Are you tired of entering trades too early in choppy markets or missing out on powerful, explosive moves? The Visual Falcon Range Indicator is a professional-grade tool meticulously designed to identify key price ranges and pinpoint the exact moment a breakout occurs, giving you a distinct advantage in any market condition. Priced at just $30, this is not just a

Squeeze Momentum Force is a technical indicator for MetaTrader 5 that combines volatility squeeze detection with momentum analysis. Based on concepts from John Carter's TTM Squeeze indicator, this tool identifies periods of low volatility (squeeze) that often precede significant price movements.
Volatility Squeeze Detection The indicator detects squeeze conditions by comparing Bollinger Bands with Keltner Channels. When Bollinger Bands contract inside Keltner Channels, the market is in a squee

Unleash the Power of Market Momentum with the Visual Wolf Sphere Indicator Are you ready to gain a profound understanding of the market's inner workings? The Visual Wolf Sphere Indicator is not just another tool; it is a comprehensive trading solution designed to give you a crystal-clear view of volume dynamics and market sentiment. For just $30, you can equip yourself with an indicator that deciphers the complex language of the market, helping you to make more informed and confident trading de

Unlock the Market's True Direction with the Visual Polar Bear Indicator Are you tired of relying on single-instrument indicators that only show a fraction of the market's story? Do you want a powerful, visual tool that cuts through the noise and gives you a clear, comprehensive view of currency strength and weakness? Introducing the Visual Polar Bear Indicator , a sophisticated multi-asset cluster indicator designed to give you a decisive edge in the forex market. For just $30, you can transfor

Visual Tiger Speed Indicator: Unleash the Power of Market Velocity For just a one-time payment of $30, gain a lifetime edge in identifying explosive market moves before they happen. Are you tired of lagging indicators that only show you what has already occurred? The Visual Tiger Speed Indicator is a next-generation tool designed to measure the true, unfiltered velocity of price action, giving you a unique advantage in any market condition. It moves beyond simple price analysis to decode the mo

Pivot Hunter EA Pivot Hunter EA è un robot di trading specializzato, sviluppato esclusivamente per la coppia di valute CADJPY sul timeframe H1 . La sua strategia è progettata per identificare potenziali punti di svolta del mercato, analizzando l'azione dei prezzi e il momentum. Il nucleo della logica dell'EA è un sistema di conferma multi-indicatore. Combina i segnali di indicatori classici, tra cui Parabolic SAR, Awesome Oscillator (AO), Relative Strength Index (RSI) e Average True Range

Visual Arctic Wolf Indicator: Hunt Down Market Momentum Unleash the power of the Arctic Wolf on your charts. This meticulously designed indicator for MetaTrader 5 provides a unique and intuitive way to visualize momentum shifts and capture high-probability trading signals. Stop guessing the market's direction and start trading with the precision of a predator. The Logic: Tracking the Hunt The Visual Arctic Wolf Indicator operates on a powerful and straightforward principle: measuring the balanc

Visual Eagle Momentum Indicator: Trade with Clarity and Precision Unlock the market's true momentum and leave noisy, confusing indicators behind. For just $30, the Visual Eagle Momentum Indicator gives you a powerful edge, helping you identify high-probability trades with confidence. Are you tired of the whipsaws and false signals from standard momentum indicators? The traditional MACD is a great tool, but in today's volatile markets, it often lags, causing you to enter trades late and exit pre

Dolphin Wave Pulse Indicator Unlock the underlying rhythm of the market with the Dolphin Wave Pulse Indicator, a sophisticated tool designed to identify high-probability entry points with precision. For just $30, this indicator moves beyond simple crossover strategies to detect powerful momentum shifts, giving you a clear edge in your trading. The Logic Behind the Pulse The Dolphin Wave Pulse Indicator is engineered to spot moments when a strong, directional "pulse" of momentum emerges. It achi

Dolphin Pulse Momentum: Ride the Waves of Profit Unlock the power of the market's natural rhythm with Dolphin Pulse Momentum, a sophisticated trading indicator designed to give you a decisive edge. For just $30, you can equip yourself with a tool that intelligently identifies high-probability entry and exit points, helping you navigate the complexities of any financial market with greater confidence. The Logic Behind the Indicator Dolphin Pulse Momentum is built on a powerful multi-layered algo

Overview ORA MA Master EA is a sophisticated yet easy-to-use Expert Advisor that implements a proven moving average crossover strategy. Designed for both novice and experienced traders, this EA automatically identifies and executes high-probability trading opportunities based on the crossover of two moving averages.
Key Features Smart Trading Strategy Dual MA Crossover System: Utilizes both fast and slow moving averages to generate precise entry and exit signals Trend Following: Capitalizes
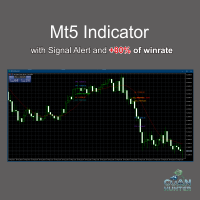
Features: Clear Buy/Sell labels with directional arrows. Automatic Take Profit (TP) & Stop Loss (SL) labels for better risk management. Easy-to-read chart signals (no messy lines). Works on any timeframe and any asset (Forex, Gold, Indices, Crypto, Stocks). Compatible with MetaTrader 5 (MT5 desktop & mobile sync) . Perfect for: Beginner traders who need straightforward signals. Experienced traders who want an extra confirmation tool. Anyone looking to simplify their chart without clutter.

Tempo Sniper Pro v2.0 è un Expert Advisor sofisticato che combina l'analisi HL LH multi-timeframe con il rilevamento intelligente dei swing per identificare opportunità di trading ad alta probabilità. Progettato sia per trader principianti che professionali, questo EA offre entrate precise con una gestione completa del rischio. CARATTERISTICHE PRINCIPALI Strategia Swing Multi-Timeframe Filtri Timeframe Superiore Precisione Timeframe di Entrata: timeframe (o personalizzato) per timing di entrat

Intelligent Moving Bot — Adaptive EA with Neural Optimization Intelligent Moving Bot is a fully autonomous EA built on the Intelligent Moving indicator. It uses a dynamic MA, ATR-based deviation bands, and virtual trades with a perceptron to optimize parameters on the fly — with no repainting and no manual curve-fitting. This product is also available for MetaTrader 4 => https://www.mql5.com/en/market/product/148152 Intelligent Moving indicator is available here => https://www.mql5.com/en/

A more detailed explanation with examples of PEF input/output is found in this blog page.
1. Overview The PEF script is a tool for portfolio optimization. It computes the Pareto E fficient F rontier between portfolio return and risk (either CVaR or Standard Deviation ) using Monte Carlo simulations and bootstrapping methods. The script enables traders and quantitative analysts to: Load historical price data for multiple instruments. Simulate portfolio outcomes with random or custom weight al
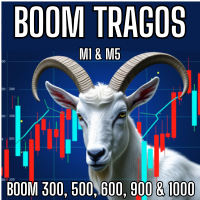
Boom Tragos – The Ultimate Boom Indices Scalping Indicator The Boom Tragos is a powerful scalping tool designed specifically for Boom 300, 500, 600, 900, and 1000 indices . Built for traders who want precision and consistency, this indicator helps you sell safely in Boom markets while avoiding unnecessary spikes. Timeframes: M1 and M5
Scalping Focus: Sell entries only on Boom Indices
Safe Holding Power: M1: Hold trades for 60 – 120 candles while avoiding spikes M5: Capture 20 – 40 candl
MetaTrader Market - i robot di trading e gli indicatori tecnici per trader sono disponibili nel tuo terminale di trading.
Il sistema di pagamento MQL5.community è disponibile per tutti gli utenti registrati sul sito MQL5.com che effettuano transazioni su MetaTrader Services. Puoi depositare e prelevare denaro usando WebMoney, PayPal o una carta di credito.
Ti stai perdendo delle opportunità di trading:
- App di trading gratuite
- Oltre 8.000 segnali per il copy trading
- Notizie economiche per esplorare i mercati finanziari
Registrazione
Accedi
Se non hai un account, registrati
Consenti l'uso dei cookie per accedere al sito MQL5.com.
Abilita le impostazioni necessarie nel browser, altrimenti non sarà possibile accedere.