Visual Cheetah Run Indicator
- Indicatori
-
AL MOOSAWI ABDULLAH JAFFER BAQER
 To trade successfully we need to go through the proven path that others had gone and reached!
Here are 17 quotes from such successful investors:
1- Limit your size in any position so that fear does not become the prevailing instinct guiding your judgment.
Joe Vidich - Versione: 1.0
- Attivazioni: 5
Visual Cheetah Run Indicator: Capture Market Momentum with Speed and Precision
Are you tired of cluttered charts and ambiguous trading signals? Do you struggle to identify strong trends before they take off, often entering the market too late? The Visual Cheetah Run Indicator is the definitive solution designed to provide crystal-clear, high-probability entry signals by identifying powerful market momentum with unparalleled accuracy.
For a one-time price of just $30, you can equip your MetaTrader 4 platform with a professional-grade tool engineered to simplify your trading and enhance your decision-making process.
The Core Logic: How It Works
The Visual Cheetah Run Indicator is not just another moving average crossover tool. It is built upon a sophisticated, proprietary algorithm designed to act as a comprehensive trend analysis system. Here is a detailed breakdown of its intelligent mechanics:
-
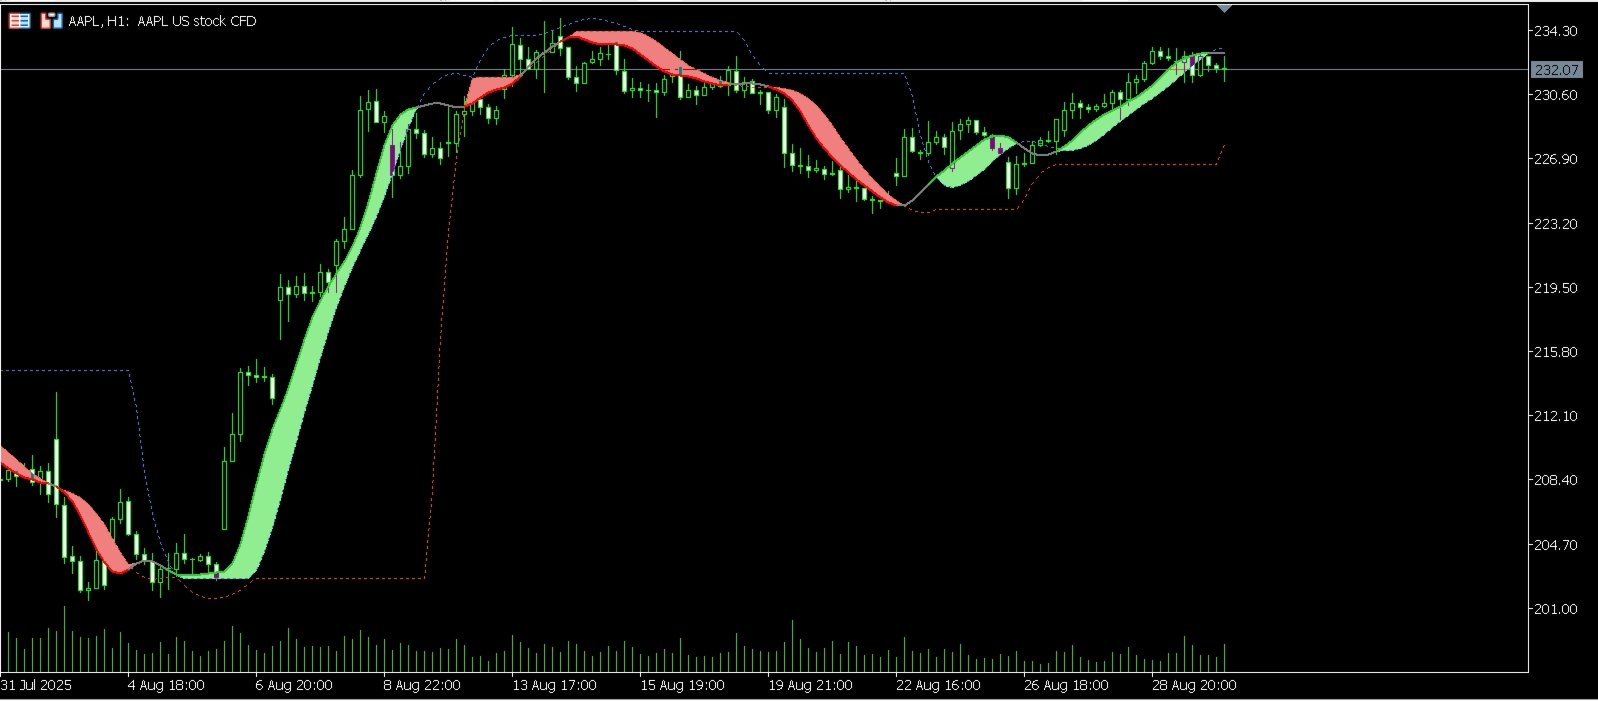
The Cheetah Wave Line: At the heart of the indicator is the main "Cheetah Wave Line." Unlike standard moving averages that lag significantly behind price, this wave line uses an advanced smoothing and trend calculation. This unique formula is highly responsive to immediate price action while effectively filtering out insignificant market noise. This allows it to detect the true beginning of a trend much earlier than traditional indicators.
-
Dynamic Volatility Channels: The indicator automatically plots an upper and lower channel around the Cheetah Wave Line. These channels are not static; they dynamically expand and contract based on recent market volatility, calculated using a dedicated period setting. These channels act as critical thresholds, helping to define bullish, bearish, and neutral market phases.
-
Color-Coded Market States: For instant market analysis, the indicator visually tells you the story of the trend:
-
Green Wave & Zone: When the Cheetah Wave Line breaks decisively above the upper channel, it turns green. This indicates a strong bullish momentum, and the area between the wave and the channel is shaded light green, visually confirming the "buy zone."
-
Red Wave & Zone: When the wave line plunges below the lower channel, it turns red. This signifies powerful bearish momentum, and the corresponding area is shaded light coral, highlighting the "sell zone."
-
Gray Wave: When the wave line is trading between the upper and lower channels, it remains gray. This represents a period of consolidation, sideways movement, or weak trend strength, advising the trader to remain patient and wait for a clear breakout.
-
-
High-Probability Signal Generation: The indicator generates simple, non-repainting buy and sell arrows based on a clear set of rules:
-
Buy Signal: A green "Buy" arrow is plotted below the price candle when the Cheetah Wave Line transitions from a neutral (gray) or bearish (red) state to a bullish (green) state by crossing above the upper channel. This confirms that new bullish momentum is in control.
-
Sell Signal: A red "Sell" arrow is plotted above the price candle when the wave line transitions from a neutral or bullish state to a bearish state by crossing below the lower channel. This confirms a significant shift to bearish momentum.
-
Key Features and Benefits
-
Non-Repainting Signals: Once a bar closes, the signals are locked in. You can trust the arrows you see, allowing for reliable backtesting and confident real-time trading.
-
Advanced Noise Filter Control: The unique "Bars Delay" feature is your defense against overtrading in choppy markets. It ensures that a minimum number of bars must pass before a new signal can be generated, filtering out false signals and focusing only on sustained moves.
-
Fully Customizable: Tailor the indicator to your specific trading style and preferred assets. Adjust the wave and channel periods, change the applied price (Close, Open, Weighted, etc.), and customize the signal arrow appearance.
-
Clear Visual Zones: The optional color-filled zones make it effortless to see whether the market is in a bullish or bearish phase at a single glance. No more second-guessing the trend direction.
-
Universal Applicability: Works effectively across all markets (Forex, Commodities, Indices, Cryptocurrencies) and on any timeframe, from scalping to long-term position trading.
-
Versatile Trading Tool: Use it as a complete standalone trading system or as a powerful confirmation tool to enhance your existing strategy.
How to Trade with the Visual Cheetah Run Indicator
-
Entry Signals:
-
Buy: Enter a long position when a green "Buy" arrow appears.
-
Sell: Enter a short position when a red "Sell" arrow appears.
-
-
Stop-Loss Placement:
-
For a buy trade, place your stop-loss below the most recent swing low or below the lower dynamic channel.
-
For a sell trade, place your stop-loss above the most recent swing high or above the upper dynamic channel.
-
-
Exit Strategy:
-
Consider exiting your trade when an opposite signal appears.
-
Alternatively, take profit when the Cheetah Wave Line returns to the gray neutral zone, indicating the initial momentum has faded.
-
Stop chasing the market and start trading with the trend. The Visual Cheetah Run Indicator provides the clarity and confidence you need to navigate the markets effectively.
Add this powerful tool to your collection today for just $30 and transform your trading analysis.