Visual Wolf Trend Line Indicator
- Indicatori
-
AL MOOSAWI ABDULLAH JAFFER BAQER
 To trade successfully we need to go through the proven path that others had gone and reached!
Here are 17 quotes from such successful investors:
1- Limit your size in any position so that fear does not become the prevailing instinct guiding your judgment.
Joe Vidich - Versione: 1.0
- Attivazioni: 5
Visual Wolf Trend Line: Your Ultimate Trend Following Co-Pilot
Unlock the power of clear, confident trend trading with the Visual Wolf Trend Line indicator. In a market full of noise and conflicting signals, this tool is designed to be your definitive guide, providing an intuitive, at-a-glance understanding of market dynamics combined with precise entry and exit signals. For just $30, you can stop guessing and start trading with a quantifiable edge.
What is the Visual Wolf Trend Line?
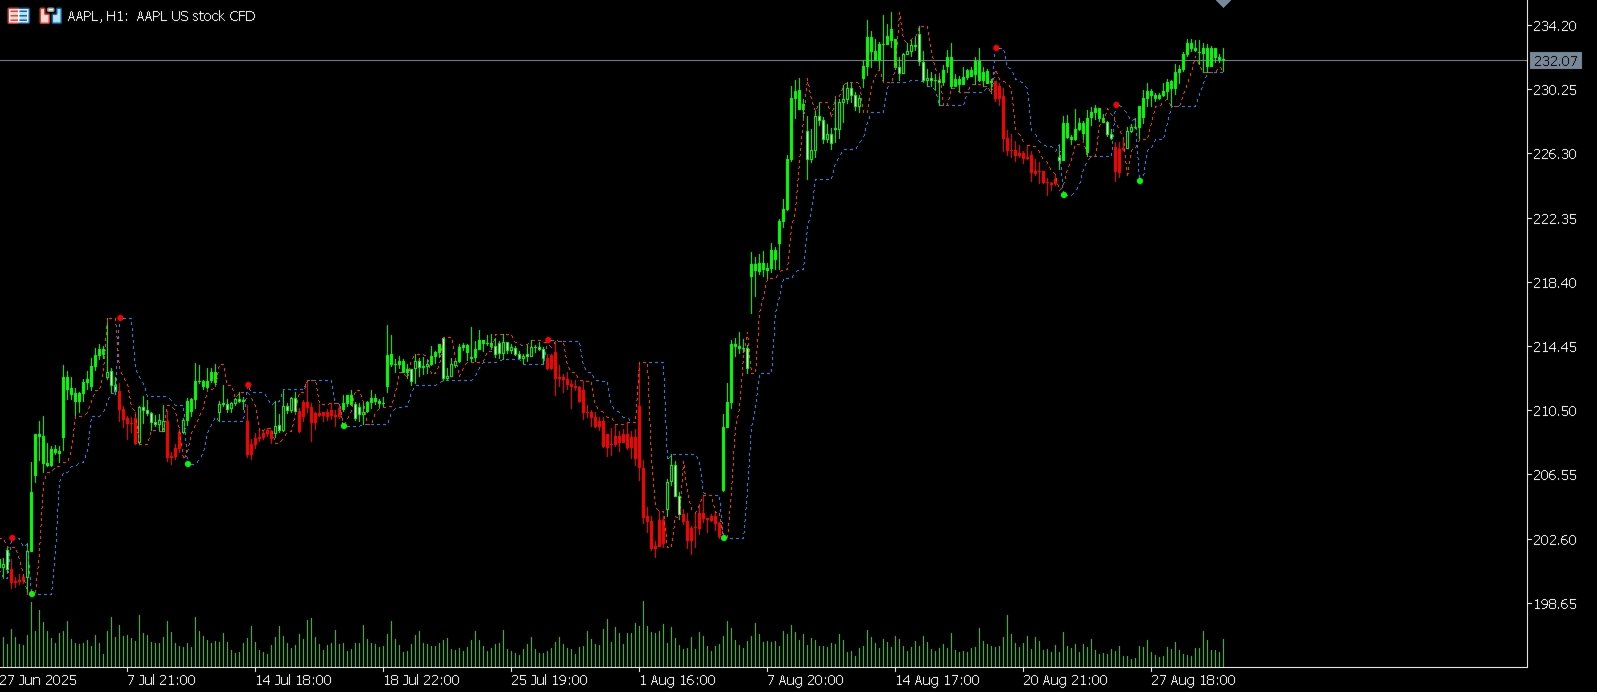
The Visual Wolf Trend Line is a comprehensive trend analysis and signal generation tool built for MetaTrader. It goes beyond simple moving averages by creating two unique, dynamic trend lines that adapt to recent price volatility. The indicator's core function is to visually simplify the market, coloring the price candles based on the current trend (bullish, bearish, or neutral) and placing clear arrows for buy, sell, and exit opportunities directly on your chart. It is designed to be a complete, all-in-one solution for trend followers.
The Logic Behind the Wolf: A Detailed Explanation
The strength of the Visual Wolf Trend Line lies in its unique, multi-layered calculation engine. Here is how it works to give you an unparalleled view of the market:
-
Dual-Period Volatility Analysis: The indicator's foundation is built on two user-defined periods: a Fast Period and a Slow Period. For every bar on the chart, it looks back over these periods to find the absolute highest high and lowest low. This is not a simple average; it is a direct measure of the most extreme price points, capturing the true volatility and trading range.
-
Adaptive "Wolf" Trend Lines: Using this volatility data, the indicator plots two dynamic lines: the Fast Line and the Slow Line. These are not standard moving averages. They are intelligent support and resistance levels that "step" with the price.
-
If the current closing price moves above the previous value of a Wolf Line, the line immediately adjusts to the most recent low, acting as a new dynamic support level.
-
Conversely, if the price closes below the previous Wolf Line value, the line instantly adjusts to the most recent high, forming a new dynamic resistance level.
This adaptive behavior ensures the lines are always relevant to the current market structure, providing a much clearer picture than lagging indicators.
-
-
Precise Trend Definition: A trend is only confirmed when the price action respects both Wolf Lines simultaneously.
-
Bullish Trend (Lime Candles): The trend is confirmed bullish only when the closing price is securely above both the Fast Line and the Slow Line.
-
Bearish Trend (Red Candles): The trend is confirmed bearish only when the closing price is securely below both the Fast Line and the Slow Line.
-
Neutral/Consolidation (Gray Candles): If the price is between the lines, the market is considered to be in a consolidation or uncertain phase, and the indicator waits for a clear breakout.
-
-
High-Probability Signal Generation: Signals are generated based on a "change of state" logic, ensuring you only enter when momentum is confirmed.
-
Buy Signal: A buy arrow is printed when the trend officially changes from bearish or neutral to bullish. This isn't just a simple crossover; it's a confirmation that the price has broken above both dynamic resistance levels.
-
Sell Signal: A sell arrow is printed when the trend officially changes from bullish or neutral to bearish, confirming the price has broken below both dynamic support levels.
-
Exit Signal: To protect your profits and limit losses, an exit signal (a yellow cross) is generated if the trend begins to fail. For example, after a buy signal, an exit signal will appear if the price closes back below the Fast Line or if the overall trend flips to bearish.
-
Key Features
-
Intuitive Visual Interface: With trend-colored candles, you can understand the market sentiment in a fraction of a second.
-
Dual Dynamic Trend Lines: The adaptive Wolf Lines provide far more relevant support and resistance levels than traditional indicators.
-
Precise, Non-Repainting Signals: Entry and exit arrows are generated based on strict, confirmed criteria, giving you reliable signals to act on.
-
Built-in Signal Filter: An optional "Bars Delay" feature prevents the indicator from generating too many signals in a choppy market, helping you avoid over-trading.
-
Fully Customizable: Easily adjust the periods, colors, arrow sizes, and offsets to match your specific trading style and chart setup.
-
Clean and Efficient Code: The indicator is professionally coded to be light on your computer's resources, ensuring smooth performance.
Who is this for?
The Visual Wolf Trend Line is a versatile tool suitable for all types of traders:
-
Day Traders and Scalpers: Can use shorter Fast and Slow periods to capture intraday trends and quick momentum shifts.
-
Swing Traders: Can use longer periods to identify and ride major trends over several days or weeks.
-
Beginners: Will find the visual simplicity of the colored bars and clear arrows an invaluable aid in learning to read the market.
-
Experienced Traders: Will appreciate the sophisticated adaptive logic and the ability to fine-tune the settings to complement their existing strategies.
Stop trading in confusion. Add the Visual Wolf Trend Line to your chart today and start trading the trend with clarity and confidence.
Input Parameters
-
Fast Period: The lookback period for the fast volatility calculation.
-
Slow Period: The lookback period for the slower, more stable volatility calculation.
-
Enable bars between signals: Set to true to activate the signal filter.
-
Bars to wait between signals: The minimum number of bars that must pass before a new signal can be generated.
-
Arrow offset from price (points): Adjusts how far the signal arrows are placed from the price bar.
-
Arrow size (1-5): Controls the visual size of the signal arrows.
-
Buy/Sell/Exit signal color: Full customization of the arrow colors to match your chart theme.