Visual Wolf Sphere Indicator
- Indicatori
-
AL MOOSAWI ABDULLAH JAFFER BAQER
 To trade successfully we need to go through the proven path that others had gone and reached!
Here are 17 quotes from such successful investors:
1- Limit your size in any position so that fear does not become the prevailing instinct guiding your judgment.
Joe Vidich - Versione: 1.0
- Attivazioni: 5
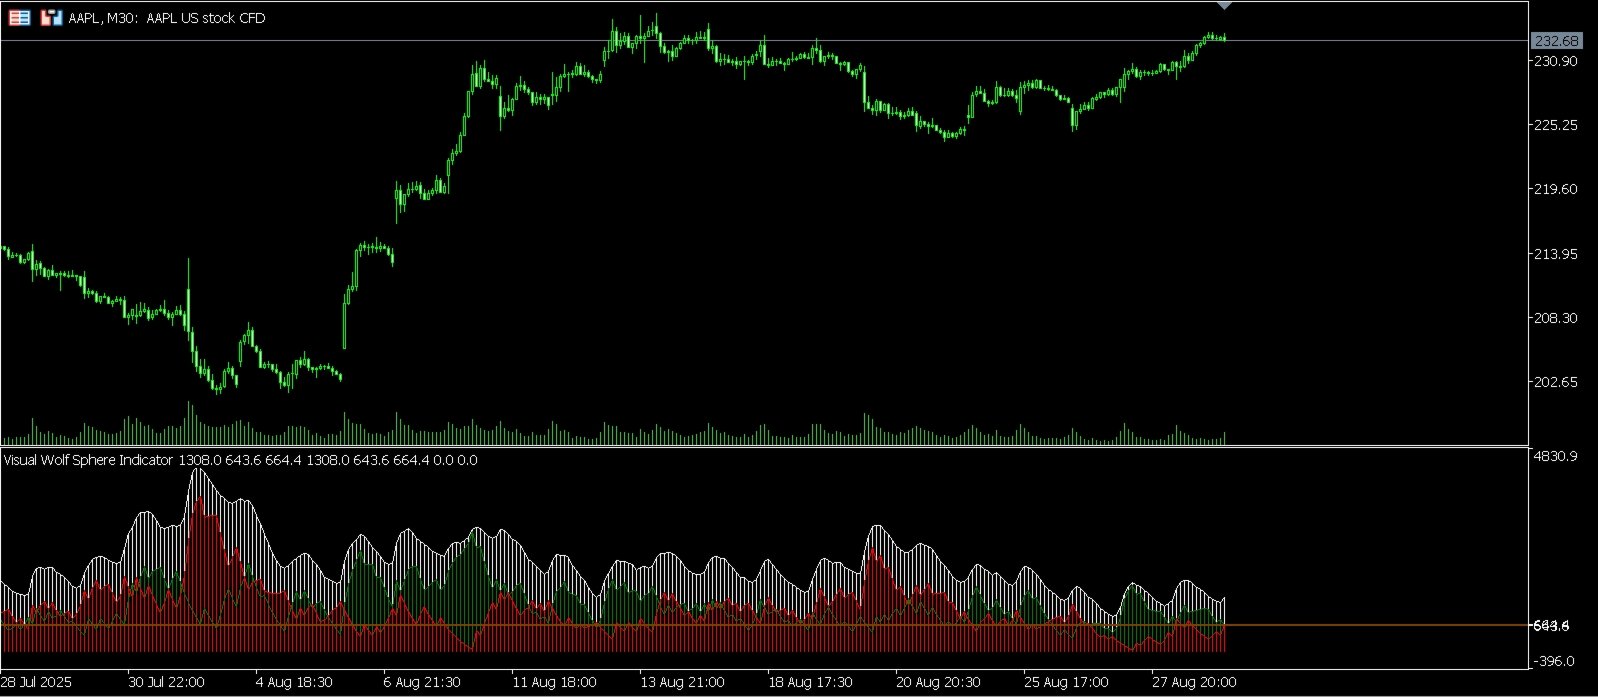
Unleash the Power of Market Momentum with the Visual Wolf Sphere Indicator
Are you ready to gain a profound understanding of the market's inner workings? The Visual Wolf Sphere Indicator is not just another tool; it is a comprehensive trading solution designed to give you a crystal-clear view of volume dynamics and market sentiment. For just $30, you can equip yourself with an indicator that deciphers the complex language of the market, helping you to make more informed and confident trading decisions.
The Logic: Deconstructing the Market's DNA
At its core, the Visual Wolf Sphere Indicator is built upon a sophisticated analysis of volume, meticulously classifying each price bar to reveal the true balance of power between buyers and sellers. Here’s a detailed breakdown of the engine driving this powerful tool:
1. Advanced Volume-Type Classification:
Most volume indicators simply show the total volume, leaving you to guess the underlying sentiment. The Visual Wolf Sphere Indicator goes deeper. It intelligently analyzes the relationship between the open, close, and the previous bar's close to categorize the volume into distinct types:
-
Bullish Volume (Green): This is identified when the price closes higher than the previous close, regardless of whether the bar itself was bullish or bearish. This signifies a genuine upward momentum.
-
Bearish Volume (Red): This occurs when the price closes lower than the previous close, indicating dominant selling pressure.
-
Neutral Volume (White): When the price action is indecisive, the volume is classified as neutral, helping you to stay out of choppy, unpredictable markets.
By separating the volume into these clear categories, you can instantly gauge who is in control of the market.
2. Triple Exponential Moving Average (TEMA) for Superior Smoothing:
To eliminate market noise and provide you with smooth, reliable signals, the indicator uses the Triple Exponential Moving Average (TEMA). Unlike simple moving averages that lag significantly, TEMA is a fast-acting, momentum-based average that reduces the lag between the indicator and the price. This means you get more responsive and timely signals. The indicator applies TEMA to the bullish, bearish, and total volume, giving you a smoothed-out, easy-to-read visualization of the underlying trends.
3. The Convergence Oscillator: Your Momentum Compass:
The true power of the Visual Wolf Sphere Indicator is unlocked with its Convergence Oscillator. This is calculated by taking the difference between the Bullish Volume TEMA and the Bearish Volume TEMA. The result is a single, powerful line that oscillates around a zero level, providing you with a wealth of information:
-
Above Zero: When the oscillator is above zero, it signifies that bullish momentum is stronger than bearish momentum.
-
Below Zero: When it's below zero, selling pressure is in command.
-
Rising Oscillator: An upward-moving oscillator indicates that buying pressure is increasing.
-
Falling Oscillator: A downward-moving oscillator signals that selling pressure is intensifying.
This oscillator is your ultimate guide to market momentum, helping you to confirm trends and spot potential reversals with high accuracy.
Key Features and Benefits
-
Visualize Market Sentiment: With color-coded volume histograms, you can see at a glance whether bulls or bears are in control.
-
Confirm Trends: Use the Convergence Oscillator to validate the strength of a trend. A rising oscillator in an uptrend, or a falling one in a downtrend, provides strong confirmation.
-
Spot Reversals: Divergences between the price and the Convergence Oscillator can be powerful early warning signs of a potential trend reversal.
-
Customizable Display: Tailor the indicator to your personal trading style. You can choose to display total volume, bull/bear volume, the oscillator, or a combination of these. You can even isolate the oscillator for a clean, focused view.
-
Dynamic Levels: The indicator can display horizontal lines representing the current values of the bull and bear volume TEMA, acting as dynamic support and resistance levels for momentum.
How to Use the Visual Wolf Sphere Indicator
-
Bullish Scenario: Look for the Bull Volume (green) to be consistently higher than the Bear Volume (red). The Convergence Oscillator should be above the zero line and ideally rising. This is a strong signal to look for buying opportunities.
-
Bearish Scenario: Look for the Bear Volume (red) to dominate the Bull Volume (green). The Convergence Oscillator should be below the zero line and falling. This indicates a strong selling pressure and a good time to look for short entries.
-
Convergence and Divergence: Pay close attention to how the oscillator behaves in relation to the price. If the price is making new highs, but the oscillator is failing to do so (bearish divergence), it could signal an upcoming reversal to the downside. Conversely, if the price is making new lows, but the oscillator is making higher lows (bullish divergence), it could be a sign that the downtrend is losing steam.
Fully Customizable to Your Needs
The Visual Wolf Sphere Indicator comes with a range of input parameters that allow you to fine-tune it to your preferred trading instruments and timeframes. Adjust the TEMA periods for volume and convergence to match your strategy, and toggle the visibility of different components to create your perfect analysis setup.
For just $30, the Visual Wolf Sphere Indicator is an invaluable addition to any trader's toolkit. Stop guessing and start seeing the market with clarity. Make the smart choice today and empower your trading with this exceptional indicator.