React Fibonacci Chart

4.75

Funzionalità


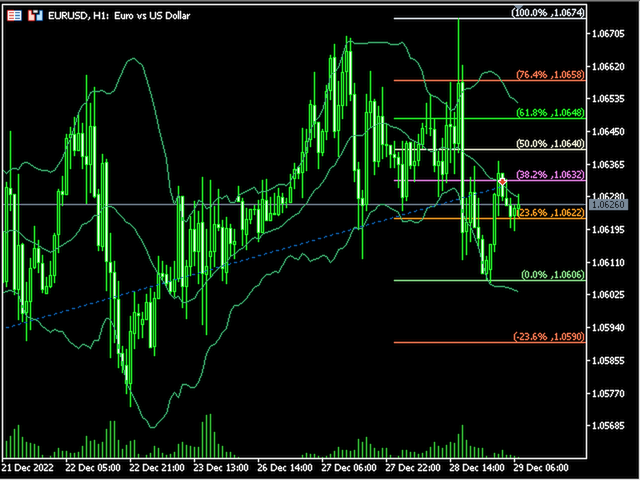
  • Indicatore per il Trading di Ritrazione di Fibonacci
  • Viene disegnato un grafico di Fibonacci basato sulla barra precedente selezionata tra 1H, 4H, 1D e 1W.
  • Quando il prezzo di mercato tocca il livello di Fibonacci, il colore cambia e viene visualizzato l'orario del tocco.
  • Il grafico di Fibonacci è disegnato ai livelli -23.6, 0, 23.6, 38.2, 50, 61.8, 76.4, 100 e 123.6, e il grafico si aggiorna quando la barra viene aggiornata.


Variabili


  • Intervallo di tempo: Un grafico di Fibonacci è disegnato con l'intervallo di tempo selezionato tra 1H, 4H, 1D e 1W.
  • FiboWidth: Determina lo spessore del livello.
  • FiboStyle: Imposta lo stile del livello di pivot.
  • TouchedColor: Colore che cambia al tocco.


Si prega di commentare se si trovano errori o se si desiderano miglioramenti.

Le valutazioni sono di grande aiuto per gli sviluppatori. Se siete soddisfatti, vi preghiamo di darci 5 stelle.


Recensioni 14
Benjamin Afedzie
3863
Benjamin Afedzie 2025.06.11 19:11 
 

great work

w.martins
14
w.martins 2025.02.25 14:31 
 

It is a great indicator for traders using Fibo. However, alerts, even if disabled, still continue to appear in the notification. I've tried several ways to get it off on MT5. But without success. Still, I use it every day. I'm grateful.

DDDD7777777PPPP
104
DDDD7777777PPPP 2025.02.12 19:44 
 

Bom!

Prodotti consigliati
Time Box Indicator MT5
Young Ho Seo
4.67 (3)
Introduction To Time Box Indicator Time Box Indicator is a must have indicator for any trader. It will display daily, weekly and Monthly box according to your preferences. Yet, you can extend any important price levels in your chart automatically. You can use them as the significant support and resistance levels. It is very simple but effective tool for your trading. Graphic Setting Use White Chart Line Style for Current Open price Daily Setting Update Timeframe for daily box Number of days to
FREE
Peak Trough Analysis is the great tool to detect peaks and troughs in your chart. Peak Trough Analysis tool can use three different peaks and troughs detection algorithm. The three algorithm include the orignal Fractals Indicator by Bill Williams, the Modified Fractals indicator and ZigZag indicator. You can use this peak and trough analysis tool to detect the price pattern made up from Equilibrium Fractal-Wave process. For further usage, there are good guide line on how to use this peak trough
FREE
PIVOT eXtreme
Syamsurizal Dimjati
Pivot eXtreme Pivot adalah level referensi penting yang digunakan trader untuk memetakan potensi support & resistance intraday maupun jangka lebih panjang. Dalam sistem ini, level pivot dikembangkan menjadi P (Pivot Point utama) , R1–R13 (Resistance) , serta S1–S13 (Support) . Pivot Point (P) Titik pusat utama, dihitung dari rata-rata harga (High + Low + Close) / 3 . Berfungsi sebagai acuan keseimbangan harga : Jika harga di atas P → tren cenderung bullish. Jika harga di bawah P → tren cenderung
FREE
Pivot Point Multi-Method with Dashboard This indicator is a technical analysis tool designed to calculate and display horizontal support and resistance levels based on various Pivot Point methodologies. It is built using the MQL5 Canvas library, ensuring efficient performance and a clean visual presentation on the chart. The tool calculates levels using the data from the previous completed candle of a user-defined reference timeframe. This ensures that the levels remain fixed for the duration of
FREE
English VWAP Daily (Clean) is a simple and lightweight indicator that plots the classic Daily VWAP (Volume Weighted Average Price) directly on your MT5 chart. Features: Classic Daily VWAP calculation Supports real volume (if available) or tick volume Timezone offset option to match your broker’s server time Weekend merge option (merge Saturday/Sunday data into Friday) Clean version → no arrows, no alerts, only VWAP line VWAP is widely used by institutional traders to identify fair value, su
FREE
B2U Market State System Part of the B2U Market State System A professional indicator suite designed to analyze market structure, trend state, and momentum. B2U Market State System 의 구성 요소입니다. 시장 구조, 추세 상태, 모멘텀을 입체적으로 분석하기 위한 전문 인디케이터 시스템입니다. Highlights structurally validated reaction zones after FVG inversion. The New Generation of Inversion Fair Value Gaps B2U IFVG BOX & Zone visually analyzes market reaction zones formed after Fair Value Gap (FVG) inversion. 차세대 Inversion Fair Value Gaps FVG 반
FREE
AliPivot Points is a Meta Trader 5 Indicator that draws you the latest pivot points. You can choose from timeframes ranging from 1 Minute to 1 Month. Calculation methods for pivot points includes: Classic Pivot Points Camarilla Pivot Points Fibonacci Pivot Points Woodie Pivot Points You can personalize the line colors, style, and width to suit your preference. The indicator displays values on the right side of the chart. AliPivot Points values can also be utilized by developers for creating Expe
FREE
Pivot Points are a classic technical analysis indicator that calculates the central pivot point (PP) as well as support (S1–S3) and resistance (R1–R3) levels based on the previous day’s High, Low, and Close. The indicator allows you to: • identify key zones where the price may bounce or break through • determine the direction of the trend • find good entry points, as well as set stop loss and take profit levels Indicator settings: • enable/disable PP, R1/S1, R2/S2, R3/S3 • enable/disable price l
FREE
Raymond Cloudy Day
The Hung Ngo
5 (3)
Raymond Cloudy Day Indicator for MT5 – Pivot-Based Reversal and Trend Levels Raymond Cloudy Day Indicator is a pivot-based level indicator for MetaTrader 5 (MT5). It was developed by Ngo The Hung based on Raymond’s original idea and is designed to give a structured view of potential reversal zones, trend extensions and support/resistance levels directly on the chart. The default settings are optimised for XAUUSD on the H1 timeframe, but the indicator can be tested and adjusted for other symbols
FREE
Macro-R Pro Signal — Advanced Trading Signal Indicator Macro-R Pro Signal is a professional trading indicator designed to deliver high-quality BUY and SELL signals with enhanced precision and reduced market noise. By combining Bollinger Bands, RSI, and adaptive volatility filtering , this indicator helps traders identify high-probability reversal points while avoiding unfavorable market conditions. How the Strategy Works This indicator is built on a mean reversion + momentum confirmation concep
FREE
Vertical Volume
Kim Yonghwa
4.8 (5)
Caratteristiche Indicatore per verificare il volume per prezzo. Funziona principalmente per EURUSD, su altre coppie di valute potrebbe non funzionare o il calcolo potrebbe richiedere molto tempo. Per un uso fluido, attivare l'opzione "Sposta il confine della fine del grafico dal margine destro", come mostrato nello screenshot. Quando appare una nuova barra, i dati vengono reimpostati. Variabili COlOR: Impostazione del colore dell'indicatore WIDTH: Impostazione della larghezza dell'indicatore
FREE
Introduction to Fractal Moving Average Fractal Moving Average indicator was designed as part of Fractal Pattern Scanner. Inside Fractal Pattern Scanner, Fractal Moving Average Indicator was implemented as multiple of chart objects. With over thousands of chart object, we find that it was not the best and efficient ways to operate the indicator. It was computationally too heavy for the indicator. Hence, we decide to implement the indicator version of Fractal Moving Average indicator to benefit ou
FREE
Time Candle with Sound Alert This indicator will be display the time left candle Features : 1. Multi Time Frames, Multi Pairs 2. Time Left 2. Position dynamic with Bid Price or Edge of Chart Screen 3. Font Size and Color 4. Display Current Spread, Maximum Spread and Minimum Spread Note: Maximum and Minimum Spread will be reset when you change TF Tested On MT5 Version 5 Build 5200 If you want the source code, just PM me
FREE
Auto Fibonacci Retracement Indicator — Flexible and Reliable This isn’t just another Auto Fibonacci Retracement indicator. It’s one of the most flexible and dependable tools available . If you find it useful, please consider leaving a review or comment — your feedback means a lot! Check out my other helpful tools below: Smart Alert Manager   - Set up advanced alerts and send them to Mobile, Telegram, Discord, Webhook... Timeframes Trend Scanner    - Scan the trend of assets in difference timefr
FREE
The Pivot Indicator is a vital tool for technical analysis used by traders in the financial markets. Designed to assist in identifying potential reversal points or trend changes, this indicator provides valuable insights into key levels in the market. Key features of the Pivot Indicator include: Automatic Calculations: The Pivot Indicator automatically calculates Pivot Point, Support, and Resistance levels based on the previous period's high, low, and close prices. This eliminates the complexity
FREE
Camarilla Swing Trade Indicator is an Indicator. Support and resistance points are calculated from the High Low Close of the previous TF Week's price. What are Camarilla Pivot Points? 1.Camarilla Pivot Points is a modified version of the classic Pivot Point. 2.Camarilla Pivot Points was launched in 1989 by Nick Scott, a successful bond trader. 3.The basic idea behind Camarilla Pivot Points is that price tends to revert to its mean until it doesn't. 4.Camarilla Pivot Points is a mathematical pr
FREE
This indicator is a **Pivot-Confluence Zone Identifier** that focuses exclusively on identifying key support and resistance levels where price clusters align with classic pivot points. Here's what it does: ## Core Functionality **Pivot Confluence Detection**:  - Only displays price zones that align with classic pivot point levels (R1, R2, R3, S1, S2, S3) - **Excludes the main pivot point** - focuses only on support and resistance levels - Uses a configurable pip range to detect confluence nea
FREE
An extended version of the indicator for visualizing the time ranges of key trading sessions: Asian, European and American. The main advantage of this indicator is the automatic construction of a price profile for a trading session. The indicator has the functionality to set the start and end time of each trading session, as well as automatically determine the time zone of the trading server. The indicators include the ability to work with minimal CPU usage and save RAM. In addition, the option
FREE
Volume Statistic
Syamsurizal Dimjati
5 (1)
Ritz Volume Statistic – Color Volume Histogram & Market Flow Insight Ritz Volume Statistic is a clean and powerful volume analysis indicator designed to visualize bullish and bearish market pressure through a dynamic color-graded volume histogram . The indicator transforms raw tick volume into an intuitive color spectrum , allowing traders to instantly identify volume expansion, exhaustion, and dominance shifts between buyers and sellers. A built-in statistical panel summarizes total volume, bul
FREE
THE MARKET HAS AN ANGLE Anywhere else doesn’t exist- Measure the Real Structural Trend Structural Trend Angle & Strength Engine 구조적 추세 각도 & 강도 분석 엔진- B2U TrendFinder Channel 은 로그 회귀 (Log Regression) 기반의 구조적 추세 채널입니다 . 단순 가격 이동이 아닌 , 시장의 실제 추세 방향 · 각도 · 통계적 강도를 분석합니다 . B2U Market State System Part of the B2U Market State System B2U TrendFinder Channel is a structural log-regression channel designed to measure true market trend direction, angle, and statistical strength. This is NOT a repainting i
FREE
Fair Value Gap Scanner
Usiola Oluwadamilol Olagundoye
The Fair Value Gap Detector is a MetaTrader 5 indicator designed to identify and draw rectangles on the chart wherever fair value gaps (FVGs) are detected. Fair value gaps occur when there is a significant disparity between the current price and the fair value of an asset. These gaps can provide valuable insights into potential trading opportunities, as they often indicate overbought or oversold conditions in the market. Key Features: FVG Detection: The indicator utilizes a proprietary algorith
FREE
MACD avanzato (Convergenza e Divergenza delle Medie Mobili) con segnali a doppia linea, sistema a un livello, supporto multi-timeframe, segnali visivi personalizzabili e sistema di avvisi altamente configurabile. Servizi di programmazione freelance, aggiornamenti e altri prodotti TrueTL sono disponibili sul mio profilo MQL5 . Feedback e recensioni sono molto apprezzati! Cos'è il MACD? Il MACD (Moving Average Convergence Divergence) è un indicatore di momentum seguace di tendenza che mostra la
FREE
# Super Trend Indicator - User Guide *** Group support:  https://www.mql5.com/en/channels/vuongphamtrading **Version:** 1.04 | **Platform:** MetaTrader 5 | **Release:** January 2025 ## OVERVIEW The **Grid Trend Indicator** combines Supertrend with Dual EMA filters to identify high-probability trading opportunities. Unlike standard indicators showing only bullish/bearish signals, this adds a crucial third state: **NO TREND**. ### Key Features **Triple-State System**: UPTREND (Green) / DO
FREE
Swiss VWAPsimple
Terence Gronowski
4.8 (5)
Swiss VWAPsimple Motivation Did not find free VWAP that works, the one that I found craseh. So I created a VWAP which calculates values only for the actual day. So computer resouces are not over stressed. What is VWAP, how is it used?  VWAP stands for Volume Weighed Average Price, it calculates the running sum of tick volume and the runnung sum of price times tickvolume. The division of these sums result in a weighed price (Sum P*V/Sum V). The calculation starts normally at midnight. The values
FREE
Fibo Pivot Optimus
Syamsurizal Dimjati
5 (1)
Ritz Smart FIBOPIVOT Optimus Pro Advanced Multi-Timeframe Fibonacci Trading System SMART PREDICTION & ACCURATE FORECAST Revolutionary Fibonacci Pivot Technology combines traditional pivot points with advanced Fibonacci extensions, creating a powerful predictive tool for professional traders. Our algorithm intelligently detects significant price levels across multiple timeframes, delivering laser-accurate support and resistance zones before the market moves . INTELLIGENT VOLUME-VALIDATED SIGNALS
FREE
The selective pin bar is designed to identify reversals. To use the selective pin bar effectively, traders typically look for Strong Rejection: The tail of the pin bar should extend significantly beyond the surrounding price action. It indicates that there was a sharp rejection of higher or lower prices during the trading period. A strong rejection suggests that the market sentiment may be changing.
FREE
SnR Engine
Muhammad Tamimul Huda
SnR Engine Basically, this is a Support and Resistance indicator like most others that use fractals to determine support and resistance levels. The difference is that this indicator determines whether a support or resistance level has been broken based on ATR. Levels that have been broken will become “dead levels” and will be shown with dashed lines. Levels that have many rejections and fail to be broken will have increasingly thicker lines. For effective use, you need to understand the charac
FREE
-- Semplice ma efficace. Indicatore di inversione - Che cos'è? Un indicatore di sovrapposizione che segue il trend e combina la logica SuperTrend con la tecnologia della curva esponenziale. Rileva la direzione del trend, traccia un canale dinamico sul grafico e invia avvisi in tempo reale quando il trend si inverte. Come funziona? L'indicatore calcola una linea di base esponenziale utilizzando l'ATR e un fattore SuperTrend. Quando il prezzo chiude al di sopra o al di sotto di questa linea di
FREE
Support Resistance Indicator The "Support Resistance" indicator is a versatile tool designed to help traders identify key support and resistance levels based on an underlying algorithm. These levels indicate price points where an asset historically experiences buying (support) or selling (resistance) pressure. The indicator allows traders to visualize these levels on their charts, making it easier to make informed decisions. All Products   |   Contact PARAMETERS: Timeframe : Users can select the
FREE
Fair Value Gap Zone
Mattia Impicciatore
Descrizione Generale Il Fair Gap Value Indicator individua e mette in evidenza i “fair value gap” sul grafico di MetaTrader 5. Un fair gap si crea quando tra il minimo di una barra e il massimo di un’altra, separate da una barra intermedia, si forma un vuoto di prezzo. L’indicatore disegna rettangoli colorati (rialzisti e ribassisti) per evidenziare queste aree, offrendo un valido supporto visivo nelle strategie di price action. Principali Caratteristiche Rilevamento gap rialzisti : evidenzia ga
FREE
Gli utenti di questo prodotto hanno anche acquistato
ARIPoint
Temirlan Kdyrkhan
ARIPoint is a powerful trading companion designed to generate high-probability entry signals with dynamic TP/SL/DP levels based on volatility. Built-in performance tracking shows win/loss stats, PP1/PP2 hits, and success rates all updated live. Key Features: Buy/Sell signals with adaptive volatility bands Real-time TP/SL/DP levels based on ATR Built-in MA Filter with optional ATR/StdDev volatility Performance stats panel (Success, Profit/Loss, PP1/PP2) Alerts via popup, sound, push, or email Cu
SuperScalp Pro
Van Minh Nguyen
4.57 (21)
SuperScalp Pro – Sistema avanzato di indicatore scalping multi-filtro SuperScalp Pro è un indicatore di scalping avanzato che combina il classico Supertrend con molteplici filtri intelligenti di conferma per aiutare a identificare opportunità di trading. Funziona in modo efficiente su diversi timeframe da M1 a H4, con prestazioni ottimizzate su XAUUSD, BTCUSD e principali coppie Forex. L’indicatore fornisce chiari segnali Buy e Sell, insieme a livelli di ingresso, stop loss e take profit calcola
Divergence Bomber
Ihor Otkydach
4.9 (86)
Ogni acquirente dell’indicatore riceverà inoltre gratuitamente: L’utilità esclusiva “Bomber Utility”, che gestisce automaticamente ogni operazione, imposta i livelli di Stop Loss e Take Profit e chiude le posizioni secondo le regole della strategia I file di configurazione (set file) per adattare l’indicatore a diversi asset I set file per configurare il Bomber Utility in tre modalità: “Rischio Minimo”, “Rischio Bilanciato” e “Strategia di Attesa” Una guida video passo-passo per installare, conf
Entry In The Zone and SMC Multi Timeframe is a real-time 2-in-1 market analysis tool that combines market structure analysis and a No Repaint BUY / SELL signal system into a single indicator, built on Smart Money Concepts (SMC) — a widely adopted framework used by professional traders to understand market structure. This indicator helps you see the market more clearly, make decisions based on structure rather than guesswork, and focus on high-probability zones where price is more likely to react
Quantum TrendPulse
Bogdan Ion Puscasu
5 (23)
Ecco   Quantum TrendPulse   , lo strumento di trading definitivo che combina la potenza di   SuperTrend   ,   RSI   e   Stocastico   in un unico indicatore completo per massimizzare il tuo potenziale di trading. Progettato per i trader che cercano precisione ed efficienza, questo indicatore ti aiuta a identificare con sicurezza le tendenze di mercato, i cambiamenti di momentum e i punti di entrata e uscita ottimali. Caratteristiche principali: Integrazione SuperTrend:   segui facilmente l'andame
Gold Entry Sniper
Tahir Mehmood
5 (8)
Gold Entry Sniper – Dashboard ATR Multi-Timeframe per Scalping e Swing Trading sull’Oro Gold Entry Sniper è un indicatore avanzato per MetaTrader 5 che offre segnali di acquisto/vendita precisi per XAUUSD e altri strumenti, basato sulla logica ATR Trailing Stop e l' analisi multi-timeframe . Caratteristiche e Vantaggi Analisi Multi-Timeframe – Visualizza trend su M1, M5, M15 in un'unica dashboard. Trailing Stop Basato su ATR – Stop dinamici che si adattano alla volatilità. Dashboard Professional
Power Candles MT5
Daniel Stein
4.75 (8)
Power Candles – Segnali di ingresso basati sulla forza per tutti i mercati Power Candles porta l’analisi di forza collaudata di Stein Investments direttamente sul grafico dei prezzi. Invece di reagire solo al prezzo, ogni candela viene colorata in base alla reale forza di mercato, consentendo di identificare immediatamente accumuli di momentum, accelerazioni della forza e transizioni di trend pulite. Un’unica logica per tutti i mercati Power Candles funziona automaticamente su tutti i simboli di
Azimuth Pro
Ottaviano De Cicco
5 (7)
Azimuth Pro V2: Synthetic Fractal Structure and Confirmed Entries for MT5 Overview Azimuth Pro is a multi-level swing structure indicator by Merkava Labs . Four nested swing layers, swing-anchored VWAP, ABC pattern detection, three-timeframe structural filtering, and closed-bar confirmed entries — one chart, one workflow from micro-swings to macro-cycles. This is not a blind signal product. It is a structure-first workflow for traders who care about location, context, and timing. V2 Launch Offe
Gann Made Easy è un sistema di trading Forex professionale e facile da usare che si basa sui migliori principi del trading utilizzando la teoria di mr. WD Gann. L'indicatore fornisce segnali ACQUISTA e VENDI accurati, inclusi i livelli di Stop Loss e Take Profit. Puoi fare trading anche in movimento utilizzando le notifiche PUSH. CONTATTAMI DOPO L'ACQUISTO PER RICEVERE GRATUITAMENTE LE ISTRUZIONI DI TRADING E OTTIMI INDICATORI EXTRA! Probabilmente hai già sentito parlare molte volte dei metodi d
Se acquisti questo indicatore, riceverai il mio Trade Manager Professionale + EA  GRATUITAMENTE. Innanzitutto è importante sottolineare che questo sistema di trading è un indicatore Non-Repainting, Non-Redrawing e Non-Lagging, il che lo rende ideale sia per il trading manuale che per quello automatico. Corso online, manuale e download di preset. Il "Sistema di Trading Smart Trend MT5" è una soluzione completa pensata sia per i trader principianti che per quelli esperti. Combina oltre 10 indicat
FX Trend MT5 NG
Daniel Stein
5 (4)
FX Trend NG: La Nuova Generazione di Intelligenza di Trend Multi-Mercato Panoramica FX Trend NG è uno strumento professionale di analisi del trend multi-timeframe e monitoraggio dei mercati. Ti consente di comprendere la struttura completa del mercato in pochi secondi. Invece di passare tra numerosi grafici, puoi identificare immediatamente quali strumenti sono in trend, dove il momentum sta diminuendo e dove esiste un forte allineamento tra i timeframe. Offerta di Lancio – Ottieni FX Trend NG
SignalTech MT5 is a trading system for EURUSD, USDCHF, USDJPY, AUDUSD, NZDUSD, EURJPY, AUDJPY, NZDJPY, CADJPY H2 and H3 Timeframe.  It can generate signals with Buy/Sell Arrows and Pop-Up/Sound Alerts. Each signal has clear Entry and Stop Loss levels, which should be automatically flagged on the chart, as well as potential Targets 1, 2, and 3. The Entry and TP levels are fixed after the trade is taken. The exit level is dynamic. If there are signs of a potential short-term trend reversal, the
Cominciamo con la verità. Nessun indicatore da solo ti renderà profittevole. Se qualcuno ti dice il contrario, ti sta vendendo un sogno. Qualsiasi indicatore che mostra frecce perfette di acquisto/vendita può essere reso impeccabile — basta ingrandire la giusta sezione della storia e catturare solo i trade vincenti. Noi non lo facciamo.  SMC Intraday Formula è uno strumento. Legge la struttura del mercato per te, identifica le zone a più alta probabilità e ti mostra esattamente come appare la t
Presentazione       Quantum Breakout PRO   , l'innovativo indicatore MQL5 che sta trasformando il modo in cui scambi le zone di breakout! Sviluppato da un team di trader esperti con un'esperienza di trading di oltre 13 anni,       Quantum Breakout PRO       è progettato per spingere il tuo viaggio di trading a nuovi livelli con la sua strategia innovativa e dinamica della zona di breakout. Quantum Breakout Indicator ti fornirà frecce di segnalazione sulle zone di breakout con 5 zone target di
Grabber System MT5
Ihor Otkydach
4.83 (23)
Ti presento un eccellente indicatore tecnico: Grabber, che funziona come una strategia di trading "tutto incluso", pronta all’uso. In un solo codice sono integrati strumenti potenti per l’analisi tecnica del mercato, segnali di trading (frecce), funzioni di allerta e notifiche push. Ogni acquirente di questo indicatore riceve anche gratuitamente: L’utility Grabber: per la gestione automatica degli ordini aperti Video tutorial passo dopo passo: per imparare a installare, configurare e utilizzare
Meravith MT5
Ivan Stefanov
5 (1)
Strumento per market maker. Meravith: Analizzerà tutti i timeframe e mostrerà il trend attualmente in corso. Evidenzierà le zone di liquidità (equilibrio dei volumi) dove i volumi rialzisti e ribassisti sono uguali. Mostrerà tutti i livelli di liquidità dei diversi timeframe direttamente sul grafico. Genererà e presenterà un’analisi di mercato testuale a scopo di riferimento. Calcolerà obiettivi, livelli di supporto e punti di stop-loss in base al trend attuale. Calcolerà il rapporto rischio/ren
Trend Screener Pro MT5
STE S.S.COMPANY
4.85 (104)
Indicatore di tendenza, soluzione unica rivoluzionaria per il trading di tendenze e il filtraggio con tutte le importanti funzionalità di tendenza integrate in un unico strumento! È un indicatore multi-timeframe e multi-valuta al 100% non ridipingibile che può essere utilizzato su tutti i simboli/strumenti: forex, materie prime, criptovalute, indici e azioni. Trend Screener è un indicatore di tendenza che segue un indicatore efficiente che fornisce segnali di tendenza a freccia con punti nel gra
CGE Trading Suite
Carl Gustav Johan Ekstrom
5 (2)
Institutional-Grade Analytics for MT5 C GE Trading Suite delivers the analytical edge typically reserved for professional trading desks. The platform integrates a full suite of analytical tools into one seamless workflow: dynamic grid mapping, liquidity behavior analysis, ECM, trend lines, MIDAS, trade cycles, and directional channel projections. Together, these provide a unified view of market structure and momentum. Directional clarity is further enhanced by the capital flow index, which meas
Scopri quale strategia funziona davvero sul tuo simbolo - prima di rischiare denaro reale. Power Bar rileva le barre di prezzo estreme su qualsiasi simbolo e qualsiasi timeframe, poi esegue istantaneamente il backtest di 3 diverse strategie di trading per confrontare tassi di vincita, fattori di profitto e P&L fianco a fianco. Tutto in un unico pannello interattivo. Niente supposizioni. Niente curve-fitting. Solo dati. Cosa rende Power Bar unico? La maggior parte degli indicatori fornisce un se
Btmm state engine pro
Garry James Goodchild
5 (4)
BTMM State Engine Pro is a MetaTrader 5 indicator for traders who use the Beat The Market Maker approach: Asian session context, kill zone timing, level progression, peak formation detection, and a multi-pair scanner from a single chart. It combines cycle state logic with a built-in scanner dashboard so you do not need the same tool on many charts at once. What it does Draws the Asian session range; session times can follow broker server offset or be set in inputs. Tracks level progression (L
Atomic Analyst MT5
Issam Kassas
3.94 (31)
Innanzitutto, vale la pena sottolineare che questo indicatore di trading non è repaint, non è ridisegno e non presenta ritardi, il che lo rende ideale sia per il trading manuale che per quello automatico. Manuale utente: impostazioni, input e strategia. L'Analista Atomico è un indicatore di azione del prezzo PA che utilizza la forza e il momentum del prezzo per trovare un miglior vantaggio sul mercato. Dotato di filtri avanzati che aiutano a rimuovere rumori e segnali falsi, e aumentare il pote
FX Power MT5 NG
Daniel Stein
5 (31)
FX Power: Analizza la Forza delle Valute per Decisioni di Trading Più Intelligenti Panoramica FX Power è lo strumento essenziale per comprendere la reale forza delle principali valute e dell'oro in qualsiasi condizione di mercato. Identificando le valute forti da comprare e quelle deboli da vendere, FX Power semplifica le decisioni di trading e rivela opportunità ad alta probabilità. Che tu segua le tendenze o anticipi inversioni utilizzando valori estremi di Delta, questo strumento si adatta
OmniSync Projection
Antonio-alin Teculescu
5 (1)
Chronos Fractal Engine is an innovative price projection indicator for MetaTrader 5, designed to transform your technical analysis by intelligently identifying and projecting historical price patterns. Built upon an advanced correlation algorithm and the fractal principles of the market, this powerful tool visualizes potential future price movements, giving you a unique edge in your trading decisions. What is Chronos Fractal Engine? At its core, the Chronos Fractal Engine employs a sophisticat
Bill Williams Advanced
Siarhei Vashchylka
5 (11)
Bill Williams Advanced is designed for automatic chart analysis using Bill Williams' "Profitunity" system. The indicator analyzes four timeframes at once. Manual (Be sure to read before purchasing) Advantages 1. Analyzes the chart using Bill Williams' "Profitunity" system. Signals are displayed in a table in the corner of the screen and on the price chart. 2. Finds all known AO and AC signals, as well as zone signals. Equipped with a trend filter based on the Alligator. 3. Finds "Divergence Bar
Berma Bands
Muhammad Elbermawi
5 (8)
L'indicatore Berma Bands (BBs) è uno strumento prezioso per i trader che cercano di identificare e capitalizzare i trend di mercato. Analizzando la relazione tra il prezzo e le BBs, i trader possono discernere se un mercato è in una fase di trend o di range. Visita il [ Berma Home Blog ] per saperne di più. Le Berma Bands sono composte da tre linee distinte: la Upper Berma Band, la Middle Berma Band e la Lower Berma Band. Queste linee sono tracciate attorno al prezzo, creando una rappresentazion
Market Structure Order Block Dashboard MT5 è un indicatore MT5 progettato per i trader che vogliono leggere la struttura di mercato e le principali zone di reazione del prezzo direttamente sul grafico. Combina BOS, ChoCH, Order Blocks, Fair Value Gaps (FVG), Liquidità, Kill Zones, Volume Profile e un pannello compatto per un'analisi rapida. Questo indicatore è rivolto ai trader che utilizzano la struttura di mercato, i concetti ICT e Smart Money come quadro decisionale. Può aiutare a individuare
Auto Optimized Parabolic RSI: Motore di Momentum 3D Avanzato La maggior parte degli indicatori per trader privati fallisce perché si affida a parametri statici che smettono di funzionare nel momento in cui la volatilità del mercato cambia. Auto Optimized Parabolic RSI risolve il problema dell'"obsolescenza dell'indicatore" ricalcolando continuamente il proprio vantaggio matematico, portando un adattamento quantitativo di livello istituzionale direttamente sul tuo terminale MT5. Il Vantaggio Prin
Crystal Heikin Ashi Signals
Muhammad Jawad Shabir
5 (2)
Crystal Heikin Ashi Signals - Professional Trend & Signal Detection Indicator Advanced Heikin Ashi Visualization with Intelligent Signal System for Manual & Automated Trading Final Price: $149 ---------> Price goes up $10 after every 10 sales . Limited slots available — act fast . Overview Crystal Heikin Ashi Signals is a professional-grade MetaTrader 5 indicator that combines pure Heikin Ashi candle visualization with an advanced momentum-shift detection system. Designed for both manual traders
Meridian Pro
Ottaviano De Cicco
5 (1)
Meridian Pro: Professional Multi-Timeframe Trend Matrix for MT5 Overview Meridian Pro is a multi-timeframe trend matrix by Merkava Labs that compresses directional state, strength, momentum condition and matrix agreement into one compact panel. One adaptive engine, applied consistently from M1 to W1. No per-symbol tuning. No indicator stacking. One structured readout across every asset and every timeframe. Launch Offer — Get Meridian Pro for USD 99 (introductory). Regular price: USD 149. 1. Why
FX Levels MT5
Daniel Stein
5 (13)
FX Levels: Supporti e Resistenze di Precisione Eccezionale per Tutti i Mercati Panoramica Rapida Cercate un modo affidabile per individuare livelli di supporto e resistenza in ogni mercato—coppie di valute, indici, azioni o materie prime? FX Levels fonde il metodo tradizionale “Lighthouse” con un approccio dinamico all’avanguardia, offrendo una precisione quasi universale. Basato sulla nostra esperienza reale con i broker e su aggiornamenti automatici giornalieri più quelli in tempo reale, FX
Altri dall’autore
Vertical Volume
Kim Yonghwa
4.8 (5)
Caratteristiche Indicatore per verificare il volume per prezzo. Funziona principalmente per EURUSD, su altre coppie di valute potrebbe non funzionare o il calcolo potrebbe richiedere molto tempo. Per un uso fluido, attivare l'opzione "Sposta il confine della fine del grafico dal margine destro", come mostrato nello screenshot. Quando appare una nuova barra, i dati vengono reimpostati. Variabili COlOR: Impostazione del colore dell'indicatore WIDTH: Impostazione della larghezza dell'indicatore
FREE
Filtro:
AltosT
90
AltosT 2025.07.09 04:32 
 

Nice indicator. Would be even better if it could be shown or vanished with a button click.

Lydia Kwarteng
2220
Lydia Kwarteng 2025.06.12 11:44 
 

L'utente non ha lasciato alcun commento sulla valutazione.

Benjamin Afedzie
3863
Benjamin Afedzie 2025.06.11 19:11 
 

great work

w.martins
14
w.martins 2025.02.25 14:31 
 

It is a great indicator for traders using Fibo. However, alerts, even if disabled, still continue to appear in the notification. I've tried several ways to get it off on MT5. But without success. Still, I use it every day. I'm grateful.

DDDD7777777PPPP
104
DDDD7777777PPPP 2025.02.12 19:44 
 

Bom!

Irusel
704
Irusel 2024.10.29 21:25 
 

Отличный

James Erasmus
2947
James Erasmus 2024.08.13 11:30 
 

Nice but limited, only shows current day. Could run simulator for test. Nice sharing this indicator, try ftu fibonacci

znshshi
82
znshshi 2024.06.24 13:19 
 

L'utente non ha lasciato alcun commento sulla valutazione.

Seth Tetteh
2508
Seth Tetteh 2024.04.25 12:21 
 

good

GG61251
44
GG61251 2024.04.09 19:07 
 

alles bestens, danke

Calogero Vella
592
Calogero Vella 2024.03.21 09:25 
 

Thank you for this. i can make good use of it.

mynlife73
34
mynlife73 2023.11.23 08:51 
 

A very cool indicator, I would take money for it

dany007
48
dany007 2023.09.08 21:14 
 

very useful and handy indicator.

Ruhail Ashraf Khan
631
Ruhail Ashraf Khan 2023.05.19 08:03 
 

Super

Rispondi alla recensione