SMC Structure Markup

4.75

Overview

The Smart Money Structure Markup Indicator for MetaTrader 5 is a powerful tool designed to help traders identify key market structures based on popular Smart Money Concepts (SMC) strategies. This indicator detects micro-market structures, providing insights into price movements and potential trend changes. It highlights important elements such as valid Break of Structure (BOS), Change of Character (CHoCH), and Inducement (IDM), helping traders to make informed decisions.

Key Features

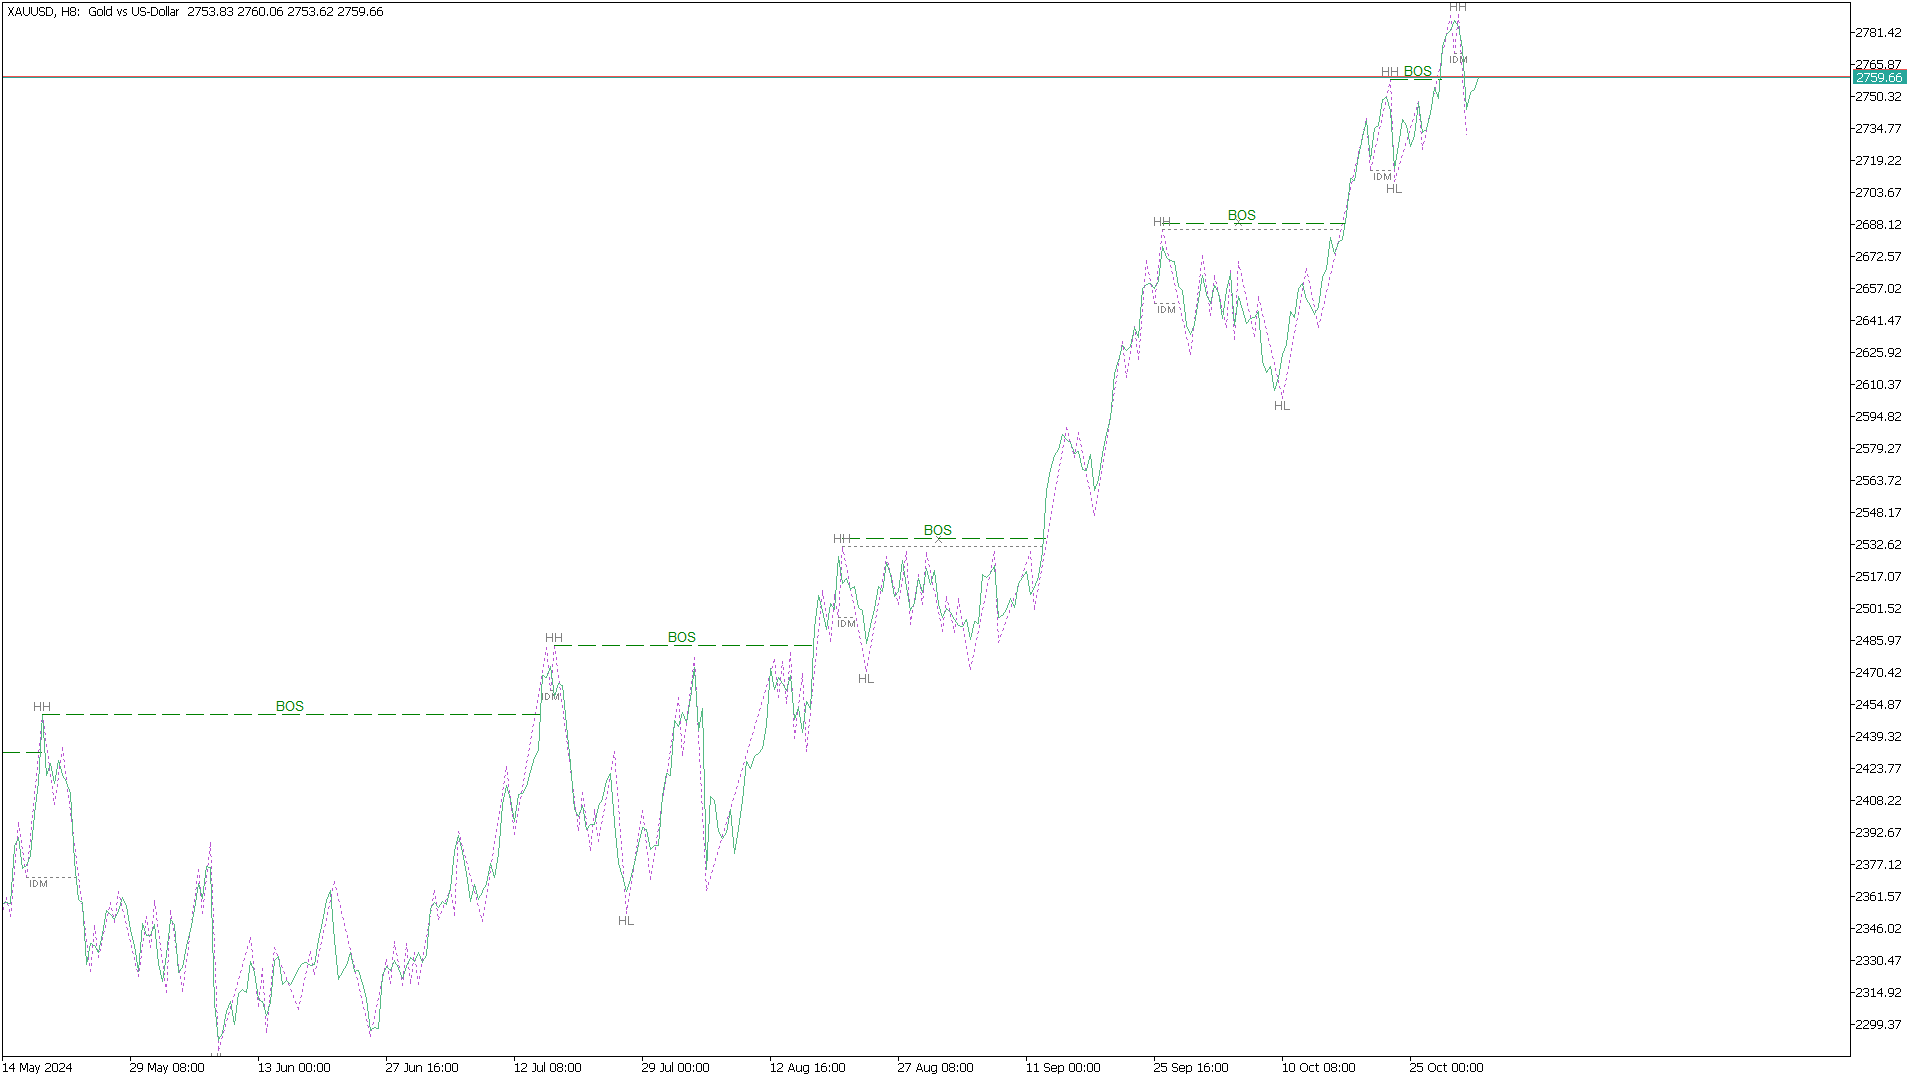
  1. Market Structure Analysis

    • The indicator automatically identifies and labels essential elements of market structure, including:
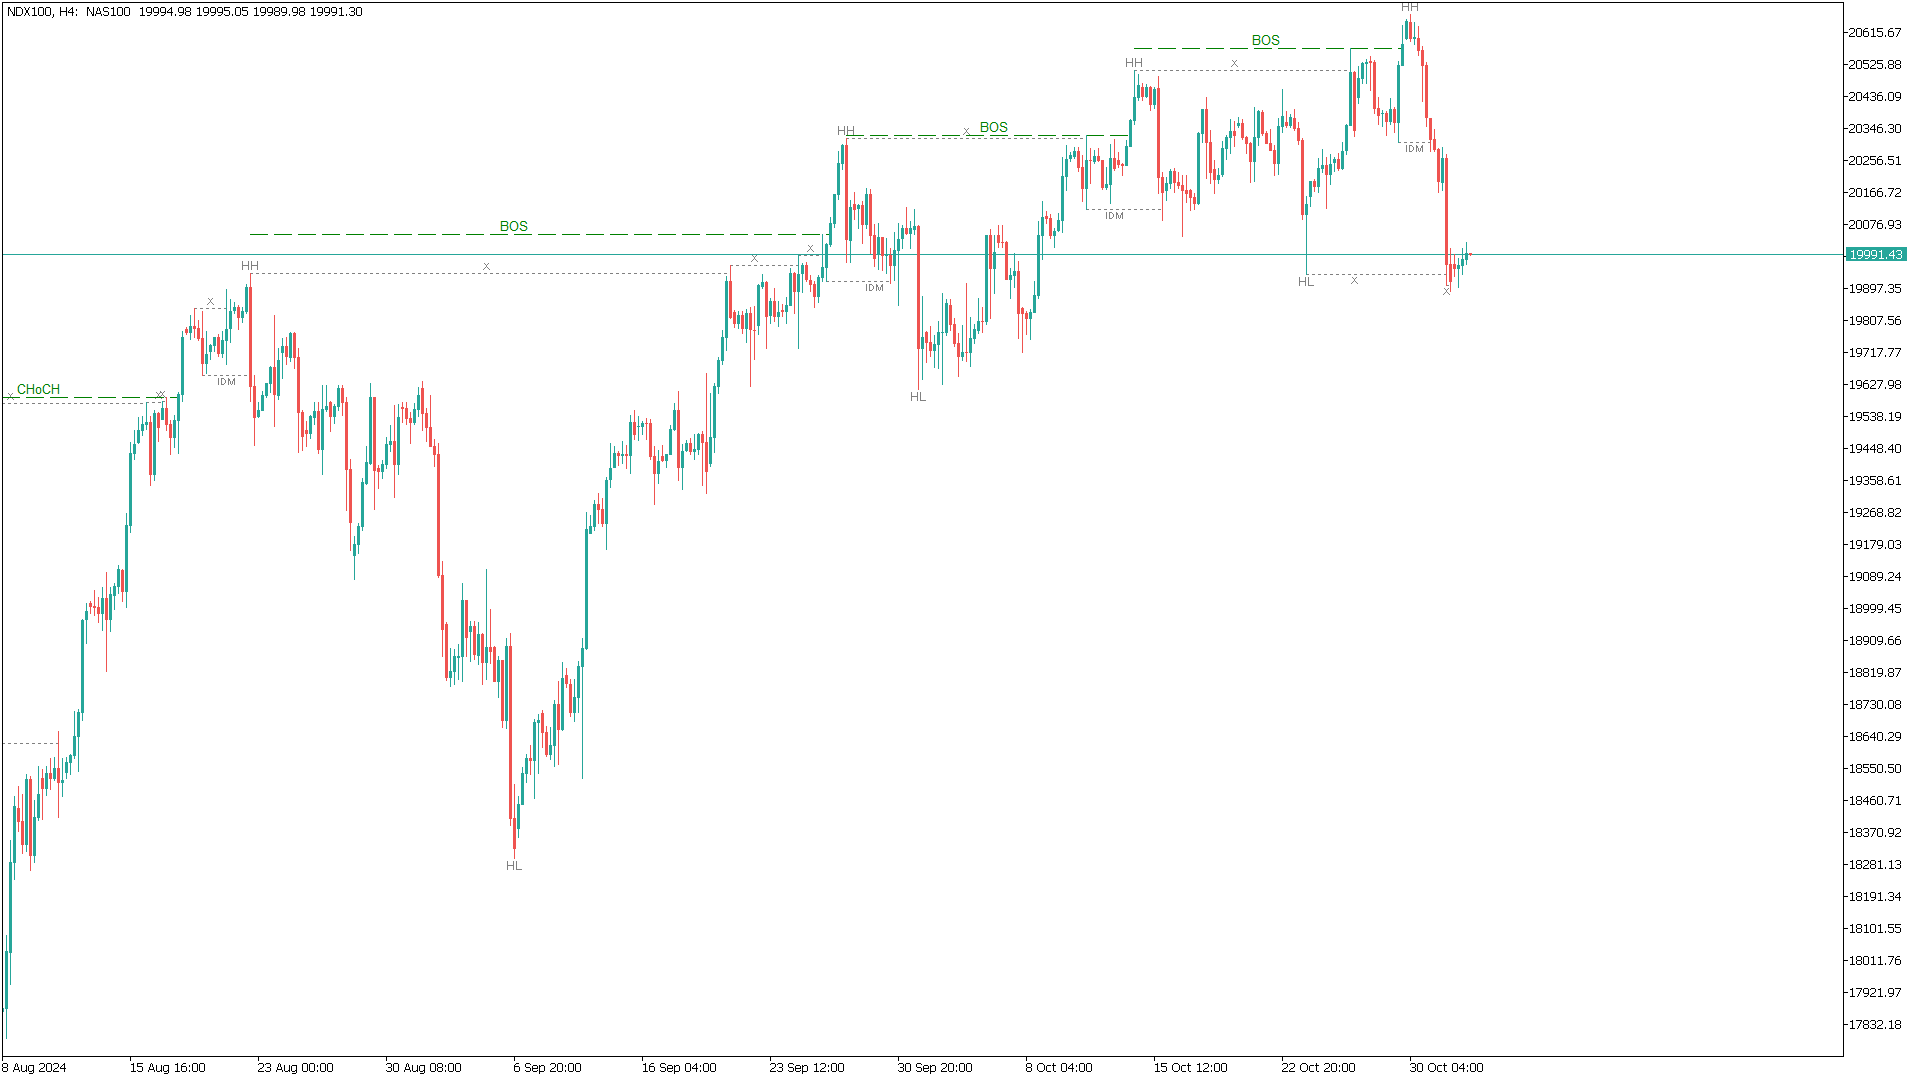
      • Break of Structure (BOS): Detected when there is a significant price movement breaking previous structural points.
      • Change of Character (CHoCH): Identifies potential trend reversals, marked by a shift in price direction.
      • Inducement (IDM): Shows pullback points in the trend, highlighting possible retracement zones.
  2. Definition of BOS and CHoCH

    • A valid BOS or CHoCH is marked when a candle closes at a specific price level, followed by a retracement to the last valid pullback (IDM). This confirmation method enhances the accuracy of each structure's signal, allowing traders to rely on clear and validated structural changes.
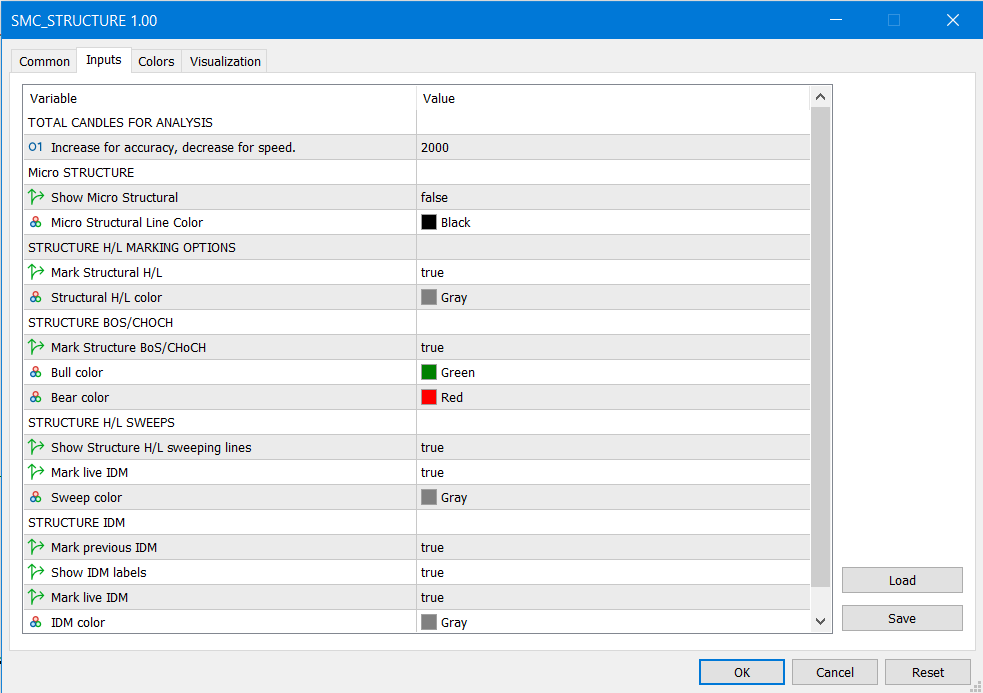
  3. Customizable Settings Panel

    • The indicator features a comprehensive settings panel, allowing users to adjust parameters according to their trading style and preference. You can modify settings related to BOS, CHoCH, IDM, display preferences, color schemes, and more, tailoring the indicator to suit any trading strategy.

How to Use

  1. Setting Up the Indicator

    • Load the indicator onto your chart and adjust the settings based on your desired market structure sensitivity and visibility.
  2. Interpreting the Signals

    • Break of Structure (BOS): Indicates a continuation of the current trend. Use BOS signals to confirm the trend direction and plan entries or exits.
    • Change of Character (CHoCH): Signals potential trend reversals. CHoCH markers are particularly useful for spotting shifts in the market, helping to adjust trading strategies.
    • Inducement (IDM): Highlights pullbacks, which can serve as potential entry points after a trend continuation or reversal.
  3. Customization for Flexibility

    • Use the settings panel to adjust line styles, colors, and other parameters to suit your trading strategy. With these adjustments, you can emphasize certain elements or fine-tune the indicator to identify specific structural patterns in various market conditions.


Avis 16
Benjamin Afedzie
3392
Benjamin Afedzie 2025.06.11 18:59 
 

works for me

SACABOLLOS TIN
58
SACABOLLOS TIN 2025.03.09 23:22 
 

Es un excelente indicador, me ayuda mucho en mis lecturas de rangos en el precio. Mucha gracias por tu aporte.

nitin atpadkar
27
nitin atpadkar 2025.02.25 10:43 
 

how too gret job sir

Produits recommandés
VWAP Indicator
LUC JACOBUS A VERHEECKE
4.2 (25)
Volume Weighted Average Price (VWAP) The volume weighted average price (VWAP) is a  trading   benchmark  used by traders that gives the average price a security has traded at throughout the day, based on both volume and price. It is important because it provides traders with insight into both the trend and value of a security. This indicator VWAP V2 is free and is the manual version of the extended Easy VWAP indicator (30 Euro), where the date and time properties are automatically entered. With
FREE
VWAP Simple
Deibson Carvalho
4.24 (29)
The Volume Weighted Average Price is similar to a moving average, except volume is included to weight the average price over a period.    Volume-Weighted Average Price [VWAP] is a dynamic, weighted average designed to more accurately reflect  a security’s true average price over a given period . Mathematically, VWAP is the summation of money (i.e., Volume x Price) transacted divided by the total volume over any time horizon, typically from market open to market close. VWAP reflects the capitali
FREE
HTF Vision
Nindita Giwangkara
5 (1)
HTF Vision - Higher Timeframe Candle Display Free now, celebrating release of Live Chart Viewer utility  https://www.mql5.com/en/market/product/158488 HTF Vision provides traders with an intuitive way to visualize higher timeframe price action directly on their current chart. This powerful indicator overlays candlestick data from selected higher timeframes (H1, H4, or Daily) as customizable boxes, giving you instant context of larger market movements without switching charts. Key Features: Mult
FREE
Stackable VWAP
Flavio Javier Jarabeck
3.5 (4)
Volume Weighted Average Price (VWAP) is a trading benchmark commonly used by Big Players that gives the average price a Symbol has traded throughout the day. It is based on both Volume and price. Additionally we put in this indicator the MVWAP (Moving Volume Weighted Average Price). For those who do not know the usage and the importance od this indicator I recommend a great article about this subject at Investopedia ( https://www.investopedia.com/articles/trading/11/trading-with-vwap-mvwap.asp
FREE
CoioteCandlePVA
Alexandre Moraes De Souza Lima
5 (1)
Candle com coloração de Volume Price Analysis  (VPA) segundo as definições da Anna Coulling, é possível configurar períodos de  climax e rising, fator de extreme e fator de rising. Pode-se usar volume real ou volume de ticks. O VPA considera a variação de preço por volume do período, indicando se um movimento está recebendo ignição, está em seu climax ou se já não existe mais interesse.
FREE
À propos de Range Explosion Range Explosion est un outil de trading puissant et gratuit, conçu pour détecter les zones de range du marché, tracer les supports et résistances, et identifier les opportunités de breakout avec précision. Il fait partie du projet Break Out Explosion, offrant aux traders une solution fiable et visuellement avancée, adaptée aux débutants comme aux professionnels. Si vous êtes intéressé par les concepts de breakout, consultez cet outil avancé qui détecte les cassures de
FREE
Bar Color Trend
Germano Chagas
4.38 (8)
Combining the best of Price Action , Directional Movement , and Divergence/Convergence analysis, Candle Color Trend is a easy and reliable way to identify trend direction. The indicator automatically paints the candles according to the assumption that an uptrend is defined by prices that form a series of higher highs and higher lows. In contrast, a downtrend is defined by prices that form a series of lower highs and lower lows. Additionally, ADX Wilder indicator is used to measure trend weakness
FREE
TilsonT3
Jonathan Pereira
5 (1)
Tillson's T3 moving average was introduced to the world of technical analysis in the article ''A Better Moving Average'', published in the American magazine Technical Analysis of Stock Commodities. Developed by Tim Tillson, analysts and traders of futures markets soon became fascinated with this technique that smoothes the price series while decreasing the lag (lag) typical of trend-following systems.
FREE
VWAP and MVWAP
Flavio Javier Jarabeck
4.29 (7)
Volume Weighted Average Price (VWAP) is a trading benchmark commonly used by Big Players that gives the average price a Symbol has traded throughout the day. It is based on both Volume and price. Additionally we put in this indicator the MVWAP (Moving Volume Weighted Average Price). For those who do not know the usage and the importance od this indicator I recommend a great article about this subject at Investopedia ( https://www.investopedia.com/articles/trading/11/trading-with-vwap-mvwap.asp )
FREE
Quarter EMA
Jithin Sajan Sajan
5 (2)
Kindly rate and comment about the product for upgradation & Support The 5 EMA is plotted in green color ( Lime ). The 14 EMA is plotted in red color ( Red ). The 20 EMA is plotted in blue color ( Blue ). The 200 EMA is plotted in yellow color ( Yellow ). The Quarter EMA that provided calculates and plots four Exponential Moving Averages (EMAs) on the chart using different periods: 5, 14, 20, and 200. Each EMA is represented by a different color on the chart. Here's a description of each EMA:
FREE
Quintet EMA
Jithin Sajan Sajan
Kindly rate and comment about the product for upgradation & Support The   5 EMA   is plotted in   green   color ( Lime ). The  14 EMA  is plotted in  red  color ( Red ). The   20 EMA   is plotted in   blue   color ( Blue ). The  200 EMA  is plotted in  black  color ( Black ). The   200 EMA   is plotted in   yellow   color ( Yellow ). The Quarter EMA that provided calculates and plots four Exponential Moving Averages (EMAs) on the chart using different periods: 5, 14, 20, and 200. Each EMA is
FREE
MIDAS Super VWAP
Flavio Javier Jarabeck
4.4 (10)
Imagine VWAP, MVWAP and MIDAS in one place... Well, you found it! Now you can track the movement of Big Players in various ways, as they in general pursue the benchmarks related to this measuring, gauging if they had good execution or poor execution on their orders. Traders and analysts use the VWAP to eliminate the noise that occurs throughout the day, so they can measure what prices buyers and sellers are really trading. VWAP gives traders insight into how a stock trades for that day and deter
FREE
Indicator Description Range Filter Pro is a sophisticated trading tool for XAUUSD (Gold) that combines adaptive price filtering with volume analysis and real-time market monitoring. Designed for both novice and professional traders, this indicator helps identify trend direction, potential reversals, and significant market movements through its multi-layered approach. Key Components 1.Dynamic Range Filter 2.Volatility-Adjusted Bands 3.Volume-Enhanced Candles 4.Professional Trading Dashboard 5.M
FREE
KVO Indicator
Saullo De Oliveira Pacheco
Klinger Volume Oscillator (KVO) - A Powerful Trend & Momentum Indicator This is an enhanced version of the Klinger Volume Oscillator (KVO) , a widely used indicator designed to help traders identify momentum shifts, trend direction, and overbought/oversold conditions in the market. How the KVO Indicator Works: Volume-Based Trend Identification – Unlike traditional oscillators that rely solely on price movements, the KVO uses both price and volume to detect market trends and momentum shifts .
FREE
TickChart Indicator plots tick line on the main window of MetaTrader. In the Lite version, the number of ticks is limited to 20 and the alert function described below is omitted.  The tick-line shows the most detailed, fastest and real-time activities of the market, which are usually hidden in bars or candles longer than 1 minute. Usually, several new tick-line segments appear while a bar of M1 time frame is completed. After the release of an important economic indicator, the number of ticks per
FREE
Multi-TF Trend Dashboard Short Description / Slogan: See the entire market trend in a single glance! A simple, clean, and powerful dashboard for every trader. Full Description: (1. For Free Distribution) Hello MQL5 Community, I am excited to share the Multi-TF Trend Dashboard , a tool I developed to simplify trend analysis. This indicator is offered completely free as a contribution to this amazing community. (2. Indicator's Functionality) Are you tired of constantly switching between timeframe
FREE
RSI Chart Levels
Nikolay Mitrofanov
The indicator draws levels based on the overbought and oversold values ​​of the RSI indicator. The maximum values ​​are taken into account, which are equal to or exceeded certain limits. That is, for example, when the price has gone into the overbought zone, the highest price is selected from all prices in this zone for this period of time, and as soon as the indicator value returns to a value below the overbought value, the level is fixed and the calculation of new values ​​begins. The same
Midas VWAP
Paulo Henrique Faquineli Garcia
4 (2)
Volume Weighted Average Price (VWAP) is a trading benchmark commonly used by Big Players that gives the average price a Symbol has traded throughout the day. It is based on both Volume and price. This indicator contains Daily VWAP and MIDAS' VWAP, which means you are able to anchor the beggining of MIDAS' calculations and, therefore you will be able to use this methodology to study price versus volume moves after anchor point. You will be able to anchor up to 3 HIGH MIDAS VWAP's and 3 LOW. Wish
FREE
QuantumAlert RSI Navigator is a free indicator available for MT4/MT5 platforms, its work is to provide "alerts" when the market is inside "overbought and oversold" regions in the form of "buy or sell" signals. This indicator comes with many customization options mentioned in the parameter section below, user can customise these parameters as needful. Join our MQL5 group , where we share important news and updates. You are also welcome to join our private channel as well, contact me for the priva
FREE
Custom Candle – Multi-Timeframe Visualization Analyzing multiple timeframes is essential for accurate trading decisions, but switching between charts can be inconvenient and inefficient. The Custom Candle indicator solves this problem by overlaying higher-timeframe (HTF) candles directly onto your lower-timeframe (LTF) chart. This allows you to see the bigger picture at a glance, align with the higher trend, and improve trade accuracy—without leaving your current chart. Key Features Multi-Timefr
FREE
Value Chart Candlesticks
Flavio Javier Jarabeck
4.69 (13)
The idea of a Value Chart indicator was presented in the very good book I read back in 2020 , " Dynamic Trading Indicators: Winning with Value Charts and Price Action Profile ", from the authors Mark Helweg and David Stendahl. The idea is simple and the result is pure genius: Present candlestick Price analysis in a detrended way! HOW TO READ THIS INDICATOR Look for Overbought and Oversold levels. Of course, you will need to test the settings a lot to find the "correct" one for your approach. It
FREE
Equidistant bands indicator with calculated moving average, allows you to configure the band size and can be used freely as an entry / exit indicator. Buffer 0 = price, buffer 1 = upper band, buffer 2 = lower band. you can also configure the periods of moving averages used in the calculations and also the shift to previous bars in addition to the price that can CLOSE (default) or OPEN. Excellent for fast daily moving pairs and frequent returns.
FREE
Daily VWAP
Riccardo Moreo
4.75 (4)
This is the Volume Avarage Weighted Price (VWAP) it's a indicator that shows where is the avarage of the current volumes and the levels at which the price is considered premium, above the second upper band, or discount, under the second lower band, it's also very usefull to use the VWAP level as a target for operations since it's a very liquid level so the price it's attracted to it. feel free to leave a feedback either positive or negative based on your expereince with this indicator, enjoy the
FREE
QuantumAlert Stoch Navigator is a free indicator available for MT4/MT5 platforms, its work is to provide "alerts" when the market is inside "overbought and oversold" regions in the form of "buy or sell" signals. This indicator comes with many customization options mentioned in the parameter section below, user can customise these parameters as needful. Join our   MQL5 group , where we share important news and updates. You are also welcome to join our private channel as well, contact me for the p
FREE
FT ADX Color Candles
FELIPE MISAEL MORAES KRUGER
5 (7)
Trading can be quite tiring when you need to look at several things at the same time. Format of candles, supports, resistances, schedules, news and indicators. This tool aims to facilitate the analysis of the ADX indicator. It colors the candles based on the levels of the indicator and the DI lines. The period, the limit of the indicator and the colors of the candles are customizable. You can also place a visual aid on the lower right side of the graph to view the values of ADX, DI + and DI-
FREE
Donchian Pro
Paulo Henrique Faquineli Garcia
5 (3)
The Donchian Channel Channels are among the most popular tools of technical analysis, as they visually convey to the analyst the limits within which most price movement tends to occur. Channel users know that valuable information can be obtained at any time, whether prices are in the central region of a band or close to one of the border lines. One of the best known techniques to explore these concepts is Bollinger Bands. However, John Bollinger was not the only one to research the application
FREE
Basic Vwap
james mugendi
4 (1)
Simple Vwap with the daily, weekly and monthly VWAP is the abbreviation for   volume-weighted average price , which is a technical analysis tool that shows the ratio of an asset's price to its total trade volume. It provides traders and investors with a measure of the average price at which a stock is traded over a given period of time. How it's used Identify entry and exit points:   Traders can use VWAP to determine when to buy or sell an asset.   Understand price trends :  Traders can use V
FREE
Super Trend eu
Emin Ulucanli
4.8 (5)
SUPERTREND ; C'est un indicateur de suivi de tendance basé sur l'ATR SuperTrend créé par Olivier Seban. Il peut être utilisé pour détecter les changements de direction de la tendance et localiser les arrêts. Lorsque le prix tombe en dessous de la courbe indicatrice, il devient rouge et indique une tendance à la baisse. À l'inverse, lorsque le prix se déplace au-dessus de la courbe, l'indicateur passe au vert, indiquant une tendance haussière. Comme d'autres indicateurs, il fonctionne bien sur Su
FREE
The indicator highlights the points that a professional trader sees in ordinary indicators. VisualVol visually displays different volatility indicators on a single scale and a common align. Highlights the excess of volume indicators in color. At the same time, Tick and Real Volume, Actual range, ATR, candle size and return (open-close difference) can be displayed. Thanks to VisualVol, you will see the market periods and the right time for different trading operations. This version is intended f
FREE
Les acheteurs de ce produit ont également acheté
Si vous achetez cet indicateur, vous recevrez mon Gestionnaire de Trading Professionnel + EA  GRATUITEMENT. Tout d'abord, il convient de souligner que ce système de trading est un indicateur non repeint, non redessiné et non retardé, ce qui le rend idéal pour le trading manuel et automatisé. Cours en ligne, manuel et téléchargement de préréglages. Le "Système de Trading Smart Trend MT5" est une solution de trading complète conçue pour les traders débutants et expérimentés. Il combine plus de 10
Divergence Bomber
Ihor Otkydach
4.99 (77)
Chaque acheteur de cet indicateur reçoit également gratuitement : L’outil exclusif « Bomber Utility », qui accompagne automatiquement chaque opération de trading, fixe les niveaux de Stop Loss et de Take Profit, et clôture les positions selon les règles de la stratégie Des fichiers de configuration (set files) pour adapter l’indicateur à différents actifs Des set files pour configurer le Bomber Utility selon différents modes : « Risque Minimum », « Risque Équilibré » et « Stratégie d’Attente » U
Gold Sniper Scalper Pro
Ich Khiem Nguyen
5 (4)
Gold Sniper Scalper Pro - Système de Trading d'Or (XAU/USD) sur MetaTrader 5 Pour le trader sérieux: Abordez le trading d'Or avec une méthodologie structurée et axée sur les données, combinant plusieurs facteurs d'analyse de marché. Cet outil est conçu pour soutenir votre analyse du trading d'Or. Opportunité de Prix Limitée C'est une chance de posséder Gold Sniper Scalper Pro avant que le prix n'augmente.  Le prix du produit augmentera de $50 après chaque série de 10 achats subséquents. Prix Fi
Entry In The Zone and SMC Multi Timeframe est un outil d’analyse de marché en temps réel développé sur la base des Smart Money Concepts (SMC). Il est conçu pour aider les traders à analyser la structure du marché de manière systématique et à obtenir une vision plus claire de la direction globale du marché. Le système analyse automatiquement les Points de Retournement, les Zones Clés et la Market Structure sur plusieurs unités de temps, tout en affichant les Points of Interest (POI), les signaux
ARIPoint
Temirlan Kdyrkhan
1 (1)
ARIPoint is a powerful trading companion designed to generate high-probability entry signals with dynamic TP/SL/DP levels based on volatility. Built-in performance tracking shows win/loss stats, PP1/PP2 hits, and success rates all updated live. Key Features: Buy/Sell signals with adaptive volatility bands Real-time TP/SL/DP levels based on ATR Built-in MA Filter with optional ATR/StdDev volatility Performance stats panel (Success, Profit/Loss, PP1/PP2) Alerts via popup, sound, push, or email Cu
Atomic Analyst MT5
Issam Kassas
4.31 (26)
Tout d'abord, il convient de souligner que cet indicateur de trading n'est ni repainting, ni redrawing et ne présente aucun délai, ce qui le rend idéal à la fois pour le trading manuel et automatisé. Manuel de l'utilisateur : réglages, entrées et stratégie. L'Analyste Atomique est un indicateur d'action sur les prix PA qui utilise la force et le momentum du prix pour trouver un meilleur avantage sur le marché. Équipé de filtres avancés qui aident à éliminer les bruits et les faux signaux, et à
FX Power MT5 NG
Daniel Stein
5 (28)
FX Power : Analysez la force des devises pour des décisions de trading plus intelligentes Aperçu FX Power est l'outil essentiel pour comprendre la force réelle des principales devises et de l'or, quelles que soient les conditions du marché. En identifiant les devises fortes à acheter et les faibles à vendre, FX Power simplifie vos décisions de trading et révèle des opportunités à forte probabilité. Que vous suiviez les tendances ou anticipiez les retournements à l'aide de valeurs extrêmes de D
Smart Stop Indicator – Précision intelligente du stop-loss directement sur votre graphique Présentation Smart Stop Indicator est la solution idéale pour les traders qui souhaitent placer leur stop-loss de manière claire et méthodique, sans deviner ni suivre leur intuition. Cet outil combine la logique classique de price action (succession de plus hauts et de plus bas) avec une reconnaissance moderne des cassures pour identifier le prochain niveau de stop réellement logique. Que le marché soit
Game Changer est un indicateur de tendance révolutionnaire, conçu pour être utilisé sur tout instrument financier et transformer votre MetaTrader en un puissant analyseur de tendances. L'indicateur ne se redessine pas et est sans latence. Il fonctionne sur n'importe quelle unité de temps et facilite l'identification des tendances, signale les retournements potentiels, agit comme un stop suiveur et fournit des alertes en temps réel pour une réaction rapide du marché. Que vous soyez un trader expé
Trend Screener Pro MT5
STE S.S.COMPANY
4.84 (99)
Indicateur de tendance, solution unique révolutionnaire pour le trading et le filtrage des tendances avec toutes les fonctionnalités de tendance importantes intégrées dans un seul outil ! Il s'agit d'un indicateur multi-période et multi-devises 100 % non repeint qui peut être utilisé sur tous les symboles/instruments : forex, matières premières, crypto-monnaies, indices et actions. Trend Screener est un indicateur de suivi de tendance efficace qui fournit des signaux de tendance fléchés avec des
SynaptixQuant Dominance Matrix
Devie Arevalo Montemayor
5 (1)
SynaptixQuant Dominance Matrix: Institutional-Grade Market State Extraction Engineered for traders who require a data-driven view of market behaviour beyond surface-level indicators. The Synaptix Quant (SQ) Dominance Matrix is not a conventional currency strength display. Behind its intentionally streamlined interface runs a sophisticated analytical architecture designed to quantify market conditions with precision. Every output is generated through layered signal processing built to identify d
Grabber System MT5
Ihor Otkydach
4.79 (19)
Je vous présente un excellent indicateur technique : Grabber, qui fonctionne comme une stratégie de trading "tout-en-un", prête à l'emploi. En un seul code sont intégrés des outils puissants d'analyse technique du marché, des signaux de trading (flèches), des fonctions d'alerte et des notifications push. Chaque acheteur de cet indicateur reçoit également gratuitement : L'utilitaire Grabber : pour la gestion automatique des ordres ouverts Un guide vidéo étape par étape : pour apprendre à installe
Quantum TrendPulse
Bogdan Ion Puscasu
5 (19)
Présentation de   Quantum TrendPulse   , l'outil de trading ultime qui combine la puissance de   SuperTrend   ,   RSI   et   Stochastic   dans un seul indicateur complet pour maximiser votre potentiel de trading. Conçu pour les traders qui recherchent précision et efficacité, cet indicateur vous aide à identifier les tendances du marché, les changements de dynamique et les points d'entrée et de sortie optimaux en toute confiance. Caractéristiques principales : Intégration SuperTrend :   suivez f
- Real price is 80$ - 45% Discount (It is 45$ now) Contact me for extra bonus   indicator, instruction or any questions! - Lifetime update free - Non-repaint - Related product: Gann Gold EA - I just sell my products in Elif Kaya Profile, any other websites are stolen old versions, So no any new updates or support. Advantages of  M1 Scalper Pro  Profitability: M1 Scalper Pro is highly profitable with a strict exit strategy. Frequent Opportunities: M1 Scalper Pro  takes advantage of numerous smal
Tout d'abord, il convient de souligner que cet outil de trading est un indicateur non repeint, non redessiné et non retardé, ce qui le rend idéal pour le trading professionnel. Cours en ligne, manuel utilisateur et démonstration. L'indicateur Smart Price Action Concepts est un outil très puissant à la fois pour les nouveaux et les traders expérimentés. Il regroupe plus de 20 indicateurs utiles en un seul, combinant des idées de trading avancées telles que l'analyse du trader Inner Circle et le
Trend indicator AI mt5
Ramil Minniakhmetov
5 (12)
L'indicateur Trend Ai est un excellent outil qui améliorera l'analyse du marché d'un trader en combinant l'identification des tendances avec des points d'entrée exploitables et des alertes d'inversion. Cet indicateur permet aux utilisateurs de naviguer dans les complexités du marché forex avec confiance et précision Au-delà des signaux primaires, l'indicateur Trend Ai identifie les points d'entrée secondaires qui surviennent lors des retraits ou des retracements, permettant aux traders de capit
FX Volume MT5
Daniel Stein
4.79 (24)
FX Volume : Découvrez le Sentiment du Marché tel que perçu par un Courtier Présentation Rapide Vous souhaitez faire passer votre approche de trading au niveau supérieur ? FX Volume vous fournit, en temps réel, des informations sur la manière dont les traders particuliers et les courtiers sont positionnés—bien avant la publication de rapports retardés comme le COT. Que vous visiez des gains réguliers ou recherchiez simplement un avantage plus solide sur les marchés, FX Volume vous aide à repére
TPSproTREND PrO MT5
Roman Podpora
4.72 (18)
Achetez TREND PRO maintenant et obtenez gratuitement un autre indicateur de tendance avancé Pour recevoir, écrivez en messages privés. VERSION MT4        —        ИНСТРУКЦИЯ RUS           —        INSTRUCTIONS  ENG Fonctions principales : Signaux d'entrée précis SANS RENDU ! Si un signal apparaît, il reste d’actualité ! Il s'agit d'une différence importante par rapport aux indicateurs de redessinage, qui peuvent fournir un signal puis le modifier, ce qui peut entraîner une perte de fonds en d
Top indicator for MT5   providing accurate signals to enter a trade without repainting! It can be applied to any financial assets:   forex, cryptocurrencies, metals, stocks, indices .  Watch  the video  (6:22) with an example of processing only one signal that paid off the indicator! MT4 version is here It will provide pretty accurate trading signals and tell you when it's best to open a trade and close it. Most traders improve their trading results during the first trading week with the help of
Combien de fois avez-vous acheté un indicateur de trading avec d' excellents backtests, des preuves de performance sur compte réel avec des chiffres fantastiques et des statistiques partout , mais après l'avoir utilisé, vous finissez par faire sauter votre compte ? Vous ne devriez pas faire confiance à un signal seul, vous devez savoir pourquoi il est apparu en premier lieu, et c'est ce que RelicusRoad Pro fait de mieux ! Manuel d'utilisation + Stratégies + Vidéos de formation + Groupe privé ave
TrendLine PRO MT5
Evgenii Aksenov
4.67 (33)
L'indicateur   Trend Line PRO   est une stratégie de trading indépendante. Il montre le changement de tendance, le point d'entrée de la transaction, ainsi que le calcul automatique de trois niveaux de protection Take Profit et Stop Loss. Trend Line PRO   est parfait pour tous les symboles Meta Trader : devises, métaux, crypto-monnaies, actions et indices. L'indicateur est utilisé dans le trading sur des comptes réels, ce qui confirme la fiabilité de la stratégie. Pour le moment, l'indicateur
Market Structure Patterns
Samuel Manoel De Souza
4.47 (19)
Disponible pour   MT4   et   MT5 . Rejoignez le canal Market Structure Patterns pour télécharger des documents d'étude et/ou des informations supplémentaires. Articles connexes : Market Structure Patterns - Introduction Market Structure Patterns   est un indicateur basé sur les   Smart Money Concepts   qui affiche les   éléments SMC/ICT   pouvant améliorer vos décisions de trading. Profitez des   alertes ,   notifications push   et   emails   pour être informé lorsqu’un élément se forme sur le
Atbot
Zaha Feiz
4.62 (55)
AtBot : Comment ça fonctionne et comment l'utiliser ### Comment ça fonctionne L'indicateur "AtBot" pour la plateforme MT5 génère des signaux d'achat et de vente en utilisant une combinaison d'outils d'analyse technique. Il intègre la Moyenne Mobile Simple (SMA), la Moyenne Mobile Exponentielle (EMA) et l'indice de la Plage Vraie Moyenne (ATR) pour identifier les opportunités de trading. De plus, il peut utiliser des bougies Heikin Ashi pour améliorer la précision des signaux. Laissez un avis ap
Easy Buy Sell is a market indicator for opening and closing positions. It becomes easy to track market entries with alerts. It indicates trend reversal points when a price reaches extreme values ​​and the most favorable time to enter the market. it is as effective as a Fibonacci to find a level but it uses different tools such as an algorithm based on ATR indicators and Stochastic Oscillator. You can modify these two parameters as you wish to adapt the settings to the desired period. It cannot
IX Power MT5
Daniel Stein
4.92 (12)
IX Power : Découvrez des insights de marché pour les indices, matières premières, cryptomonnaies et forex Vue d’ensemble IX Power est un outil polyvalent conçu pour analyser la force des indices, matières premières, cryptomonnaies et symboles forex. Tandis que FX Power offre une précision maximale pour les paires de devises en utilisant toutes les données disponibles, IX Power se concentre exclusivement sur les données du symbole sous-jacent. Cela fait de IX Power un excellent choix pour les m
FX Levels MT5
Daniel Stein
5 (12)
FX Levels : Des zones de Support et Résistance d’une Précision Exceptionnelle pour Tous les Marchés Présentation Rapide Vous recherchez un moyen fiable pour déterminer des niveaux de support et résistance dans n’importe quel marché—paires de devises, indices, actions ou matières premières ? FX Levels associe la méthode traditionnelle « Lighthouse » à une approche dynamique de pointe, offrant une précision quasi universelle. Grâce à notre expérience réelle avec des brokers et à des mises à jour
Gold Entry Sniper
Tahir Mehmood
5 (1)
Gold Entry Sniper – Tableau de Bord ATR Multi-Unités de Temps pour Scalping et Swing Trading sur l'Or Gold Entry Sniper est un indicateur avancé pour MetaTrader 5 qui fournit des signaux d'achat/vente précis sur XAUUSD et autres actifs, basé sur la logique de Trailing Stop ATR et l' analyse multi-unités de temps . Caractéristiques et Avantages Clés Analyse Multi-Unités de Temps – Affiche les tendances en M1, M5, M15 sur un seul tableau. Trailing Stop Basé sur l'ATR – Ajuste automatiquement selon
Quantum Trend Sniper
Bogdan Ion Puscasu
4.74 (53)
Présentation       Quantum Trend Sniper Indicator   , l'indicateur révolutionnaire MQL5 qui transforme la façon dont vous identifiez et négociez les inversions de tendance ! Développé par une équipe de traders expérimentés avec une expérience commerciale de plus de 13 ans,       Indicateur Quantum Trend Sniper       est conçu pour propulser votre parcours de trading vers de nouveaux sommets grâce à sa manière innovante d'identifier les inversions de tendance avec une précision extrêmement élevée
Support And Resistance Screener est dans un indicateur de niveau pour MetaTrader qui fournit plusieurs outils à l'intérieur d'un indicateur. Les outils disponibles sont : 1. Filtre de structure de marché. 2. Zone de repli haussier. 3. Zone de recul baissier. 4. Points pivots quotidiens 5. points pivots hebdomadaires 6. Points pivots mensuels 7. Support et résistance forts basés sur le modèle harmonique et le volume. 8. Zones au niveau de la banque. OFFRE D'UNE DURÉE LIMITÉE : L'indicateur de sup
L'indicateur identifie quand une divergence se produit entre le prix et un oscillateur/indicateur. Il identifie à la fois les divergences régulières et cachées. Il dispose d'une option de filtre RSI qui permet de filtrer uniquement les configurations les plus puissantes. L'indicateur offre également des options pour attendre une formation engloutissante, une cassure du canal Donchian ou que le prix croise une moyenne mobile   (voir capture d'écran #3)       pour confirmer la divergence avant de
Plus de l'auteur
MJ Risk Management Tool
Seyed Mohammad Hosseini Hejazi
5 (3)
Overview This Expert Advisor (EA) for MetaTrader 5 is a robust tool designed to optimize money and risk management. It allows users to calculate position sizes based on account balance, desired risk percentage, and trade parameters like stop loss and entry points. Additionally, it offers a clear view of reward-to-risk ratios and allows for the inclusion of broker commission, recalculating data accordingly. Key Features 1. Risk-Based Position Sizing The EA calculates position sizes by taking
FREE
Filtrer:
Kedrov
1149
Kedrov 2025.11.29 10:02 
 

Хороший индикатор - но думать при его использовании - надо!

Joseph Okou
329
Joseph Okou 2025.08.13 09:42 
 

hello its a good indicator would it be possible to get the source code too , caue this aligns with the market strucutre for an algo am trying to make

Seyed Mohammad Hosseini Hejazi
8019
Réponse du développeur Seyed Mohammad Hosseini Hejazi 2025.10.03 17:55
You can buy the source code
90146533
14
90146533 2025.07.18 20:43 
 

muito bom

npd lubdub
40
npd lubdub 2025.07.16 11:32 
 

I was impressed about your job, please send me source code, i will pay

mishaysabelle
14
mishaysabelle 2025.06.15 14:11 
 

why its delay

Lydia Kwarteng
1908
Lydia Kwarteng 2025.06.12 11:36 
 

L'utilisateur n'a laissé aucun commentaire sur la note

Benjamin Afedzie
3392
Benjamin Afedzie 2025.06.11 18:59 
 

works for me

Ekaterina Rachel Keren Brooke
470
Ekaterina Rachel Keren Brooke 2025.04.05 18:29 
 

L'utilisateur n'a laissé aucun commentaire sur la note

SACABOLLOS TIN
58
SACABOLLOS TIN 2025.03.09 23:22 
 

Es un excelente indicador, me ayuda mucho en mis lecturas de rangos en el precio. Mucha gracias por tu aporte.

Kran5
454
Kran5 2025.03.02 02:28 
 

L'utilisateur n'a laissé aucun commentaire sur la note

nitin atpadkar
27
nitin atpadkar 2025.02.25 10:43 
 

how too gret job sir

Muhammad.usama
14
Muhammad.usama 2025.02.09 23:40 
 

BHAI NICE JOB KEEP IT UP

Ainur
43
Ainur 2025.01.14 13:28 
 

very very good

VIKRAM SINGH
21
VIKRAM SINGH 2025.01.03 16:43 
 

Amazing Work I hope Developer Add Other Setting Options Like OB, FVG, Trading Sessions , ETC In NEXT Indicator Version

saleh sayed
60
saleh sayed 2024.12.21 19:26 
 

L'utilisateur n'a laissé aucun commentaire sur la note

Collins M
63
Collins M 2024.11.10 13:24 
 

Amazing indicator. Simple and clean

Répondre à l'avis