Supply Demand levels
- Indicateurs
-
Jan Flodin
 Hello, my name is Jan and I have been developing automated trading tools for the last 9 years. I am originally from Sweden but have lived in the Czech Republic since 2003.
PRODUCTS - Version: 1.2
- Mise à jour: 13 mai 2025
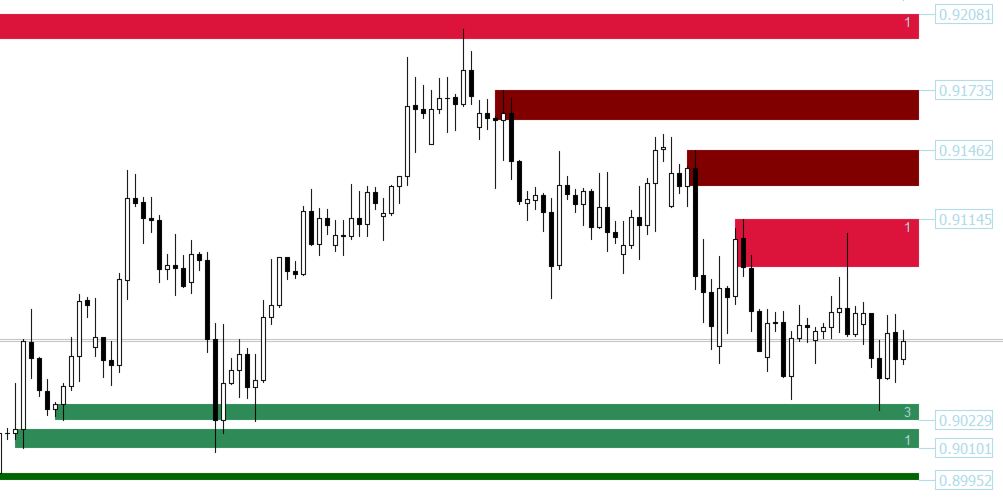
Cet indicateur dessine des zones d'offre et de demande sur le graphique. Associé à vos propres règles et techniques, cet indicateur vous permettra de créer (ou d'améliorer) votre propre système puissant. Veuillez également consulter la version payante qui offre bien plus. Ma recommandation est de rechercher des opportunités de trading où le premier test de zone se produit après au moins 25 barres.
Caractéristiques
- Les zones ont 3 couleurs (réglables par entrée). Couleur foncée pour la zone non testée, moyenne pour la zone testée et claire pour la zone cassée .
- Le prix de la bordure extérieure de la zone ainsi que le montant du test de zone sont inscrits à chaque zone.
Paramètres d'entrée
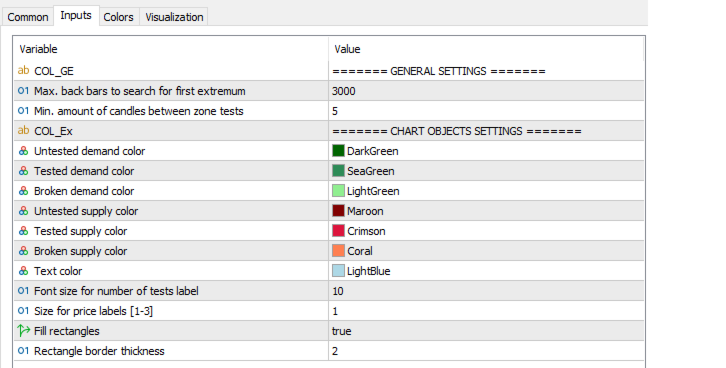
- Max. barres arrière pour rechercher le premier extremum - La valeur par défaut est 3000. Recherche les premières barres extrêmes xx dans le temps. Plus la valeur est élevée, plus les ressources système nécessaires seront importantes . Pour les ordinateurs plus lents, une valeur de 500 à 1000 peut être plus adaptée.
- Nombre minimum de bougies entre les tests de zone
- Couleur de demande non testée
- Couleur de demande testée
- Couleur de demande brisée
- Couleur d'approvisionnement non testée
- Couleur d'approvisionnement testée
- Couleur d'approvisionnement cassée
- Couleur du texte
- Taille de police pour l'étiquette du nombre de tests
- Taille des étiquettes de prix [1-3]


отлично