ZigZag Dashboard for MT4
- Indicadores
- Versión: 6.40
- Actualizado: 17 junio 2026
- Activaciones: 10

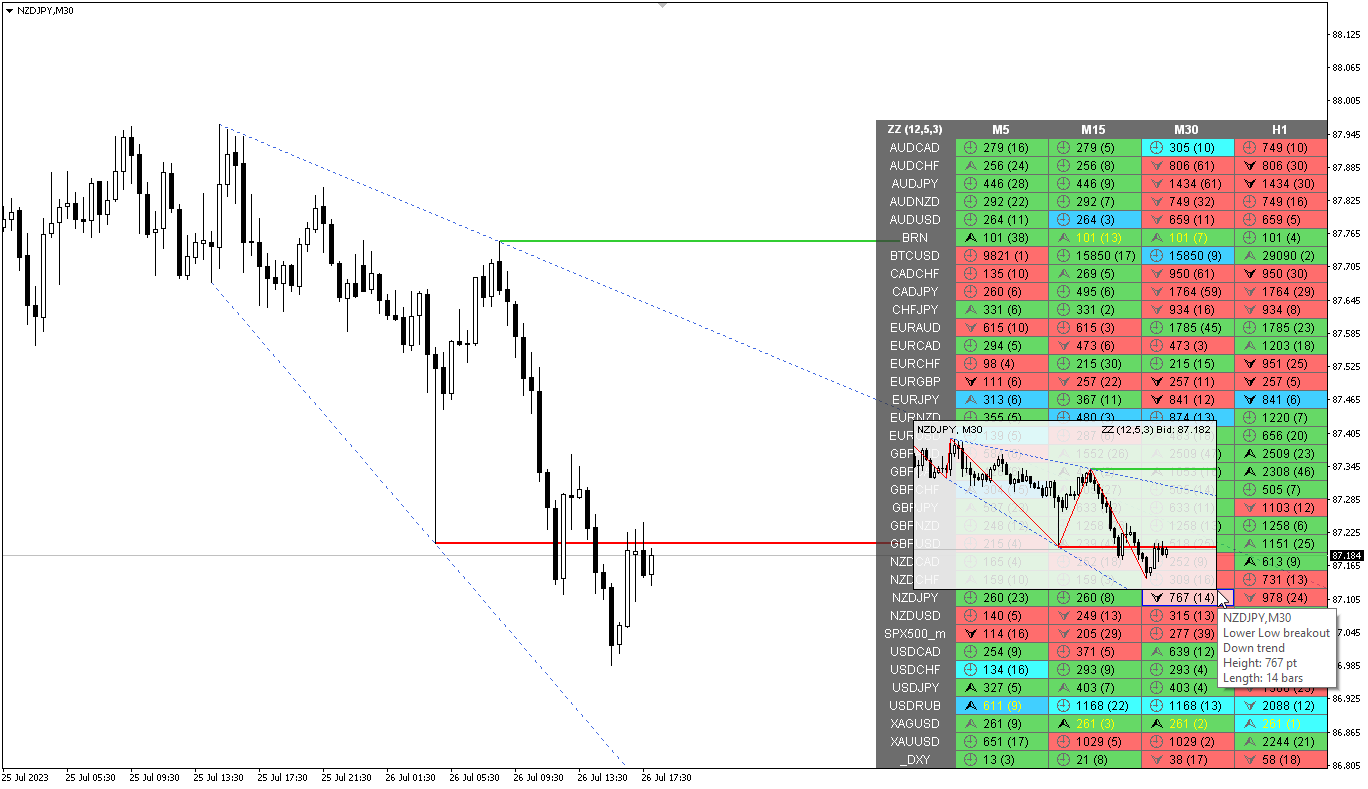
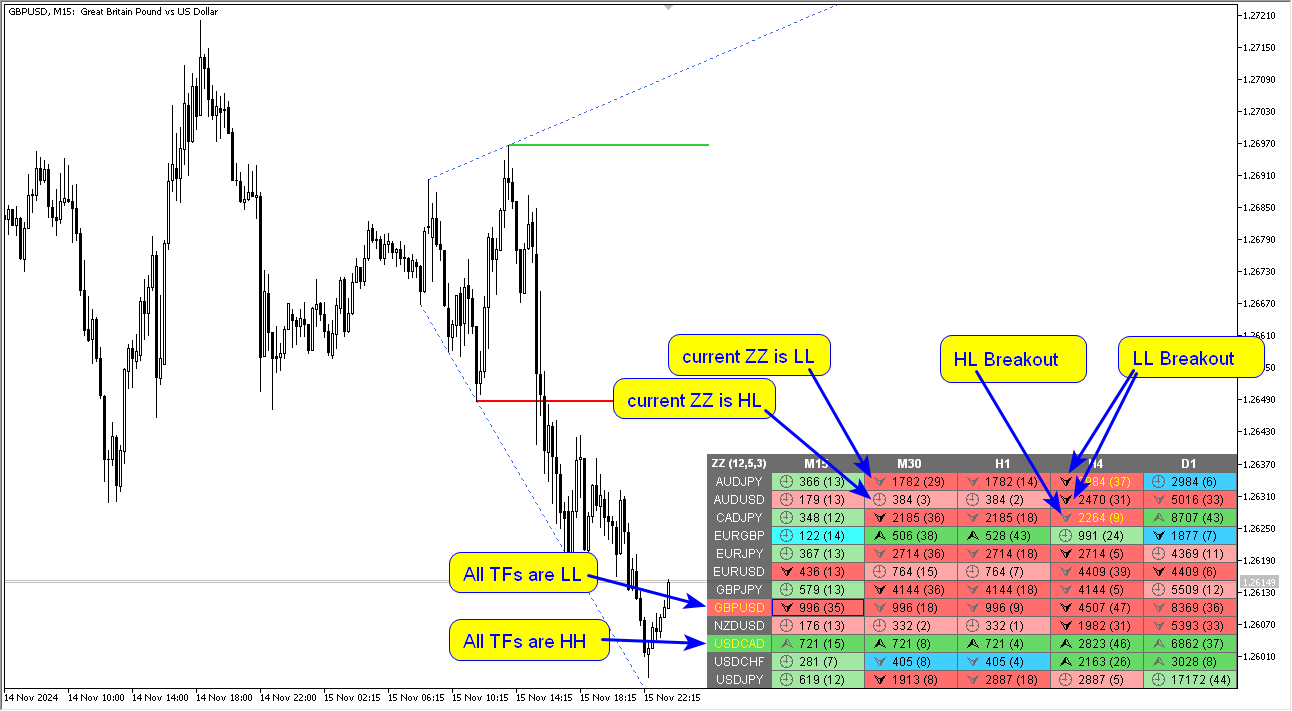
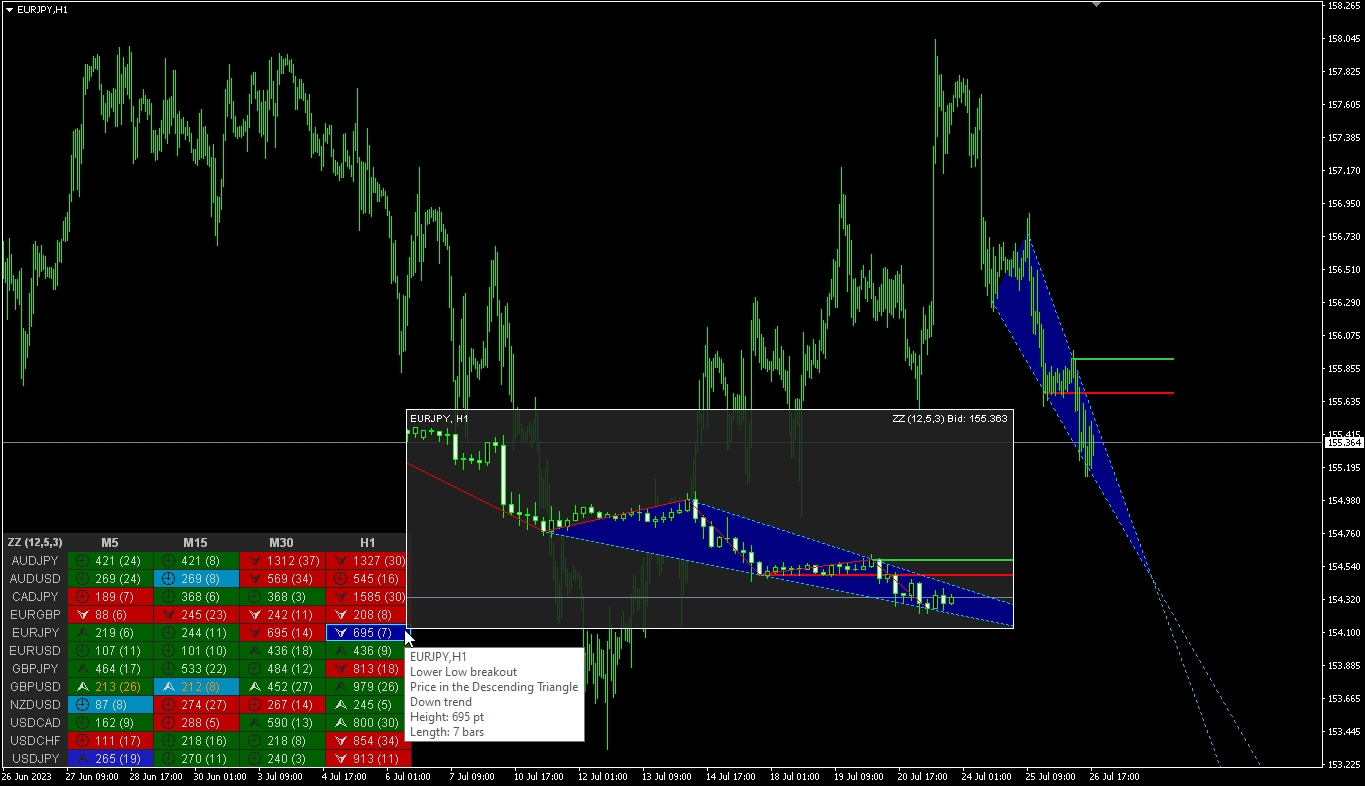
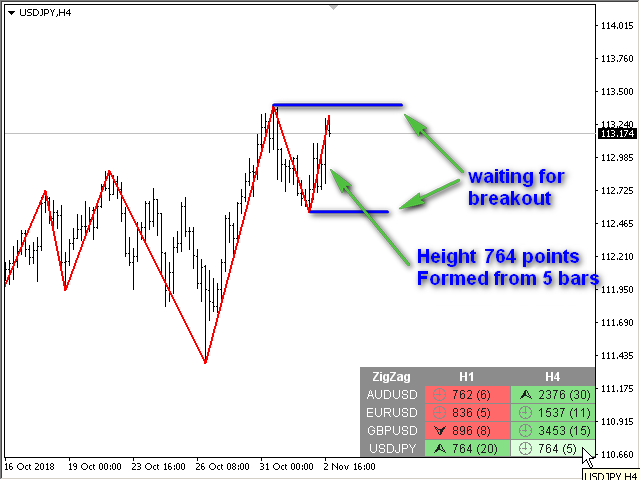
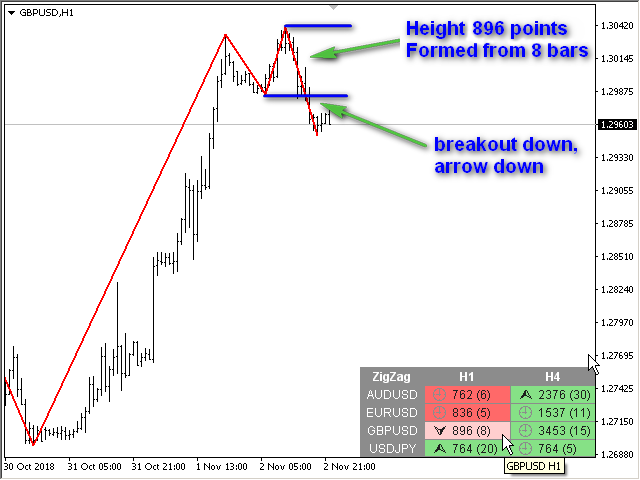
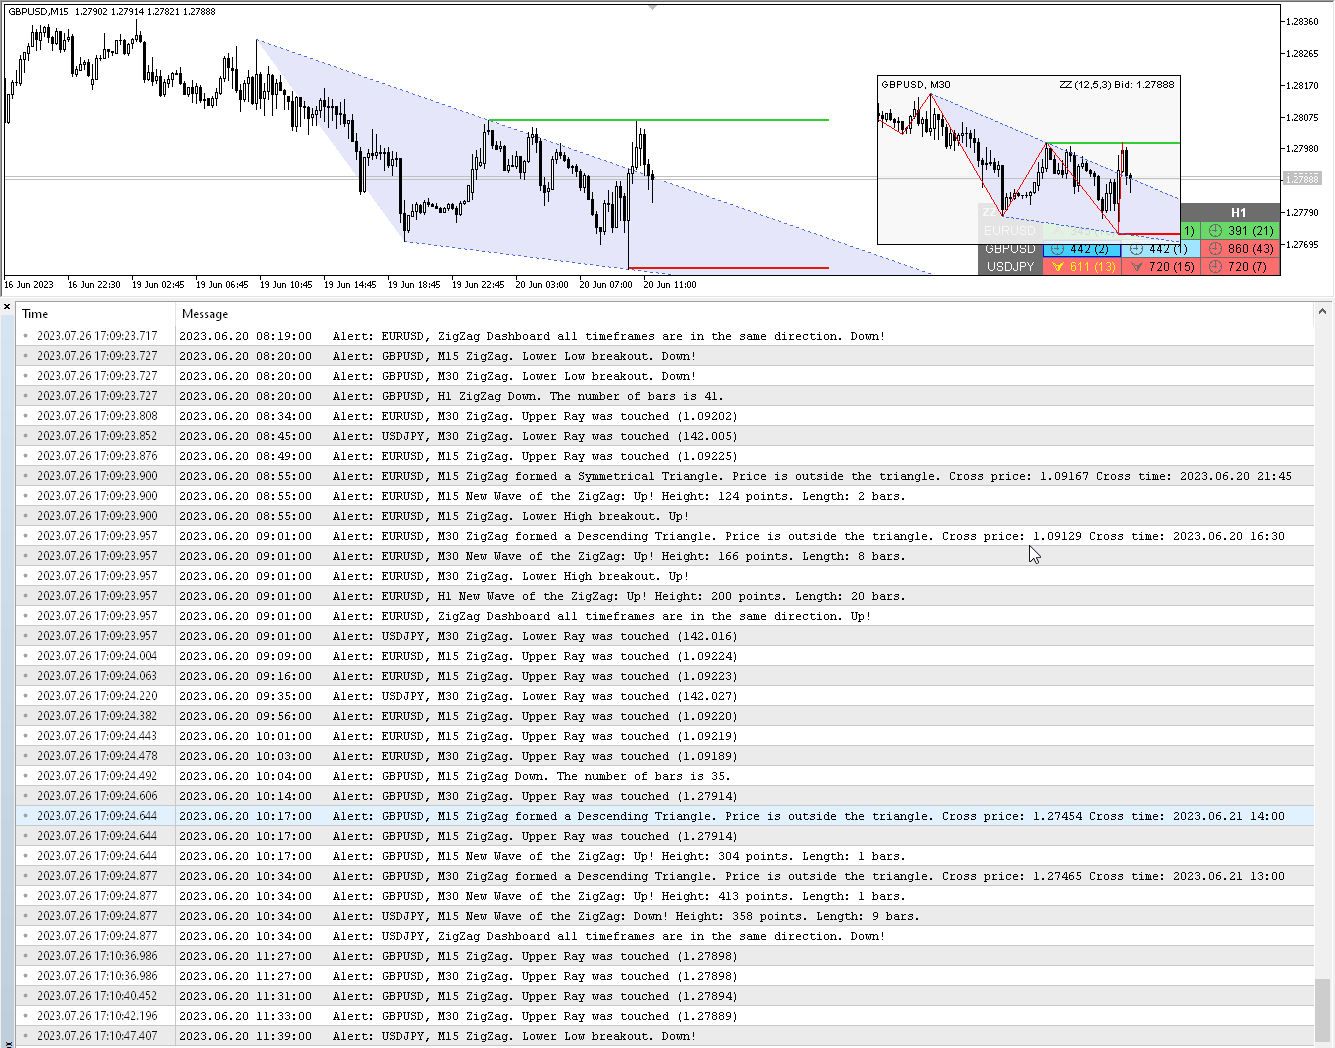
Modificación multidivisa y multitemporal del indicador ZigZag. Muestra la dirección actual del mercado, la altura del último movimiento, el número de barras de este movimiento y la ruptura del punto anterior del ZigZag (línea horizontal). Este es el escáner MTF.
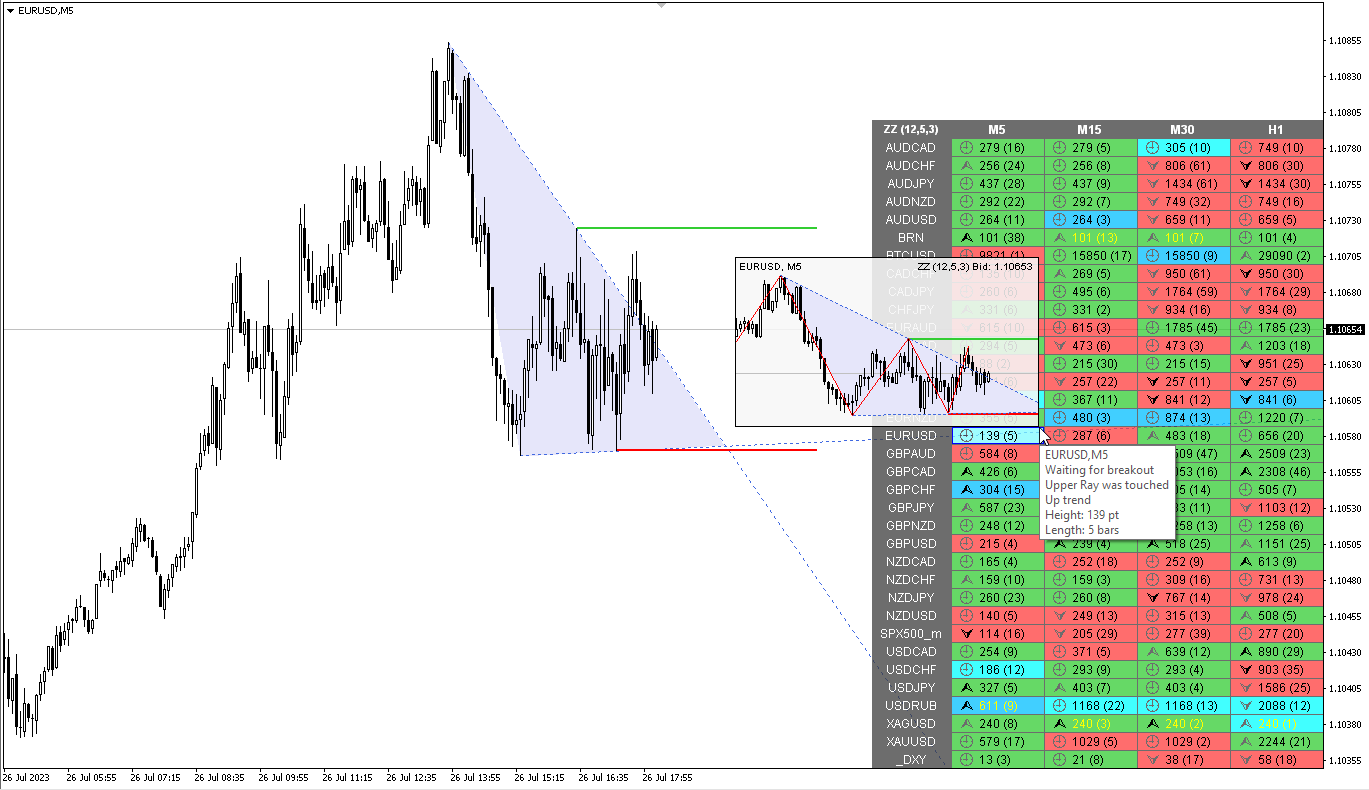
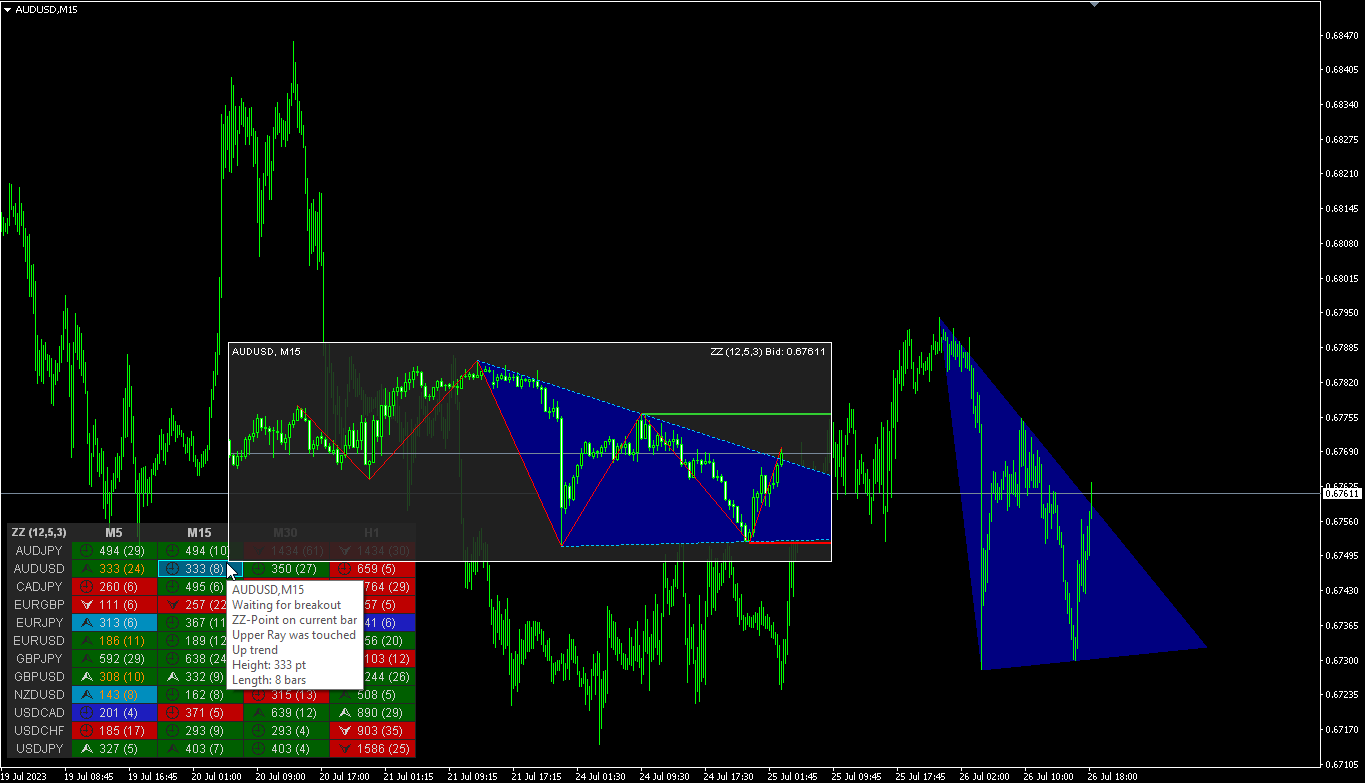
Puede especificar las monedas y plazos que desee en los parámetros. Además, el panel puede enviar notificaciones cuando el ZigZag cambia de dirección o cuando se produce un avance en el punto anterior. Al hacer clic en una celda con un punto, se abrirá este símbolo y punto. Indicador: conecta mínimos y máximos clave para mostrar líneas de tendencia
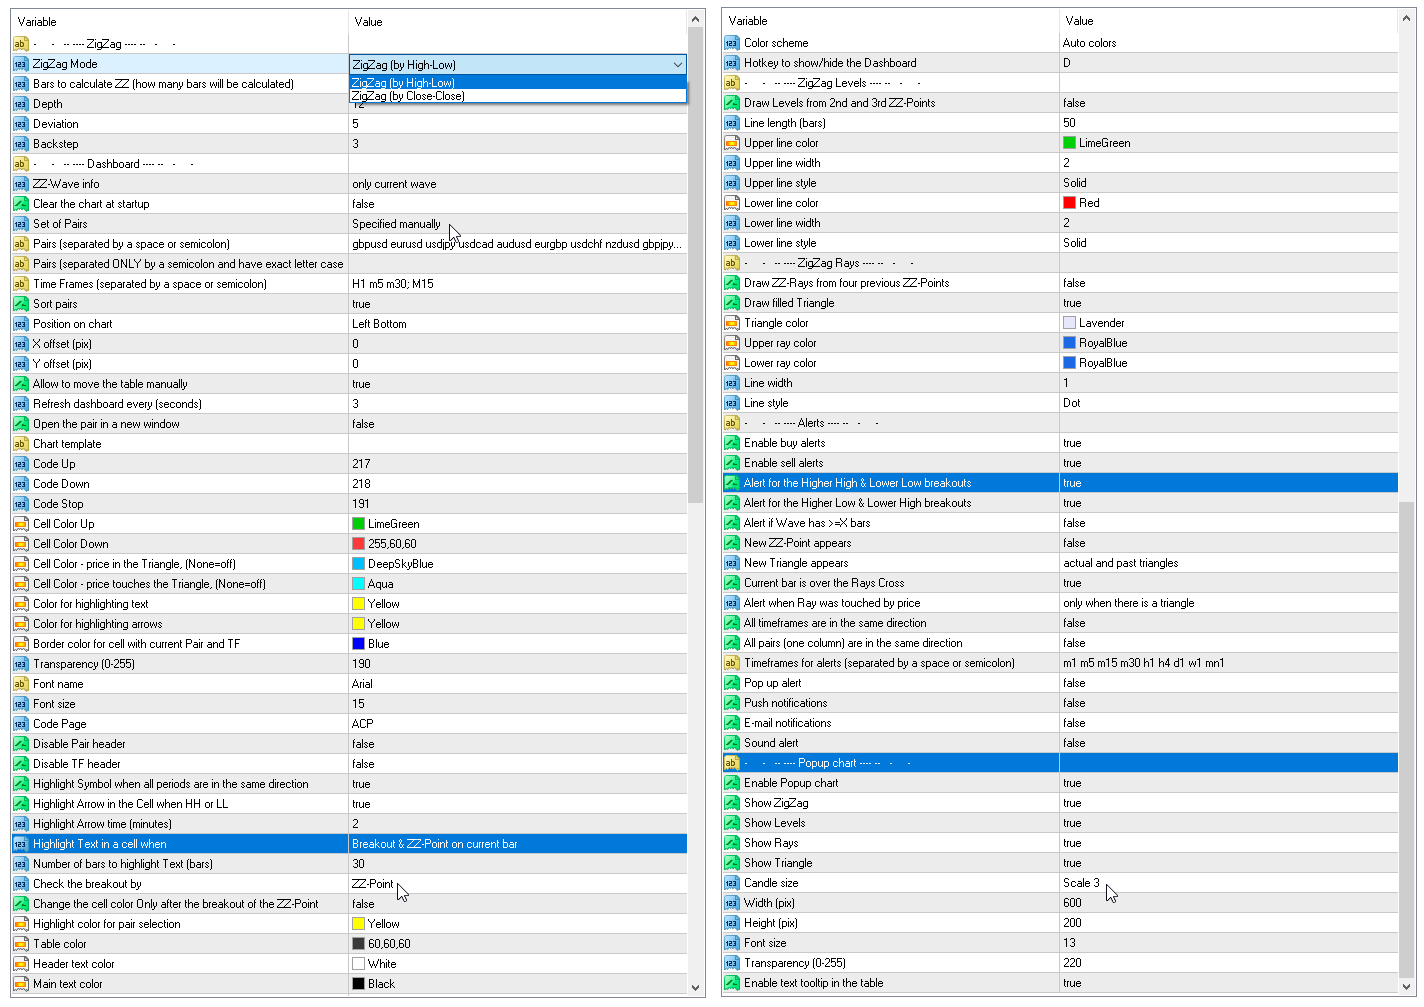
Parámetros
Depth — el número mínimo de velas para las cuales Zigzag no dibujará el segundo máximo (o mínimo), si la última tiene una Desviación menor (o mayor) que la anterior;
Deviation — el número mínimo de puntos entre los máximos y mínimos de dos velas adyacentes para que el Zigzag forme un máximo o mínimo local;
Backstep — el número mínimo de velas entre los máximos y mínimos locales;
Bars to calculate ZZ — el número de barras en el historial para encontrar puntos ZigZag.
ZZ-wave info — qué información sobre la onda se muestra en la tabla: solo la onda actual o la actual + la anterior;
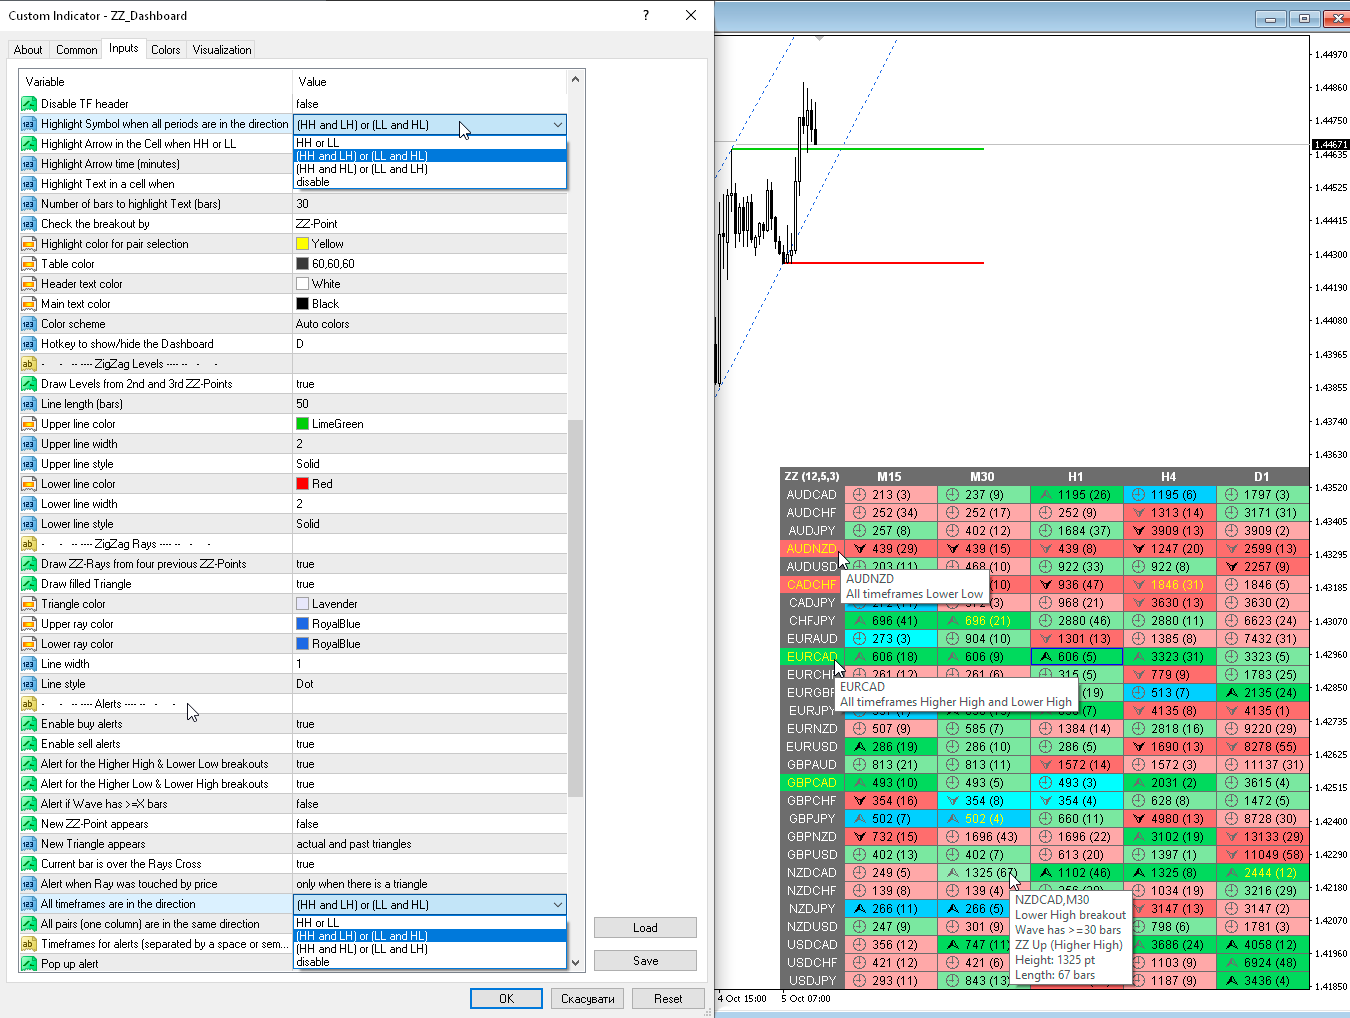
Highlight the symbol when all periods are in the same direction — Resalte el símbolo cuando todos los períodos estén en la misma dirección;
Symbol Highlight time (minutes, 0-all the time) — Tiempo de resaltado del símbolo (minutos, 0-todo el tiempo);
Highlight cells mode — Modo resaltar celdas
— Wave has >=X bars — resalte las celdas en las que el número de barras es mayor o igual a X;— Breakout & ZZ-pt on current bar — resalta las celdas cuando el punto ZigZag anterior está roto (el punto ZZ está en la barra actual);— ZZ-pt on current bar — resalta las celdas cuando aparece un punto ZZ en la barra actual. La ola nueva o cambiada;— Price touched ZZ-Ray — resalta las celdas cuando el precio toca el rayo ZigZag;— disable - deshabilita el resaltado de celdas;
Number of bars to highlight cells (bars) — cuántas barras debe haber en la onda ZigZag para resaltar la celda;
Clear the chart at startup — borre el gráfico al inicio.
Set of Pairs — conjunto de símbolos
— Market Watch — Pares del "Market Watch" del MT. No utilice demasiados símbolos, esto puede hacer que el indicador se ralentice;— Specified manually — pares especificados manualmente, en los parámetros "Pares";— Current pair — par actual;
Pairs (separated by a space or semicolon) — lista de símbolos separados por espacios o punto y coma. Los nombres de las monedas deben escribirse exactamente igual que los del bróker, manteniendo las mayúsculas y minúsculas y el prefijo/sufijo.
Time Frames (separated by a space or semicolon) — lista de períodos de tiempo separados por espacios o punto y coma (marcos de tiempo múltiples).
Sort pairs — ordenar la lista de pares.
Position on chart — esquina para mostrar el panel en el gráfico.
X offset (pix) — desplaza el panel a lo largo del eje X;
Y offset (pix) — desplaza el panel a lo largo del eje Y;
Refresh dashboard every (seconds) — período de actualización para todos los pares y períodos de tiempo.
Open the pair in a new window — abra un símbolo en una nueva ventana del gráfico haciendo clic.
Chart template — el nombre de la plantilla del gráfico, si el gráfico se abre en una ventana nueva.
Color Up — color de la celda si el indicador aumenta.
Color Down — color de la celda si el indicador disminuye.
Color Highlight — color de resaltado del texto.
Transparency (0-255) — transparencia del panel.
Font name — Nombre de la fuente.
Font size — Tamaño de fuente.
Alertas
Timeframes for alerts (separated by a space or semicolon) — lista de períodos durante los cuales se enviará la alerta (separados por un espacio o punto y coma).
Alert if wave has >= X bars — alerta si la onda ZigZag tiene una cantidad de barras mayor o igual a X.
Alert for the Higher High & Lower Low breakouts — alerta si se rompe el HH o LL anterior.
Alert for the Higher Low & Lower High breakouts — alerta si se rompe el HL o LH anterior.
New ZZ-Point appears — alerta si aparece un nuevo punto ZigZag.
New Triangle appears — Aparece un nuevo triángulo.
Current bar is over the Rays Cross — La barra actual está sobre Rays Cross.
Alert when Ray was touched by price — Alerta cuando Ray se vio afectado por el precio.
All timeframes are in the same direction — Todos los plazos van en la misma dirección.
All pairs (one column) are in the same direction — Todos los pares (una columna) están en la misma dirección.
All timeframes are in the same direction — Todos los plazos están en la misma dirección: alerta cuando todos los plazos están en la misma dirección.
All pairs (one column) are in the same direction — Todos los pares (una columna) están en la misma dirección.
Pop up alert — Alerta emergente.
Push notifications — Notificaciones push.
E-mail notifications — Notificaciónes de Correo Electrónico.
Sound alert — Alerta sonora.


The developer is simply incredible! There aren’t many words—just amazing results. I've purchased many of his products—each one better than the last. The support is fantastic. If someone wants a serious “view” of the market, these are the ultimate tools! A thousand thanks, Taras! Keep up the great work!