ZigZag Dashboard for MT4
- Indikatoren
- Version: 6.40
- Aktualisiert: 17 Juni 2026
- Aktivierungen: 10

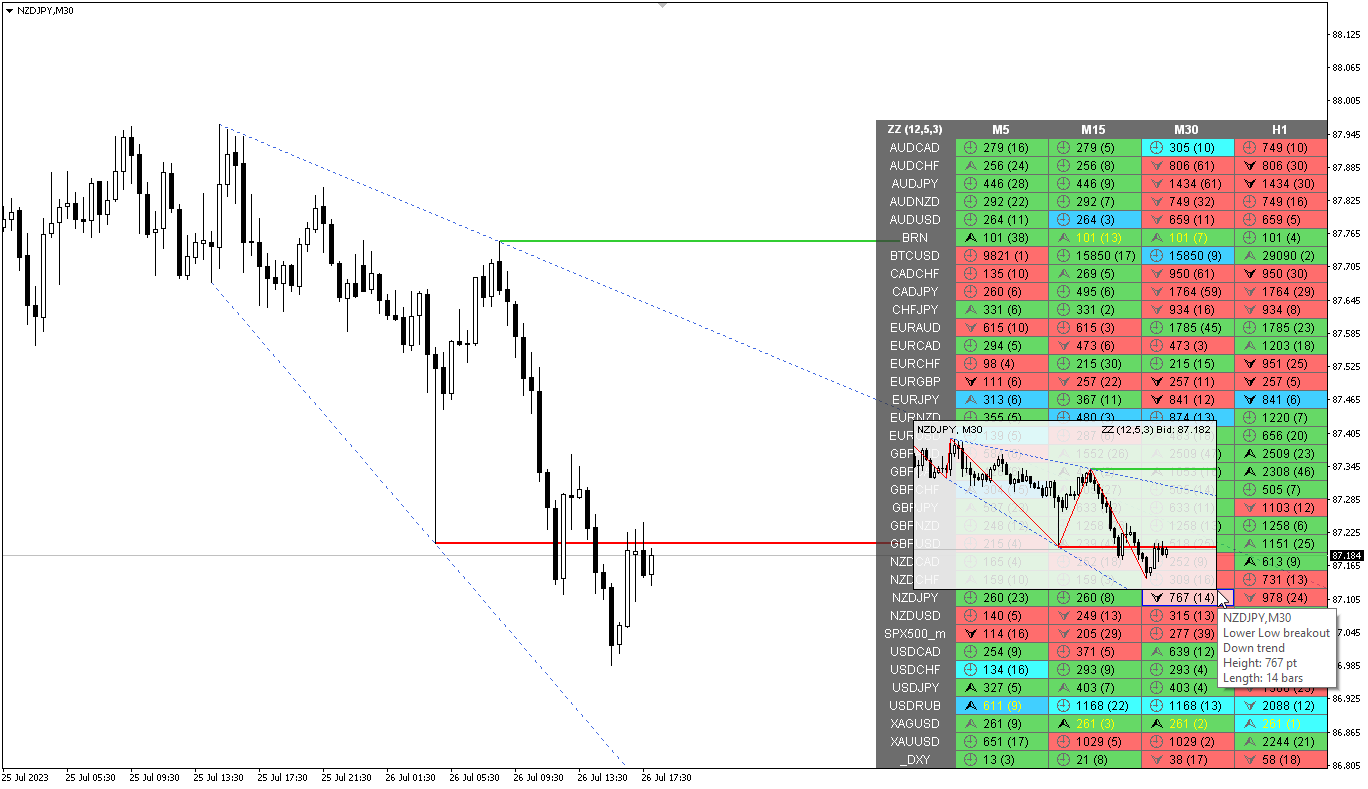
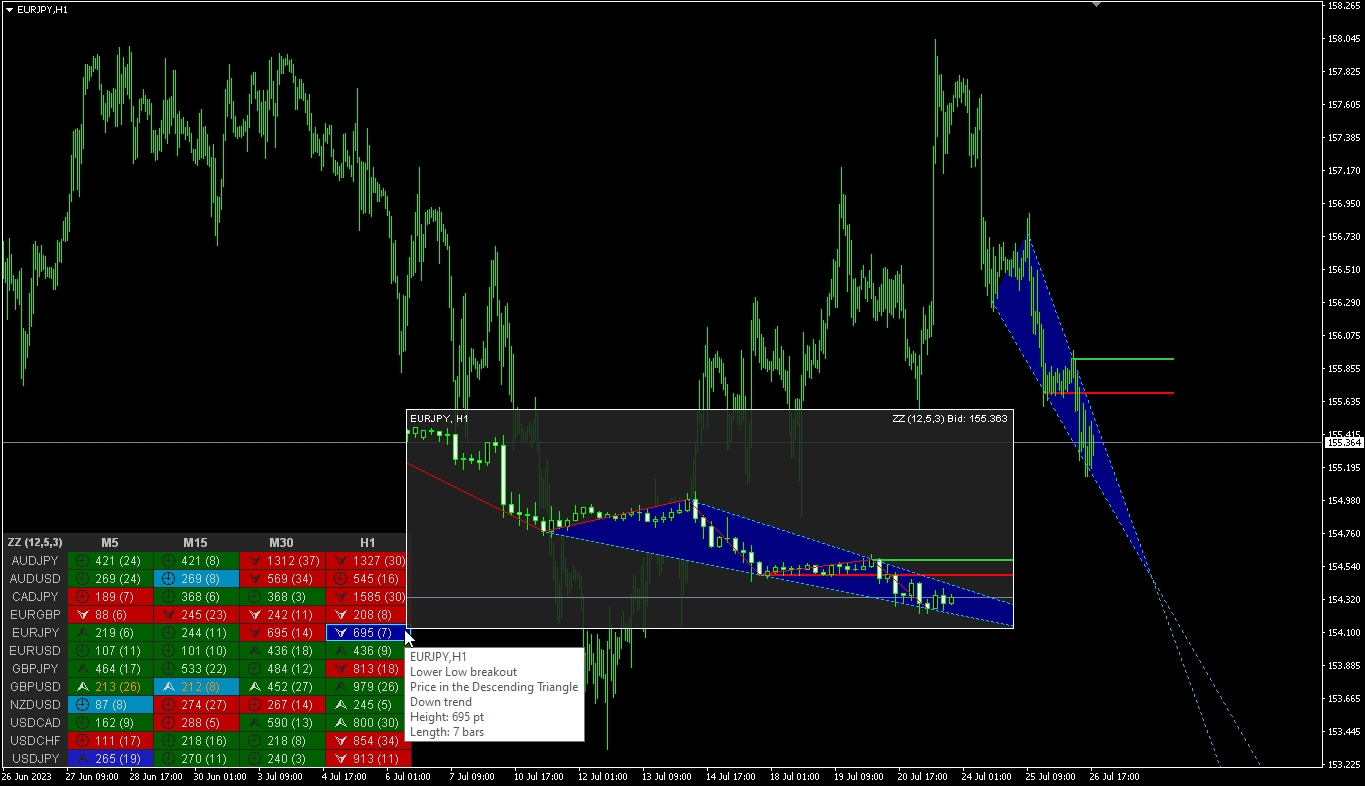
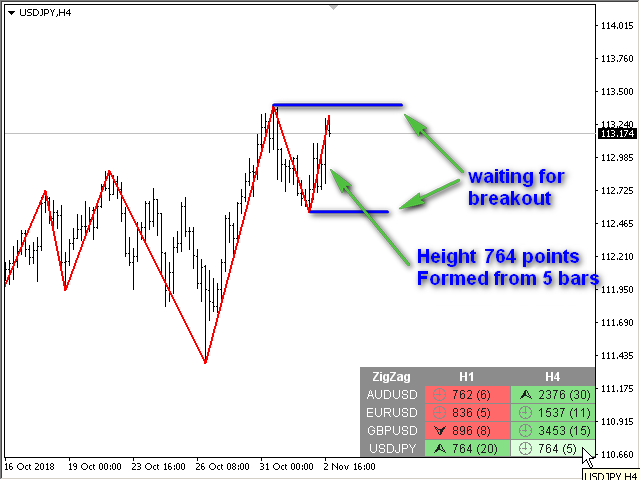
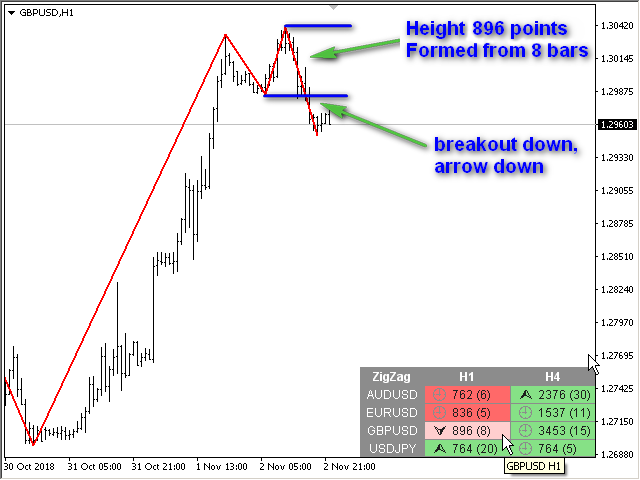
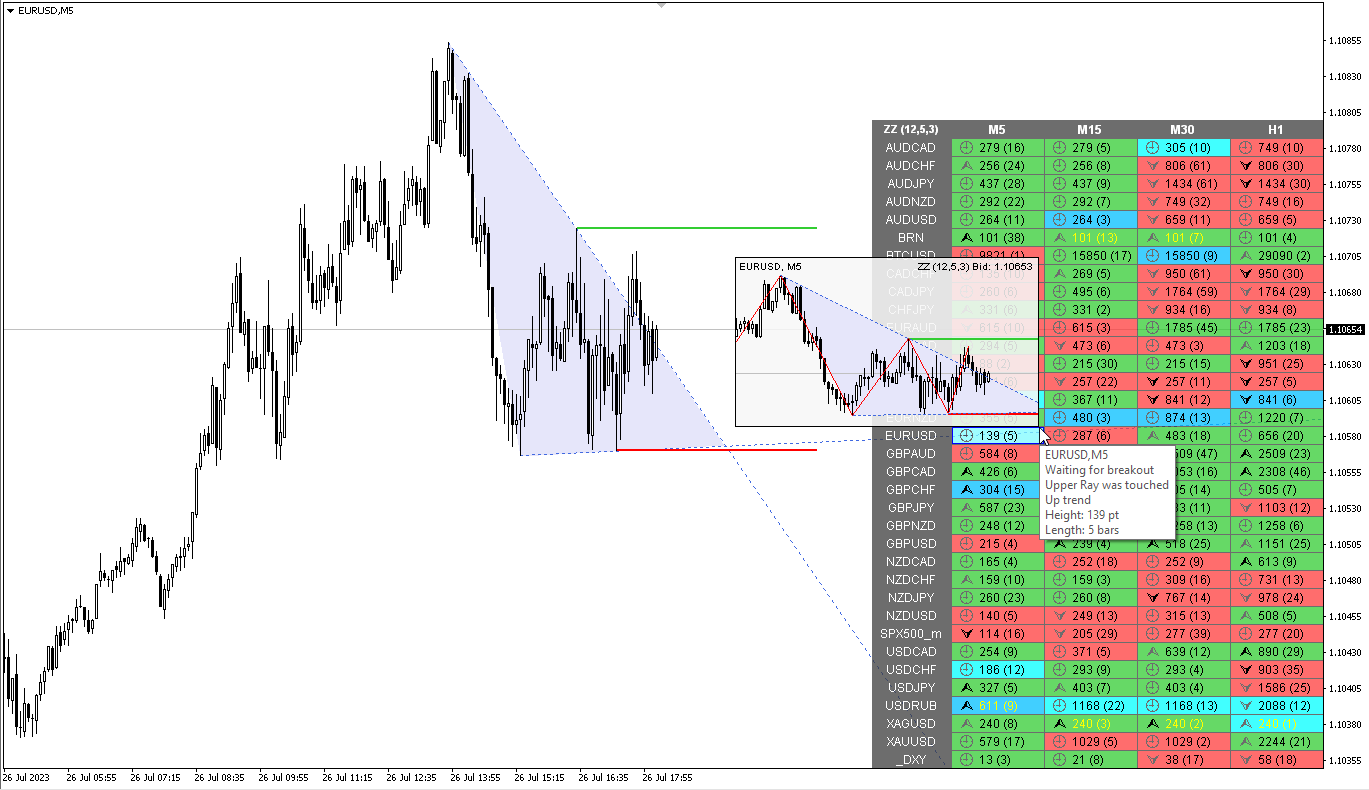
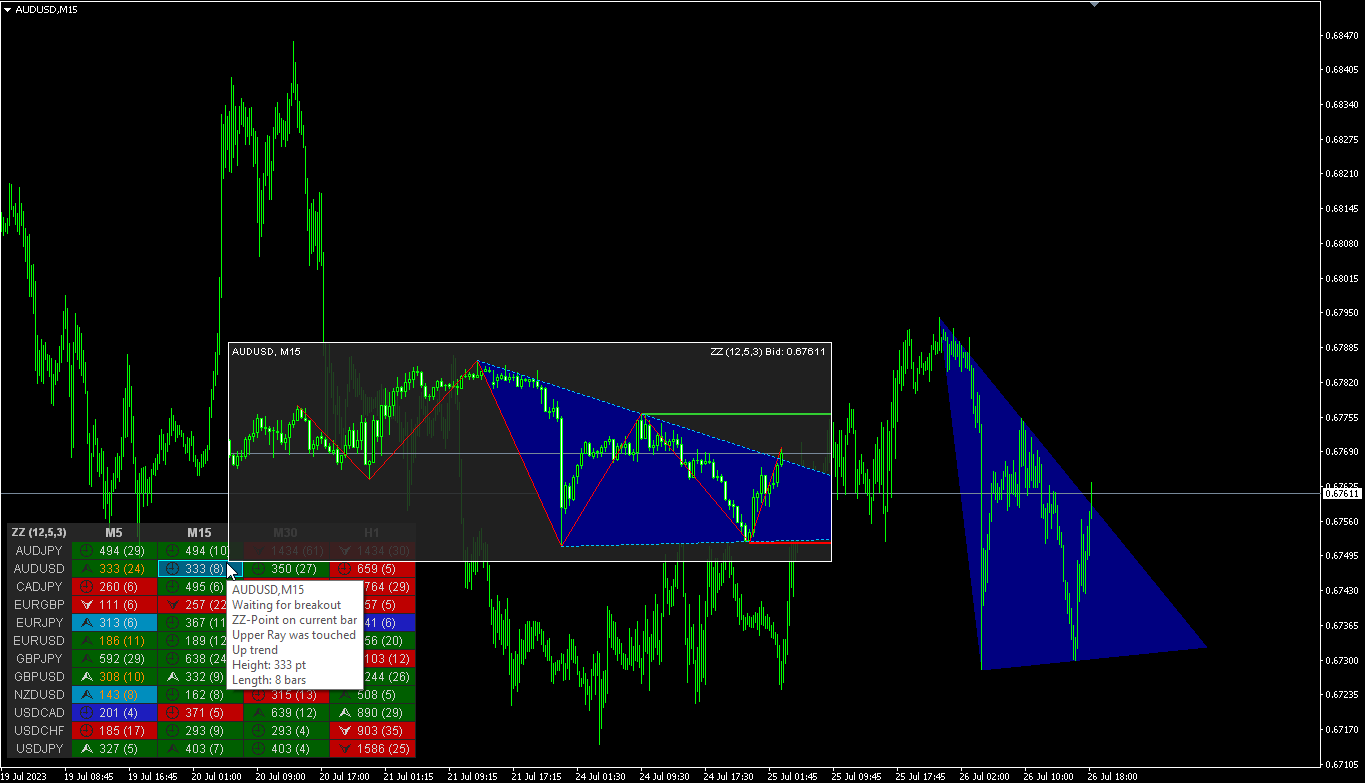
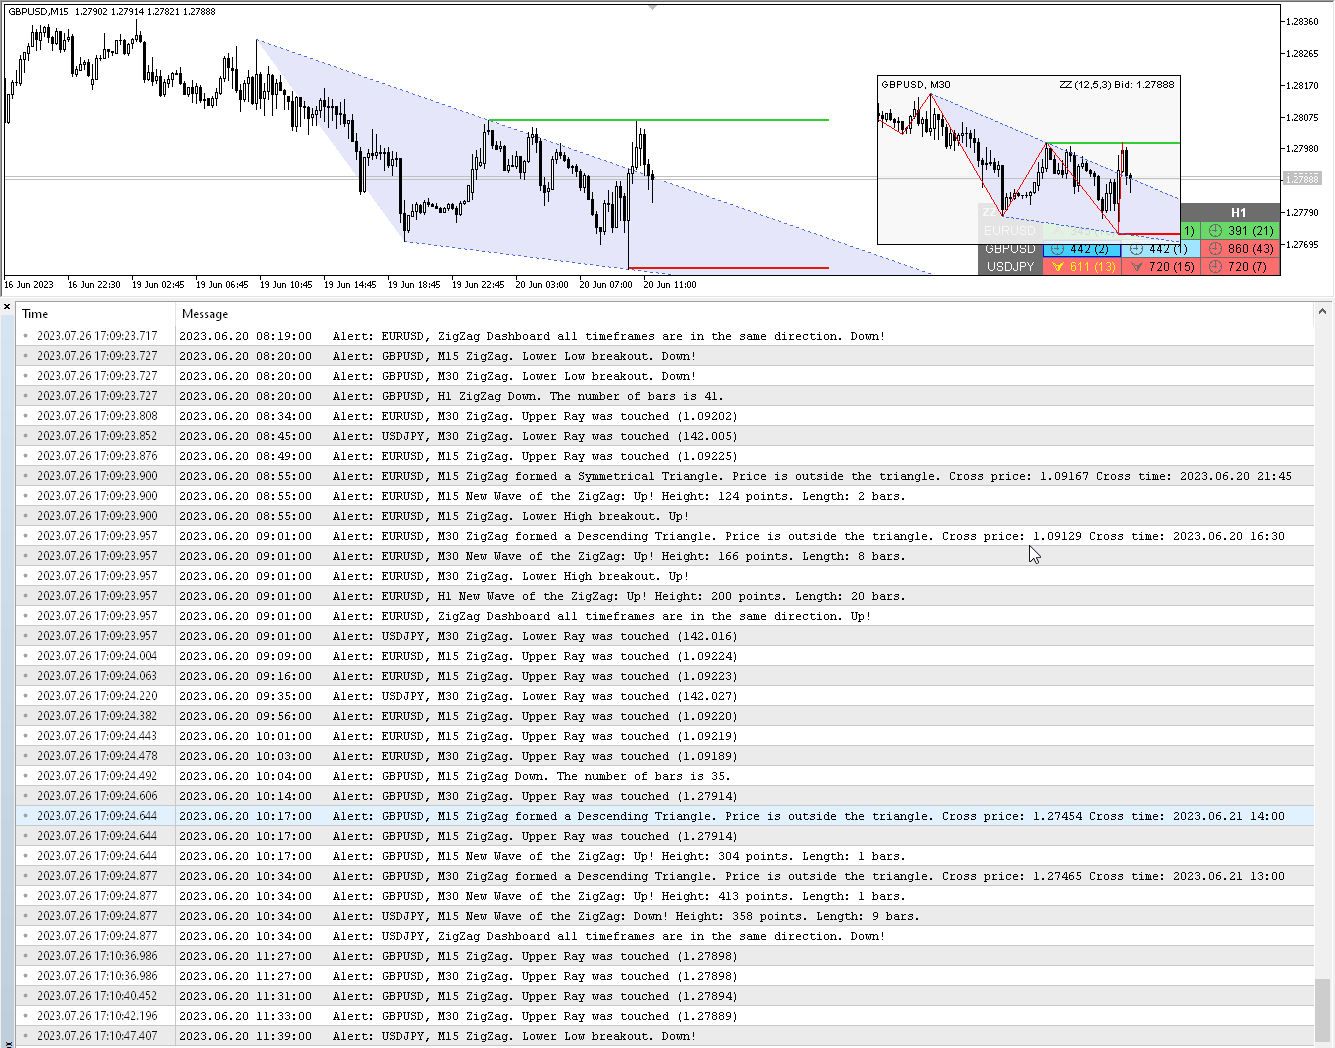
Anpassung des ZigZag-Indikators für mehrere Währungen und Zeitrahmen. Zeigt die aktuelle Marktrichtung, die Höhe der letzten Bewegung, die Anzahl der Balken in dieser Bewegung und das Durchbrechen des vorherigen ZigZag-Punkts (horizontale Linie) an. Dies ist der MTF-Scanner, mit dem Sie die Angebots- und Nachfragestufen tatsächlich sehen können.
In den Parametern können Sie beliebige Währungen und Zeitrahmen festlegen. Außerdem kann das Panel Benachrichtigungen senden, wenn der ZigZag die Richtung wechselt oder wenn ein Durchbruch des vorherigen Punktes stattgefunden hat. Durch Klicken auf eine Zelle mit einem Zeitraum werden dieses Symbol und dieser Zeitraum geöffnet. Indikator – verbindet wichtige Tief- und Hochpunkte, um Trendlinien anzuzeigen.
Sie können ihn auch als Indikator für den „Break of Structure“ (BOS) und den „Market Structure Shift“ (MSS) verwenden
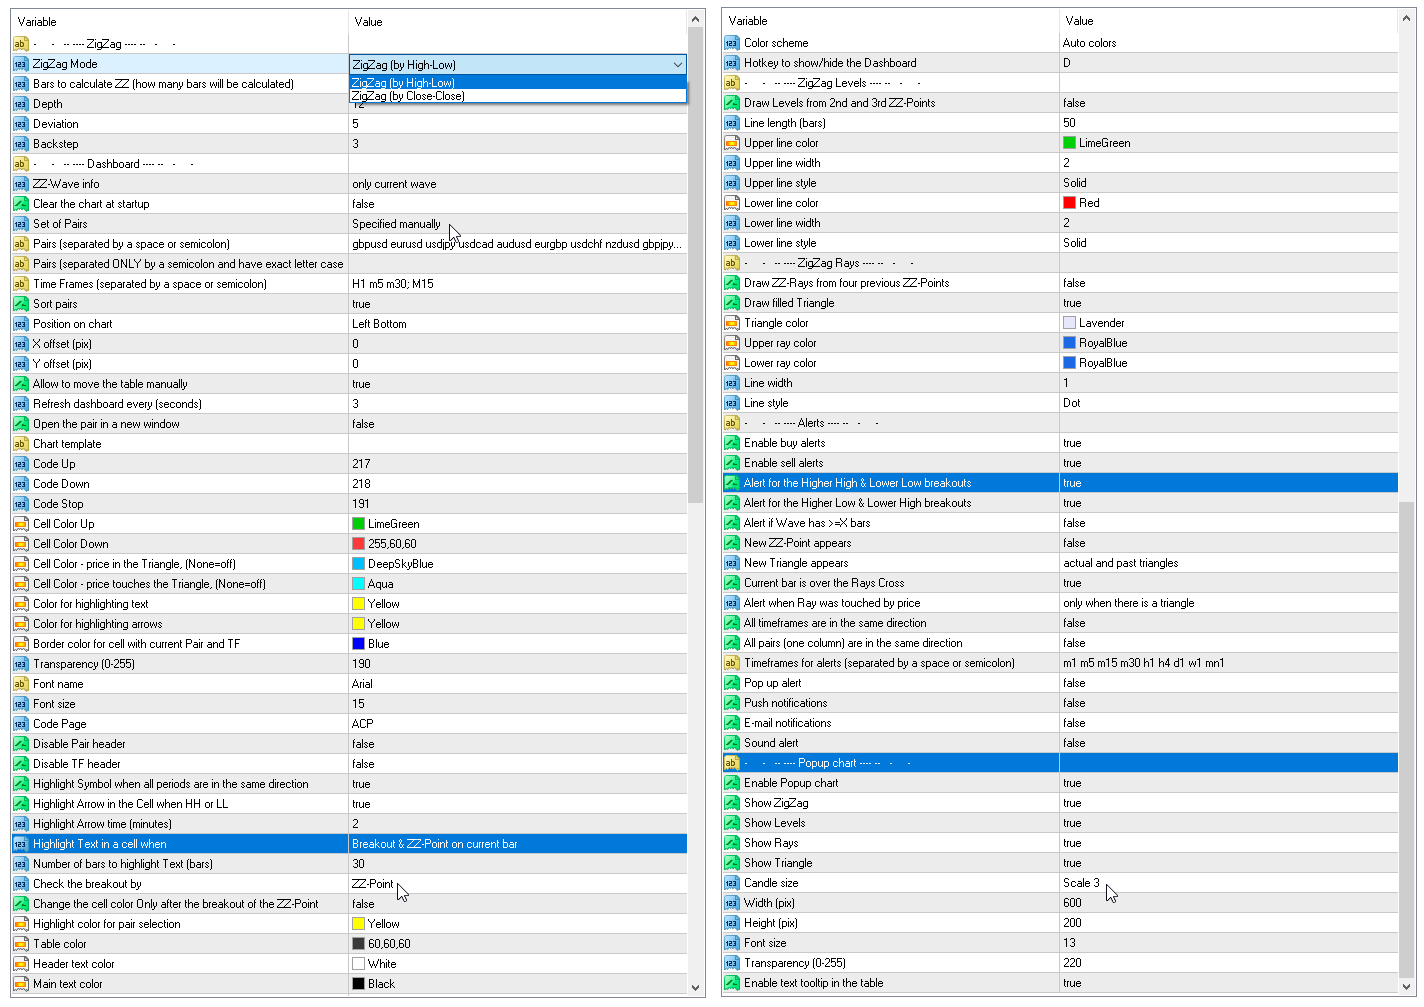
Parameter
Tiefe — die Mindestanzahl an Kerzen, bei der der ZigZag kein zweites Hoch (oder Tief) zeichnet, wenn das letzte um die Abweichung kleiner (oder größer) als das vorherige ist;
Abweichung – die Mindestanzahl an Punkten zwischen den Hochs/Tiefs zweier benachbarter Kerzen, damit der Zigzag ein lokales Hoch/Tief bildet;
Rücksprung – die Mindestanzahl an Kerzen zwischen den lokalen Hochs/Tiefs;
Bars zur Berechnung von ZZ – die Anzahl der Balken im Verlauf zur Ermittlung von ZigZag-Punkten.
ZZ-Welleninfo – welche Informationen zur Welle in der Tabelle angezeigt werden sollen – nur die aktuelle Welle oder die aktuelle + die vorherige;
„Reverse Move anzeigen “ – fügt der Tabelle die umgekehrte Bewegung hinzu. Dies zeigt die umgekehrte Kursbewegung ausgehend vom ZigZag-Punkt an. Dieser Wert kann in Punkten (ZZ-Punkt minus Geldkurs) oder in Prozent (das Verhältnis der ZZ-Länge zur umgekehrten Bewegung) angegeben werden;
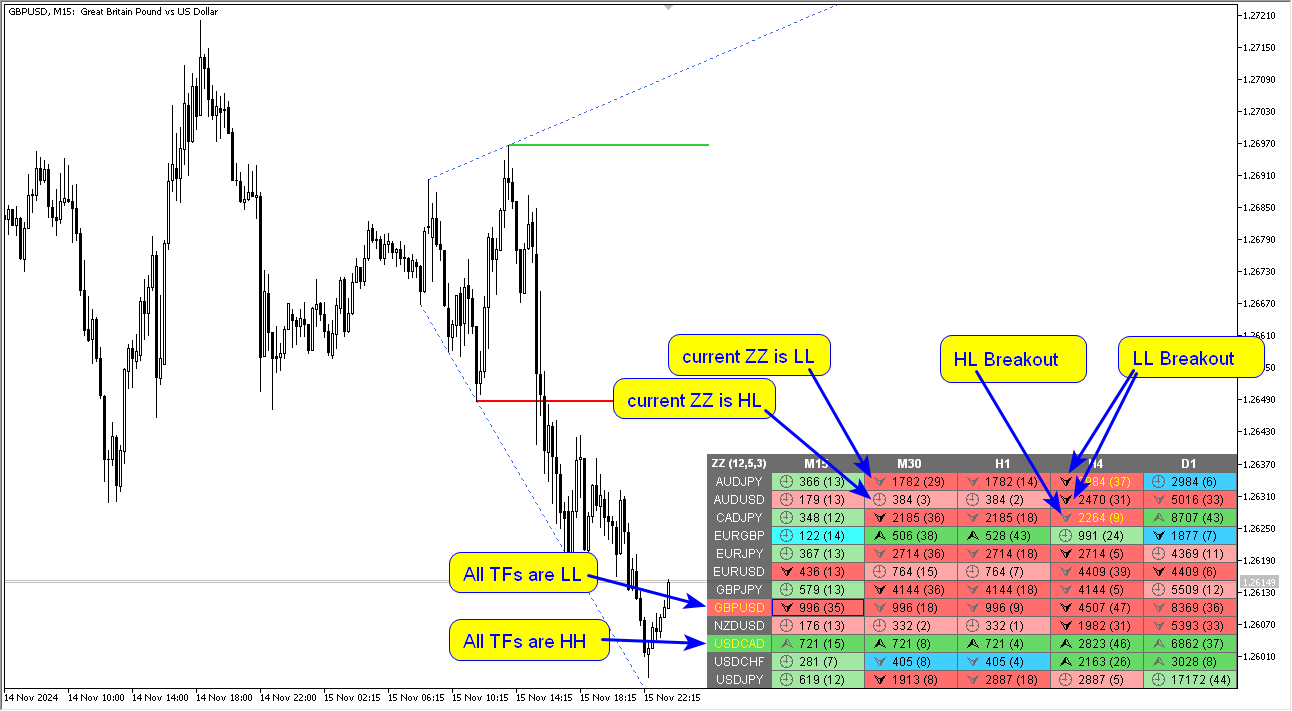
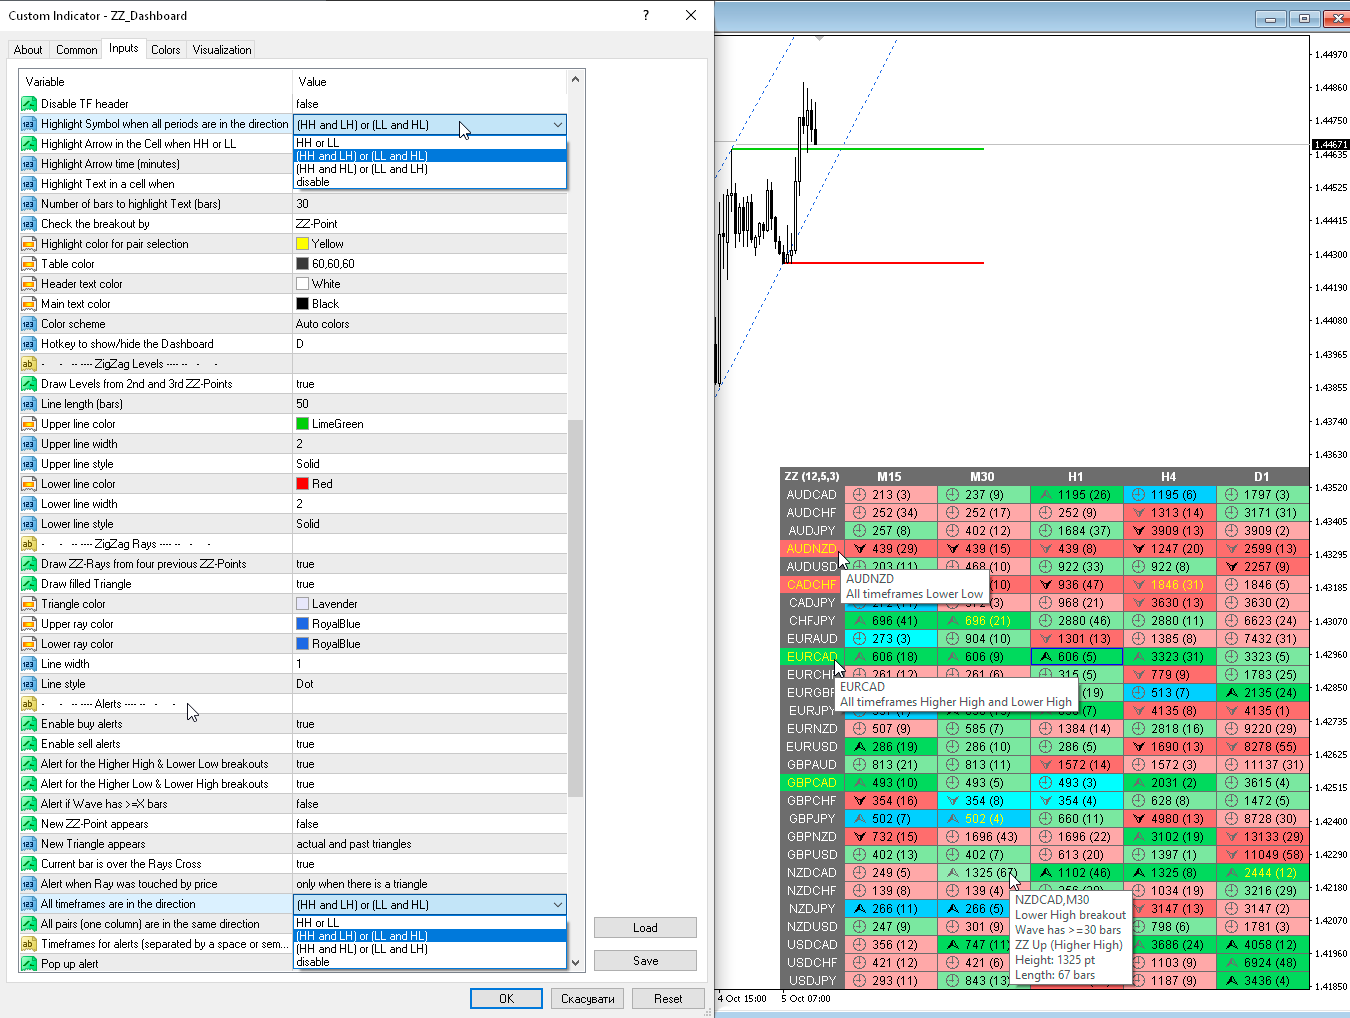
Symbol hervorheben, wenn alle Zeiträume in dieselbe Richtung weisen (HH HL LH LL):
— HH oder LL — bei „Höheres Hoch“ oder „Tieferes Tief“;— (HH und LH) oder (LL und HL) – bei ( höherem Hoch und niedrigerem Hoch) oder (niedrigerem Tief und höherem Tief);— (HH und HL) oder (LL und LH) — bei ( höherem Hoch und höherem Tief) oder (tieferem Tief und tieferem Hoch);— deaktivieren.
Dauer der Symbolhervorhebung (Minuten, 0 – bis sich die Richtung ändert);
Text in einer Zelle hervorheben, wenn:
Text in einer Zelle hervorheben, wenn:
— Welle hat >=X Balken — Zellen hervorheben, in denen die Anzahl der Balken größer oder gleich X ist;
— Ausbruch & ZZ-Punkt auf aktuellem Balken — Zellen hervorheben, wenn der vorherige ZigZag-Punkt durchbrochen wird (der ZZ-Punkt befindet sich auf dem aktuellen Balken);
— ZZ-Punkt auf aktuellem Balken — Markiert Zellen, wenn ein ZZ-Punkt auf dem aktuellen Balken erscheint. Die neue oder geänderte Welle;
— Kurs hat ZZ-Strahl berührt — Markiert Zellen, wenn der Kurs den ZigZag-Strahl berührt;
— Deaktivieren – Deaktiviert die Zellmarkierung.
Anzahl der Balken in der ZZ-Welle für die Hervorhebung: „Text (Balken) “ — wie viele Balken sollte die ZigZag-Welle umfassen, damit die Zelle hervorgehoben wird;
Ausbruch prüfen nach: „
“
Ausbruch prüfen nach: „
“
— ZZ-Punkt — Überprüfung anhand des Kurses des ZigZag-Punkts;— Geschlossene Balken — Überprüfung anhand des Schlusskurses des Balkens.
Chart beim Start löschen — Balken und Gitter im Chart ausblenden.
Symbolauswahl — Auswahl an Symbolen
Symbolauswahl — Auswahl an Symbolen
— Marktübersicht — Währungspaare aus der „Marktübersicht“. Verwenden Sie nicht zu viele Symbole, da dies zu einer Verlangsamung des Indikators führen kann;
— Manuell festgelegt — manuell festgelegte Währungspaare in den Parametern „Paare“;
— Aktuelles Währungspaar;
Paare (durch Leerzeichen oder Semikolon getrennt) — Liste von Symbolen, die durch Leerzeichen oder Semikolons getrennt sind. Die Währungsbezeichnungen sollten genau wie beim Broker geschrieben werden, wobei Groß- und Kleinschreibung sowie Präfixe und Suffixe beibehalten werden müssen.
Zeitrahmen (durch Leerzeichen oder Semikolon getrennt) — Liste der Zeitrahmen, getrennt durch Leerzeichen oder Semikolons (mehrere Zeitrahmen).
Paare sortieren — Sortierung der Liste der Paare.
Position im Chart — Ecke, an der das Panel im Chart angezeigt werden soll.
X-Versatz (Pixel) — Verschiebung des Panels entlang der X-Achse;
Y-Versatz (Pixel) — Verschiebung des Panels entlang der Y-Achse;
Dashboard alle (Sekunden) aktualisieren — Aktualisierungsintervall für alle Paare und Zeitrahmen.
Paar in einem neuen Fenster öffnen — ein Symbol durch Anklicken in einem neuen Chartfenster öffnen.
Chartvorlage — der Name der Vorlage für das Chart, falls das Chart in einem neuen Fenster geöffnet wird.
Farbe bei Anstieg — Zellenfarbe, wenn der Indikator steigt.
Farbe bei Rückgang — Zellenfarbe, wenn der Indikator fällt.
Color Highlight – Farbe der Textmarkierung.
Transparency (0–255) – Transparenz des Fensters.
Schriftartname.
Schriftgröße.
Benachrichtigungen
Zeitrahmen für Benachrichtigungen (durch Leerzeichen oder Semikolon getrennt) — Liste der Zeiträume, für die die Benachrichtigung gesendet wird (durch Leerzeichen oder Semikolon getrennt).
Benachrichtigung, wenn die Welle >= X Balken hat — Benachrichtigung, wenn die ZigZag-Welle eine Anzahl von Balken hat, die größer oder gleich X ist.
Alarm bei Durchbrüchen von höheren Hochs und niedrigeren Tiefs — Alarm, wenn das vorherige HH oder LL durchbrochen wird (Market Structure Shift (MSS)).
Alarm bei Durchbrüchen von höheren Tiefs und niedrigeren Hochs — Alarm, wenn das vorherige HL oder LH durchbrochen wird ( Break of Structure (BOS)).
Ein neuer ZZ-Punkt erscheint – Benachrichtigung, wenn ein neuer ZigZag-Punkt erscheint.
Ein neues Dreieck erscheint.
Der aktuelle Balken liegt über dem „Rays Cross“.
Benachrichtigung, wenn der Preis den „Ray“ berührt hat.
Alle Zeitrahmen weisen dieselbe Richtung auf.
Alle Paare (eine Spalte) weisen dieselbe Richtung auf.
Alle Zeitrahmen weisen dieselbe Richtung auf – Benachrichtigung, wenn alle Zeitrahmen dieselbe Richtung aufweisen.
Alle Paare (eine Spalte) weisen dieselbe Richtung auf.
Popup-Benachrichtigung – MT-Benachrichtigungen.
Push-Benachrichtigungen.
E-Mail-Benachrichtigungen.
Akustische Benachrichtigung.


The developer is simply incredible! There aren’t many words—just amazing results. I've purchased many of his products—each one better than the last. The support is fantastic. If someone wants a serious “view” of the market, these are the ultimate tools! A thousand thanks, Taras! Keep up the great work!