ZigZag Dashboard for MT4
- Indicatori
- Versione: 6.40
- Aggiornato: 17 giugno 2026
- Attivazioni: 10

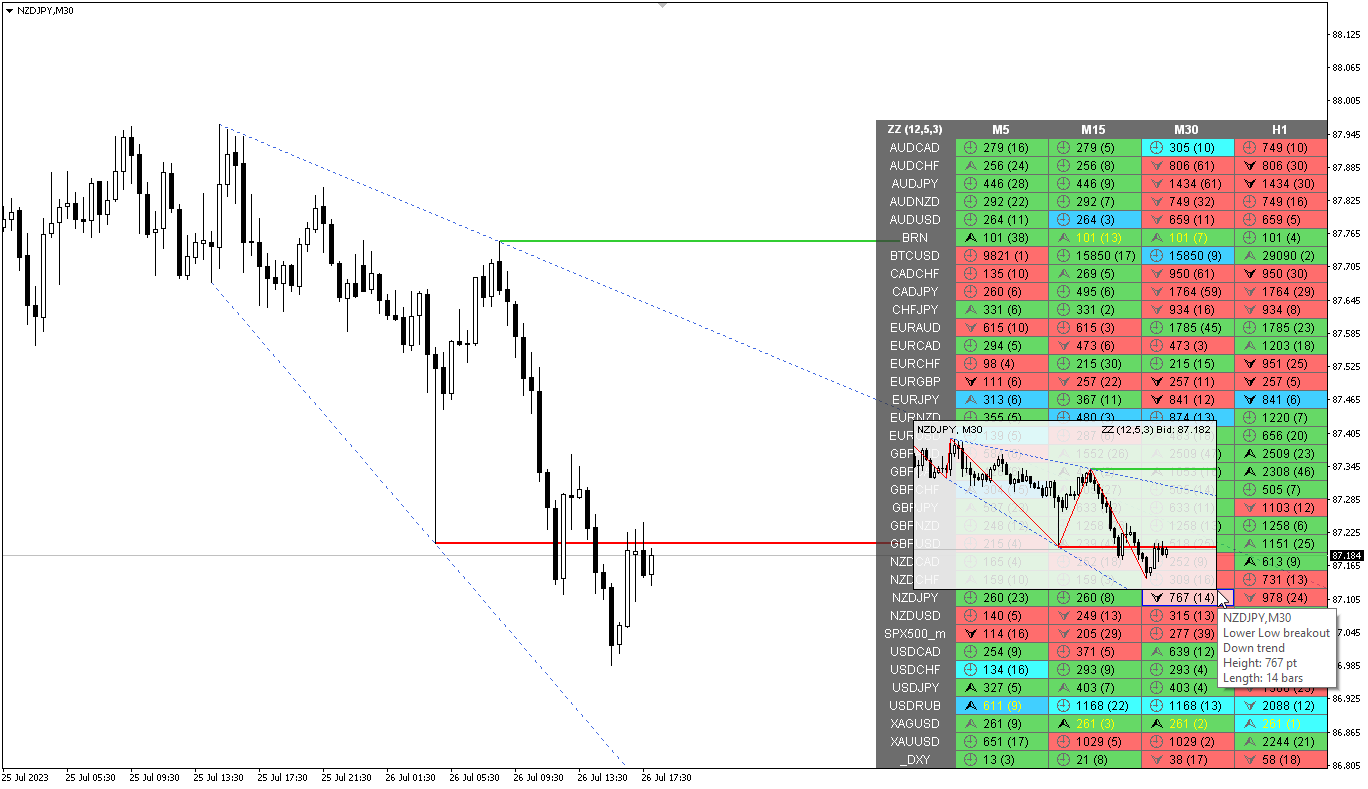
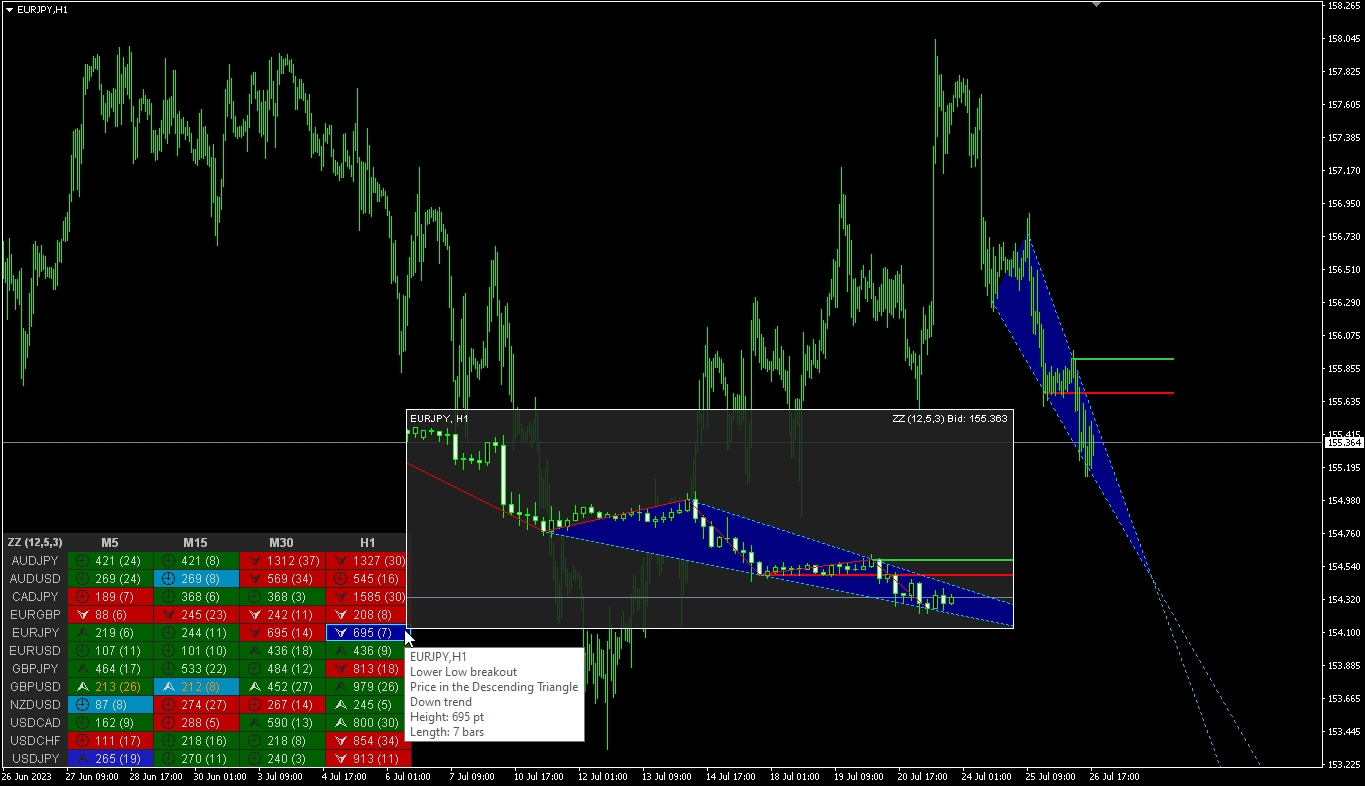
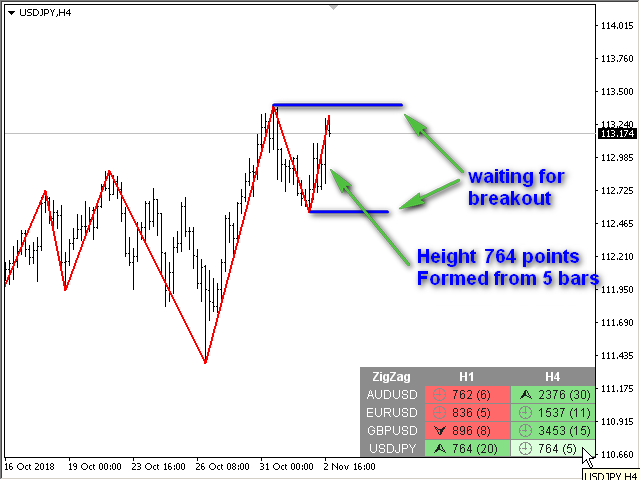
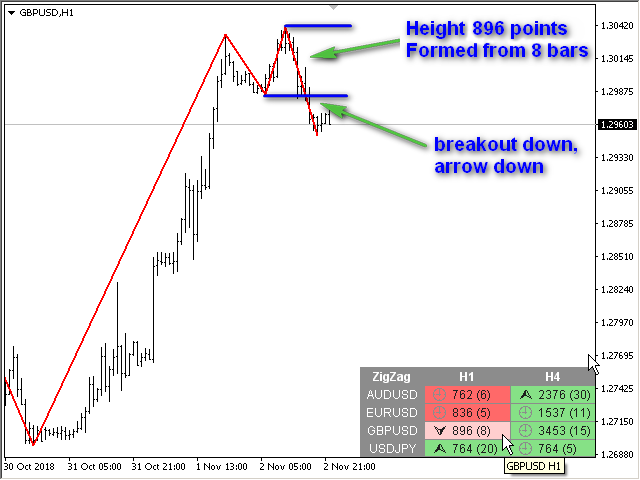
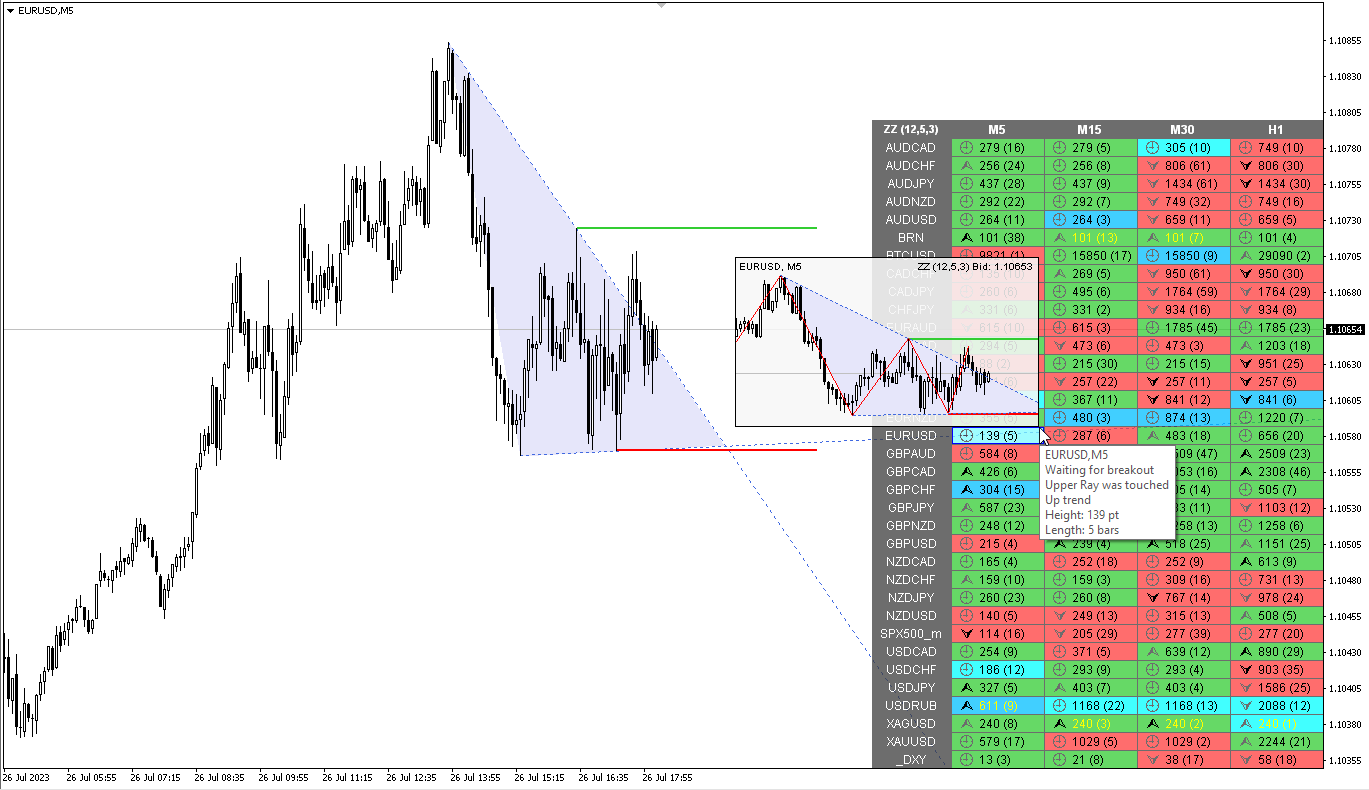
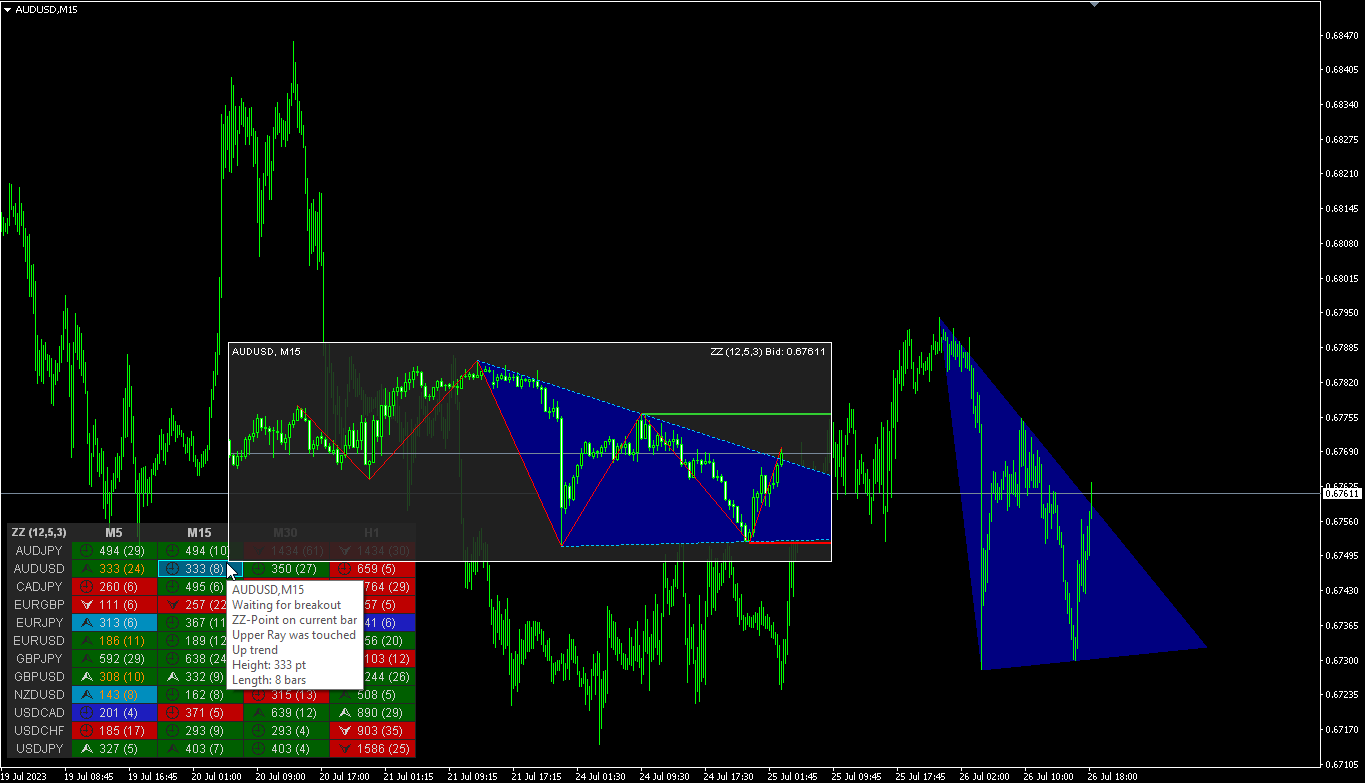
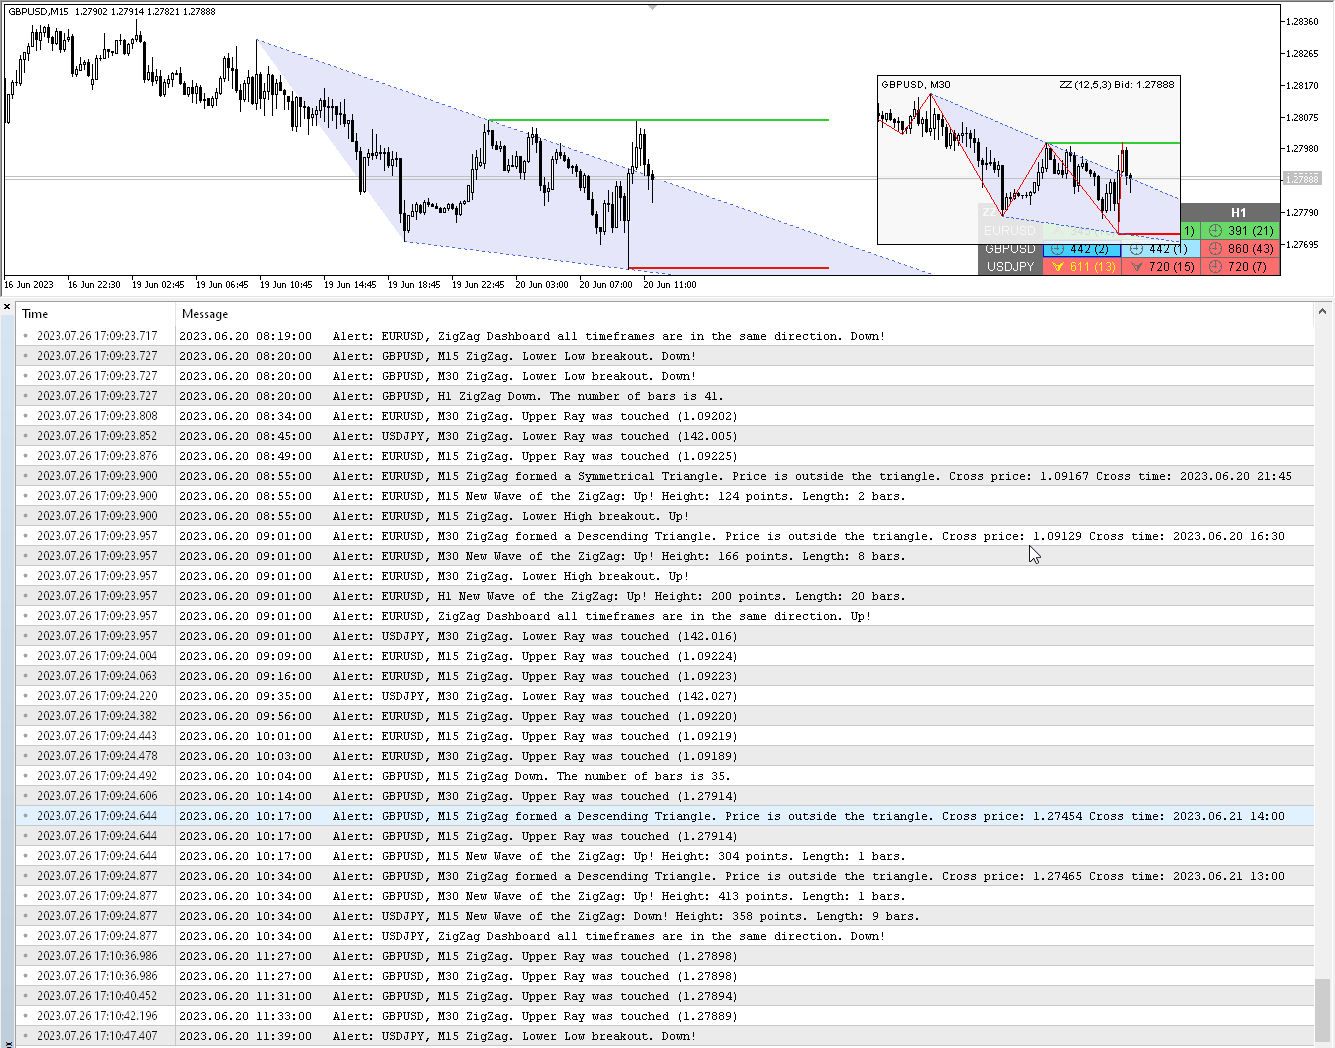
Multicurrency and multitimeframe modification of the ZigZag indicator. Displays the current direction of the market, the height of the last movement, the number of bars in this movement and the breaking of the previous point of the ZigZag (horizontal line). This is MTF Scanner, you can actually see the supply and demand levels.
You can specify any desired currencies and timeframes in the parameters. Also, the panel can send notifications when the ZigZag changes direction or when there was a breakthrough of the previous point. By clicking on a cell with a period, this symbol and period will be opened. Indicator – connects key lows and highs to show trend lines.
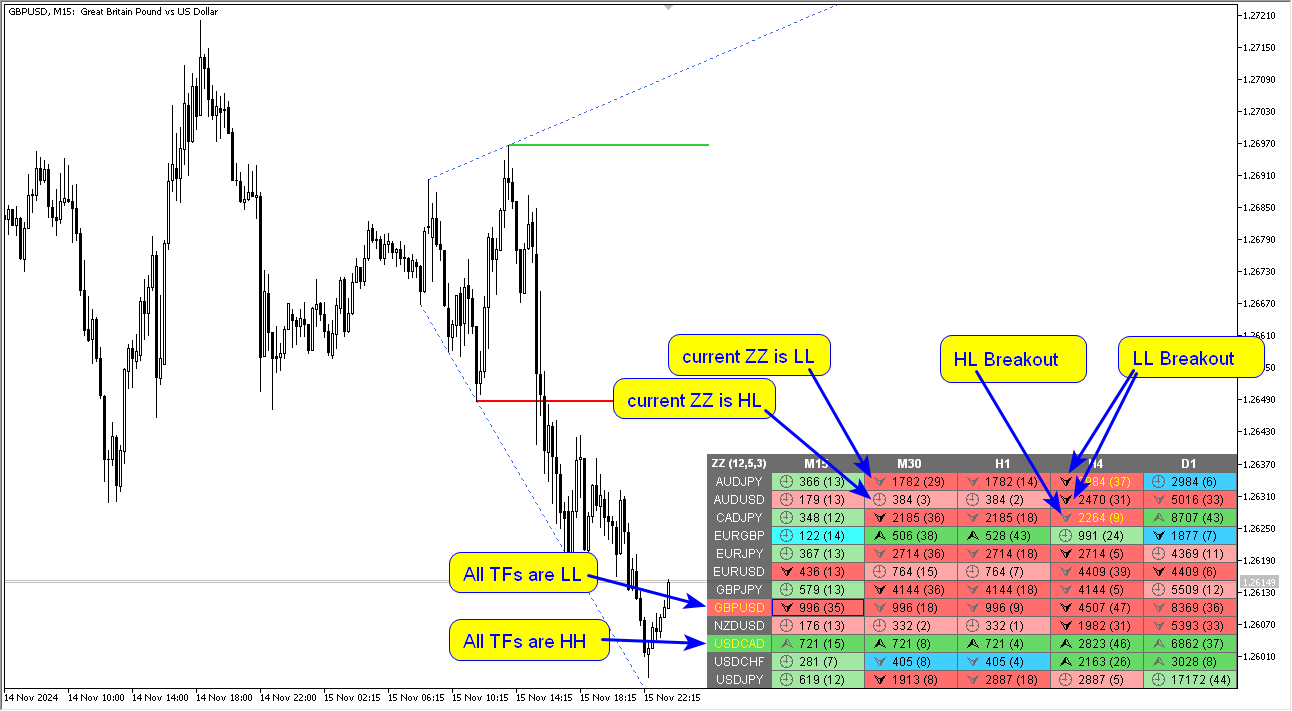
You can also use it as indicator for the Break of Structure (BOS) & Market Structure Shift (MSS)
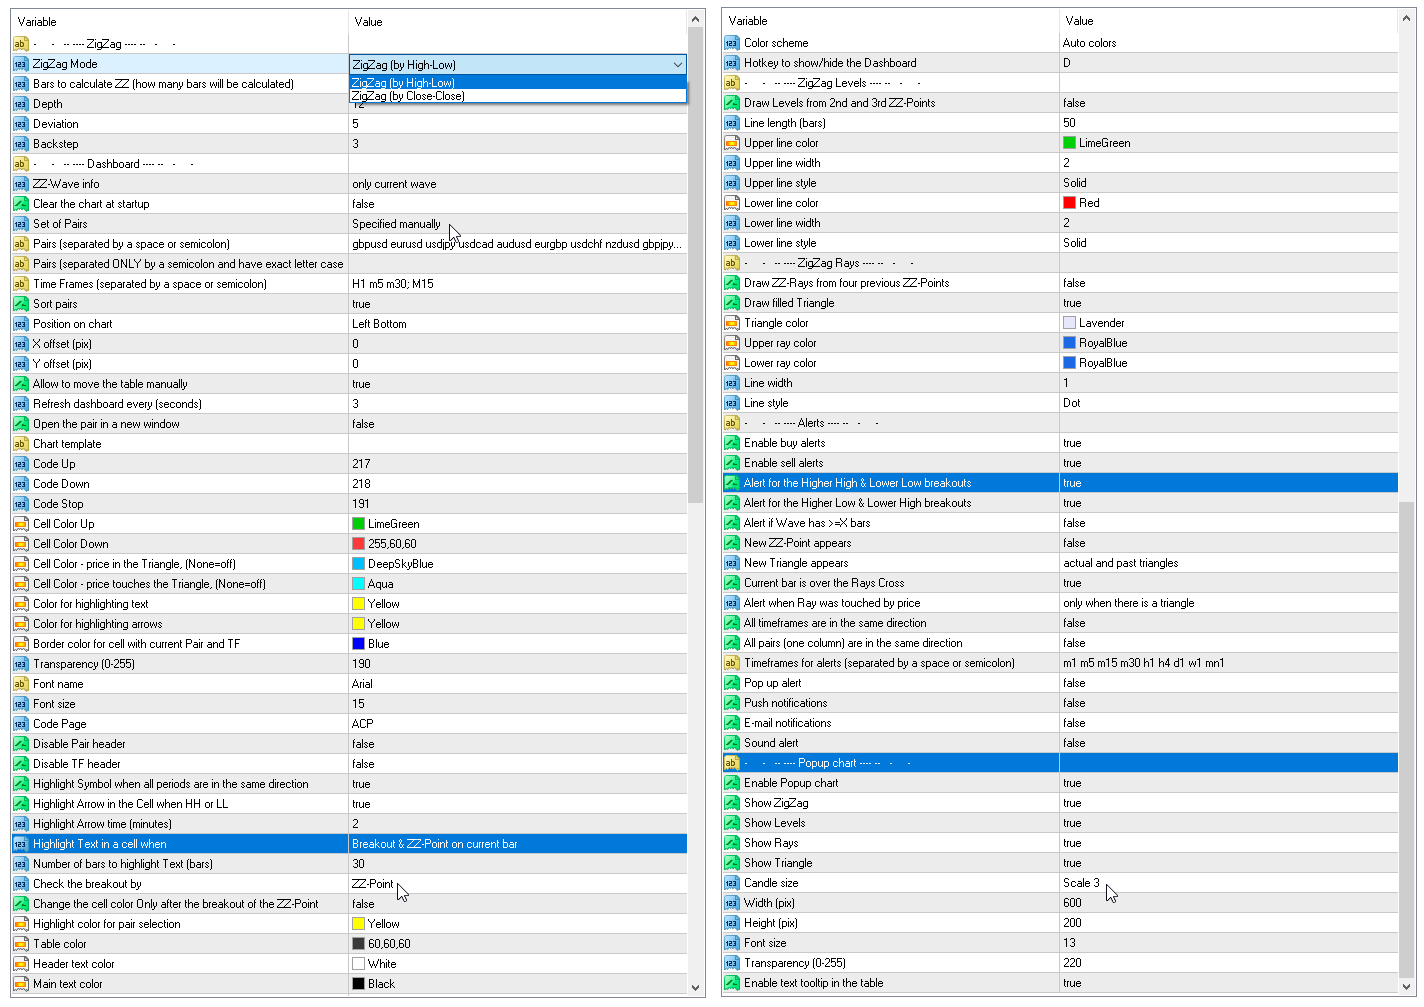
Parameters
Depth — the minimum number of candlestick, for which Zigzag will not draw the second maximum (or minimum), if the last one is Deviation less (or greater) than the previous one;
Deviation — the minimum number of points between the Highs/Lows of two adjacent candlesticks for the Zigzag to form a local top/bottom;
Backstep — the minimum number of candlesticks between the local Highs/Lows;
Bars to calculate ZZ — the number of bars in the history for finding ZigZag points.
ZZ-wave info — what information about the wave, to show in the table — only the current wave or the current + previous one;
Show the Reverse Move — adds to the table the reverse movement. This shows the reverse price movement from the ZigZag point. This value can be in points (ZZ-point minus Bid) or in percentage (the ratio of ZZ-length to the Reverse Move);
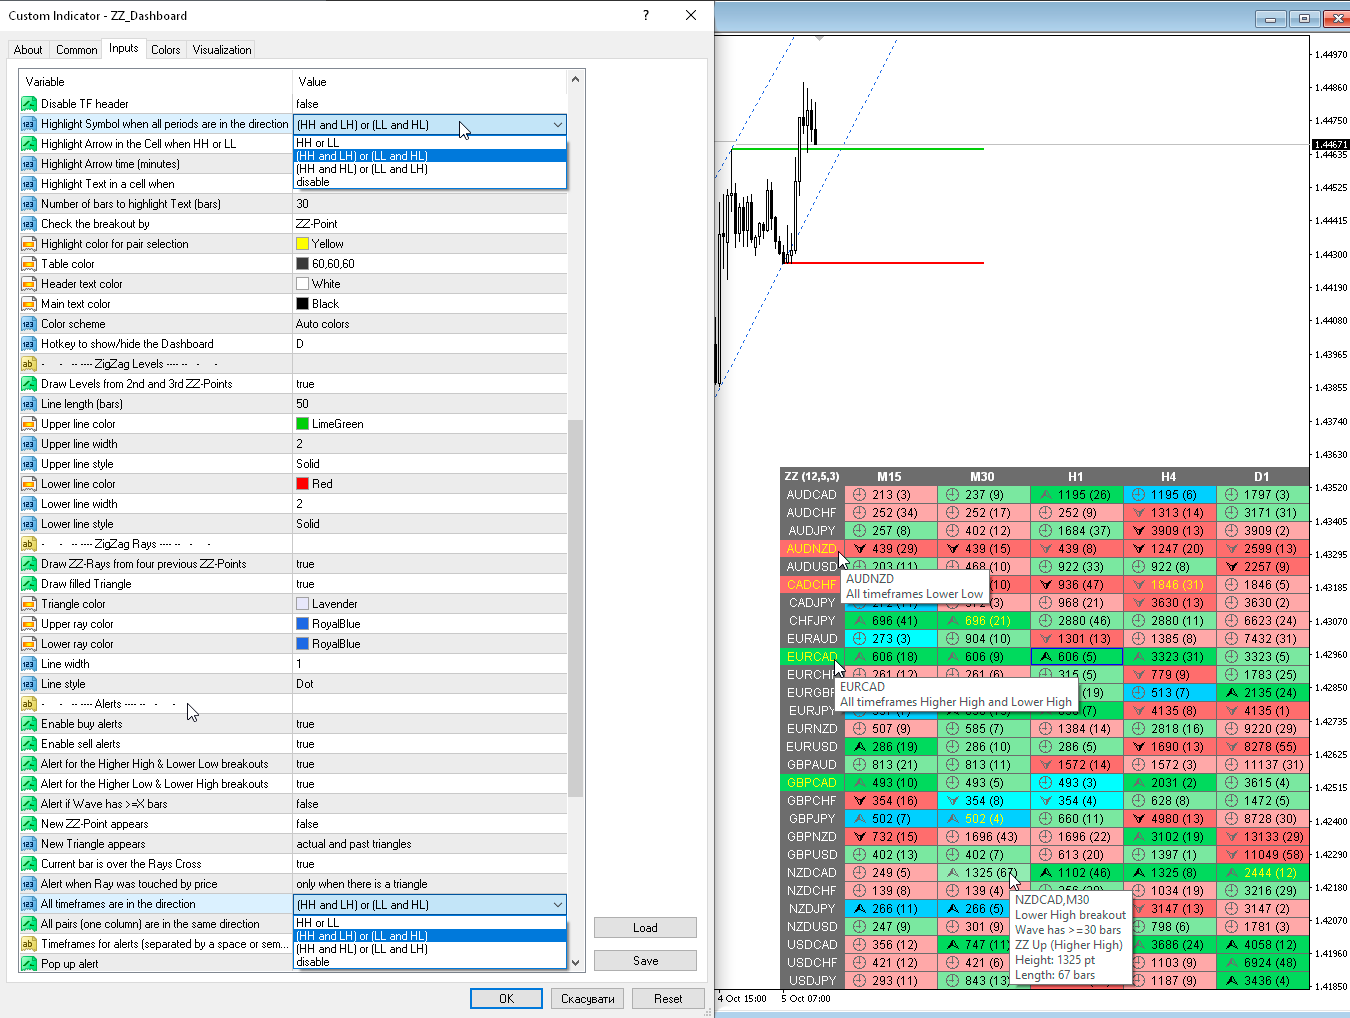
Highlight the symbol when all periods are in the same direction (HH HL LH LL):
— HH or LL — when Higher High or Lower Low;— (HH and LH) or (LL and HL) — when (Higher High and Lower High) or (Lower Low and Higher Low);— (HH and HL) or (LL and LH) — when (Higher High and Higher Low) or (Lower Low and Lower High);— disable.
Symbol highlight time (minutes, 0-until the direction changes);
Highlight Text in a cell when:
Highlight Text in a cell when:
— Wave has >=X bars — highlight cells in which the number of bars is greater than or equal to X;
— Breakout & ZZ-pt on current bar — highlight cells when the previous ZigZag point is broken (the ZZ-point is on the current bar);
— ZZ-pt on current bar — highlight cells when a ZZ-point appears on the current bar. The new or changed wave;
— Price touched ZZ-Ray — highlight cells when the ZigZag ray is touched by the price;
— disable - disable cell highlighting.
Number of bars in ZZ-wave for highlighting Text (bars) — how many bars should be in the ZigZag wave to highlight the cell;
Check the breakout by:
Check the breakout by:
— ZZ-Point — check by price of ZigZag point;— closed bars — check by bar closing price.
Clear the chart at startup — hide bars and grids on the chart.
Set of Pairs — set of symbols
Set of Pairs — set of symbols
— Market Watch — pairs from the "Market Watch". Do not use too many symbols, this may cause the indicator to slow down;
— Specified manually — pairs specified manually, in the parameters "Pairs";
— Current pair;
Pairs (separated by a space or semicolon) — list of symbols separated by spaces or semicolons. The currency names should be written exactly like the broker's, keeping the case and prefix/suffix.
Time Frames (separated by a space or semicolon) — list of timeframes separated by spaces or semicolons (multi timeframe).
Sort pairs — sorting the list of pairs.
Position on chart — corner to display the panel on the chart.
X offset (pix) — shift the panel along the X axis;
Y offset (pix) — shift the panel along the Y axis;
Refresh dashboard every (seconds) — update period for all pairs and timeframes.
Open the pair in a new window — open a symbol in a new chart window by clicking.
Chart template — the name of the template for the chart, if the chart opens in a new window.
Color Up — cell color if the indicator increases.
Color Down — cell color if the indicator decreases.
Color Highlight — text highlight color.
Transparency (0-255) — transparency of the panel.
Font name.
Font size.
Alerts
Timeframes for alerts (separated by a space or semicolon) — list of periods for which the alert will be sent (separated by a space or semicolon).
Alert if wave has >= X bars — alert if the ZigZag wave has a number of bars greater than or equal to X.
Alert for the Higher High & Lower Low breakouts — alert if the previous HH or LL is broken ( Market Structure Shift (MSS) ).
Alert for the Higher Low & Lower High breakouts — alert if the previous HL or LH is broken ( Break of Structure (BOS) ).
New ZZ-Point appears — alert if a new ZigZag point appears.
New Triangle appears.
Current bar is over the Rays Cross.
Alert when Ray was touched by price.
All timeframes are in the same direction.
All pairs (one column) are in the same direction.
All timeframes are in the same direction — alert when all timeframes are in the same direction.
All pairs (one column) are in the same direction.
Pop up alert — MT alerts.
Push notifications.
E-mail notifications.
Sound alert.


The developer is simply incredible! There aren’t many words—just amazing results. I've purchased many of his products—each one better than the last. The support is fantastic. If someone wants a serious “view” of the market, these are the ultimate tools! A thousand thanks, Taras! Keep up the great work!