Doji Engulfing Paths
- Indicadores
- Versión: 1.1
- Activaciones: 5

Presentación
Doji Engulfing Paths permite obtener señales y datos sobre los patrones doji y engulfing en los gráficos. Esto hace que sea posible obtener oportunidades de las tendencias, y seguir los movimientos direccionales para obtener algunos beneficios en los mercados de divisas y acciones.
Es una buena ventaja para aprovechar todas las oportunidades que aparecen con señales de inversión y señales directas con el fin de obtener algunos beneficios en el mercado de divisas.
Características del sistema
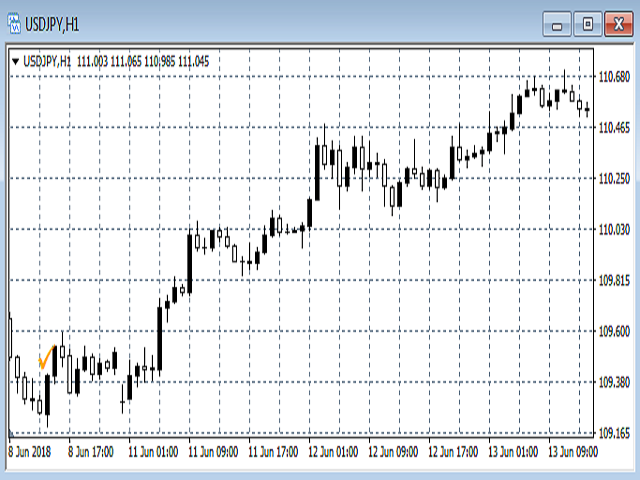
Con una ejecución rápida, permite registrar directamente la información sobre los nuevos patrones doji en un gráfico y comienza con la última vela disponible antes de la vela o barra actual en el gráfico.
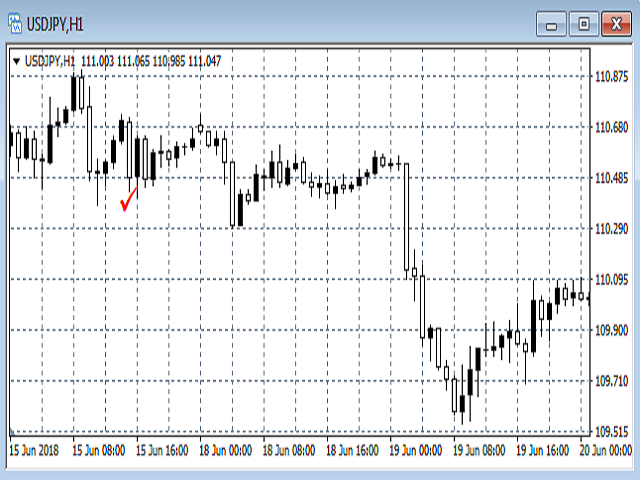
La utilidad muestra una señal en el gráfico para indicar dónde se encuentra el doji en este gráfico.
Permite obtener las mismas funciones con los patrones engulfing: puede indicar con precisión con un objeto gráfico y una señal en el gráfico las posiciones de los nuevos patrones engulfing.
Recomendaciones
En primer lugar, seleccione el número máximo de velas y barras anteriores a mostrar en el gráfico.
El máximo es de 1000 desplazamientos de barras, anteriores a la barra actual. El resultado será la visualización de las posiciones exactas de dojis y patrones engulfing en los gráficos técnicos.
Adición especial
El Doji Engulfing Paths es una utilidad que puede ejecutarse independientemente de otros EAs e indicadores disponibles y adicionales en la lista de gráficos seleccionada.
Permite seguir la dirección de la tendencia y seleccionar los niveles de entrada para las inversiones de los instrumentos disponibles y el período de tiempo correcto con los marcos temporales. Por ejemplo, cuando aparece un doji en una tendencia alcista, es el periodo de tiempo adecuado para buscar una inversión y abrir una posición corta en el instrumento.
De acuerdo con las instrucciones, cuando se produce un patrón envolvente en una tendencia alcista y con la misma dirección, es posible continuar el movimiento direccional e ir a abrir una posición larga en este movimiento de tendencia.
Se supone que esto permite obtener beneficios en el mercado de divisas.
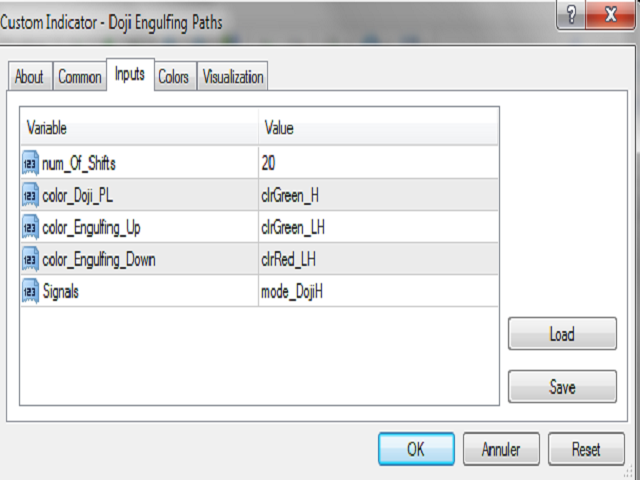
Entradas
- num_Of_Shifts: número de barras a mostrar
- color_Doji_PL: color de la señal para tendencias alcistas y bajistas con dojis
- clr_Green_H
- clr_Aqua_H
- clr_Orange_H
- clr_Beige_H
- clr_Violet_H
- color_Engulfing_Up: color de las señales para tendencias alcistas con engulfings
- clr_Green_H
- clr_Aqua_H
- clr_Orange_H
- clr_Beige_H
- clr_Violet_H
- color_Engulfing_Down: color de las señales para tendencias bajistas con engulfings
- clr_Red_LH
- clr_Yellow_LH
- clr_LightViolet_LH
- clr_Magenta_LH
- clr_LightYellow_LH
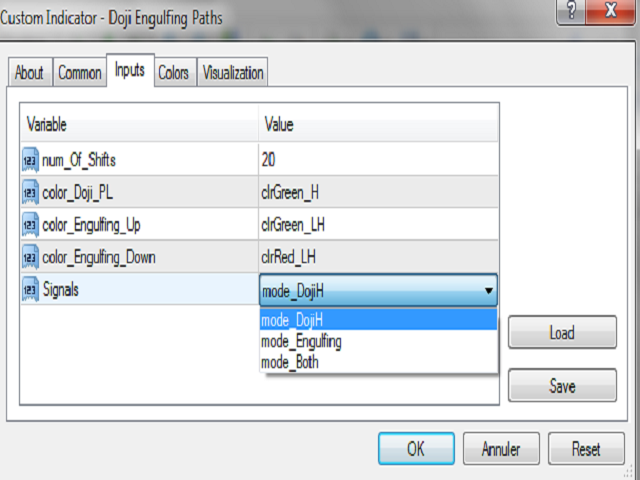
- Señales: lista de señales a mostrar, sólo dojis, sólo engulfing, o ambos sistemas
- mode_Doji_H: sólo dojis
- mode_Engulfing_Up: sólo engulfing en direcciones ascendentes
- mode_Engulfing_Down: sólo engulfing en direcciones bajistas