SyntheticIndices
- Indicadores
-
Stanislav Korotky
 Trading is just my hobby. I'm working in IT industry. So developement of experts, indicators, and script is not a problem at all to me. Wide range of technologies are used: MQL4, MQL5, system and applied programming, web-services, neural networks and more.
New: - Versión: 2.0
- Activaciones: 5
El indicador compara las cotizaciones de un símbolo determinado y una cotización sintética calculada a partir de dos símbolos de referencia especificados. El indicador es útil para comprobar el comportamiento de los símbolos Forex a través de los índices bursátiles correspondientes y detectar su convergencia/divergencia, lo que puede pronosticar futuros movimientos de precios.
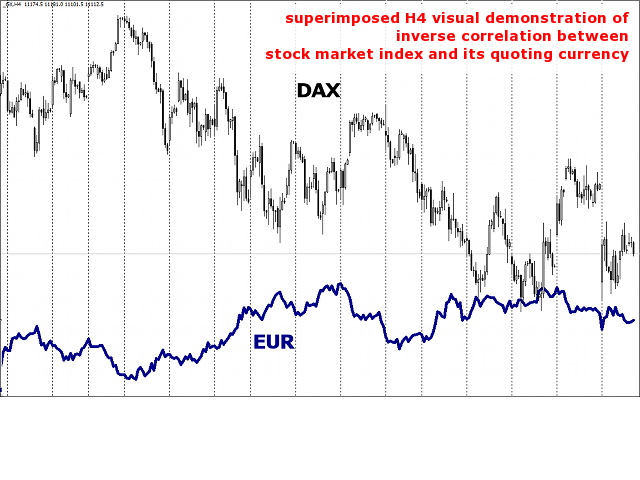
La idea principal es que todos los índices bursátiles cotizan en determinadas divisas y, por lo tanto, muestran correlación con los pares de divisas en los que se utilizan estas divisas. Cuando los creadores de mercado deciden "comprar" uno u otro índice bursátil, venden la divisa en la que cotiza el índice. Por ejemplo, la tendencia alcista del S&P500 suele verse confirmada por la tendencia bajista del USD. Y del mismo modo, el USD suele crecer cuando el S&P500 y otros índices americanos caen (puede decirse que la gente va al contado). Esto se ilustra en el primer gráfico siguiente con la superposición del DAX y el EUR (nótese que se trata del EUR, no del EURUSD ni de ningún otro par que contenga EUR).
El indicador calcula el tipo sintético entre dos índices bursátiles y lo compara con un tipo simbólico real. Por ejemplo, en el caso de EURUSD se puede elegir DAX vs S&P500, o CAC40 vs Dow Jones para el análisis. S&P500 representa S&P500/USD en términos de Forex, y DAX es el par DAX/EUR. Así, la relación de estos dos índices forma un tipo alternativo de EUR/USD. El indicador muestra este sintético como tal (el parámetro ScalingPeriod se establece en 0, véase más abajo) o como valores normalizados respectivamente a la media móvil especificada (ScalingPeriod supera 0). Pero lo más importante es que estos valores normalizados de un símbolo estándar de Forex y su análisis sintético se muestran uno al lado del otro demostrando las fases de convergencia y divergencia.
El indicador funciona bien con estrategias como el comercio de pares y la cobertura: el comercio del par de divisas en la dirección de la sintética, y, opcionalmente, el comercio de índices en la dirección opuesta.
Parámetros
- SymbolList - la lista de símbolos a analizar, representados como tripletas: "ReferenciaA1/ReferenciaA2=SímboloRealA;ReferenciaB1/ReferenciaB2=SímboloRealB;..." etc.las tripletas están separadas por ";", número máximo de tripletas - 5; en cada tripleta, ReferenceX1 es un nombre de índice, correspondiente a la segunda divisa (cotización) del RealSymbolX, y ReferenceX2 es un nombre de índice, correspondiente a la primera divisa (base) del RealSymbolX; por ejemplo, para el análisis EURUSD se puede especificar "S&P500/DAX=EURUSD", o "NQ/FDAX=EURUSD", o "DJI/STOXX50=EURUSD"; en la pestaña Comentarios se ofrecen ejemplos de configuración para las principales divisas;
- Smoothing - periodo de media móvil aplicado en la curva sintética para el suavizado (por defecto - 5);
- ScalingPeriod - periodo de media móvil para la normalización relativa, el valor por defecto es 21; 0 significa tasa cruzada sin normalización - es aplicable si sólo se da un par de referencia, por ejemplo, SymbolList="NQ/FDAX";
- ScalingMethod - modo de media móvil, el valor por defecto es MODE_EMA;
- ScalingPrice - precio de la media móvil, el valor por defecto es PRICE_CLOSE;
- RangingPeriod - periodo para el cálculo del rango medio de todas las líneas visibles (mostradas como líneas de puntos grises);
Si no se especifican índices, el indicador emite pistas para las principales divisas Forex en el registro.
Los tickers de los índices de mercado especificados en las entradas deben estar disponibles en Market Watch. El indicador funciona únicamente con las cotizaciones estándar de su broker y no solicita ningún servicio externo.