M15 Indicator
- Indicadores
- Versión: 4.8
- Actualizado: 20 abril 2020
- Activaciones: 5

Dado que un precio plano se mantiene dentro del mismo rango y apenas se mueve, una tendencia horizontal o lateral puede afectar negativamente a la posición de la operación.
Un precio plano también puede referirse a una operación en la que el par de divisas no se ha movido significativamente hacia arriba o hacia abajo y, por lo tanto, no tiene grandes ganancias o pérdidas atribuidas a la posición de negociación dedivisas.
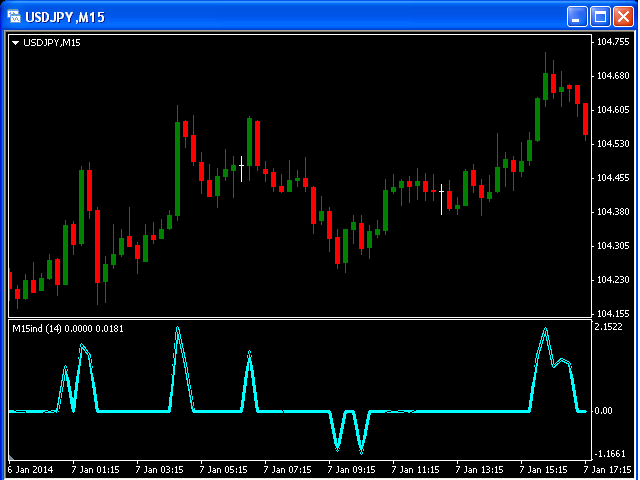
Este indicador se ha creado para un marco temporal M15.
La Línea Cero significa un mercado plano.
Los impulsos positivos y negativos indican los movimientos Largo y Corto en consecuencia.