MTF CCI withTrigger
- Indicadores
- Versión: 3.5
- Actualizado: 20 abril 2020
- Activaciones: 5

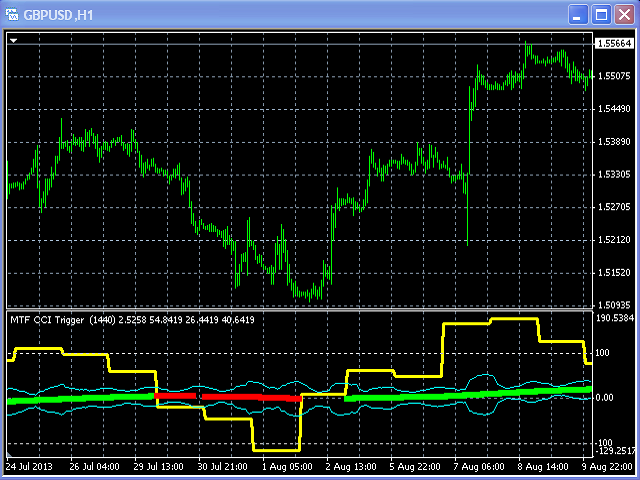
Indicador Multi TimeFrame "MTF CCI Trigger" basado en el Commodity Channel Index del TF superior (parámetro de entrada "TimeFrame") línea amarilla.
La línea aguamarina representa las envolventes ATR del TF actual.
Las flechas verdes y rojas son activadas por el CCI y representan tendencias ARRIBA y ABAJO.