Tick by Tick
- Indicadores
- Versión: 4.9
- Actualizado: 20 abril 2020
- Activaciones: 5

Un tick es una medida del mínimo movimiento al alza o a la baja en el precio de un valor. Un tick también puede referirse al cambio en el precio de un valor de una operación a la siguiente.
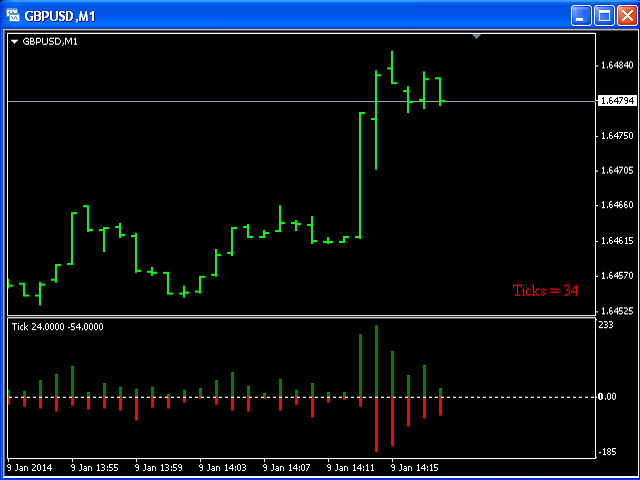
Este indicador mostrará cantidades de ticks cuando el precio suba o baje.
Este indicador está diseñado para el marco de tiempo M1 y muestra:
- Suma de puntos cuando el precio sube (Histograma Verde).
- Suma de puntos cuando el precio baja (Histograma Rojo).