MTF ADX with Histogram
- Indicadores
- Versión: 4.8
- Actualizado: 24 abril 2020
- Activaciones: 5

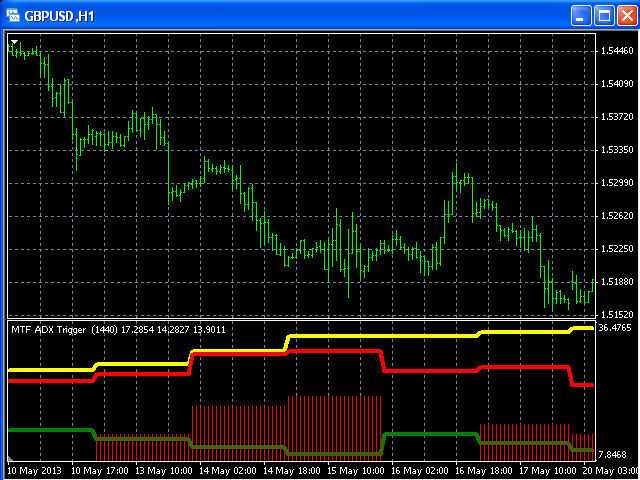
El indicador Multi TimeFrame MTF ADX con Histograma muestra los datos del indicador ADX desde el TF de su elección.
Puede elegir un TimeFrame igual o superior al TF actual.
- La línea amarilla representa la tendencia del precio desde el TF superior.
- La línea verde representa +DI desde el TF superior.
- La línea roja representa -DI desde el TF superior.
- El histograma verde muestra una tendencia alcista.
- El histograma rojo muestra una tendencia bajista.