Buy Sell Indicator
- Indicadores
- Versión: 4.6
- Actualizado: 22 septiembre 2022
- Activaciones: 5

Compre cuando el mercado esté bajando y venda cuando esté subiendo. Cuando el mercado esté bajando, empiece a observar y a buscar señales de compra. Cuando el mercado se está moviendo hacia arriba usted comienza a buscar señales de venta.
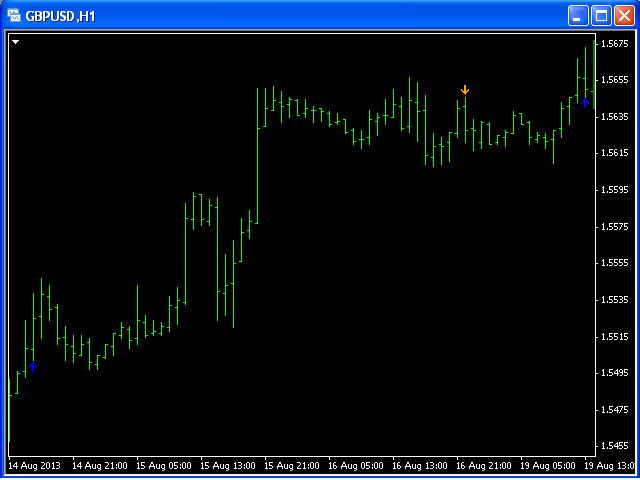
Este indicador señala los momentos para Comprar (flecha azul) y para Vender (flecha naranja).
Dos parámetros de entrada: barsNumber y paso para la optimización (dependiendo del símbolo y Time Frame).