CCI Envelopes
- Indicadores
- Versión: 2.9
- Actualizado: 20 noviembre 2021
- Activaciones: 5

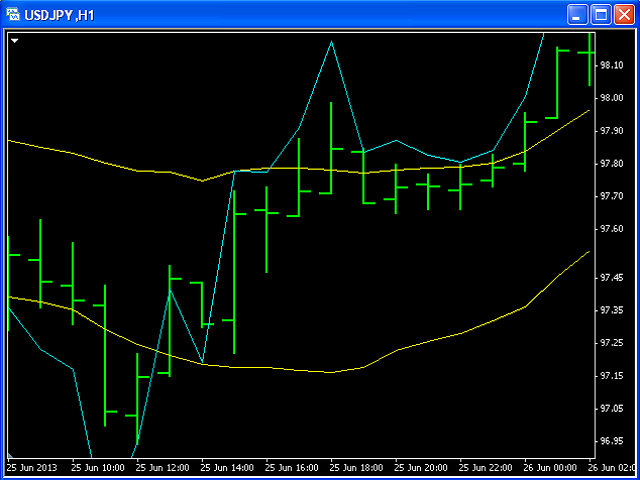
Dos líneas amarillas. Es similar al Envelopes clásico pero con desviación automática.
El indicador Envelopes esuna herramienta que trata de identificar las bandas superior e inferior de un rango de negociación.
Línea Aqua. Se trata de un Commodity Channel Index clásico añadido a las Envolventes en el gráfico, no en una ventana aparte.
El Commodity Channel Index (CCI) es unindicador técnico que mide la diferencia entre el precio actual y el precio medio histórico.