Moving Average Bars
- Indicadores
- Versión: 3.52
- Actualizado: 20 noviembre 2021
- Activaciones: 5

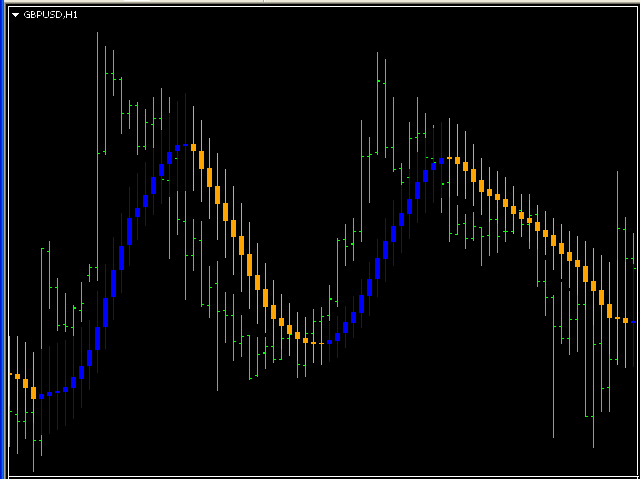
Moving Average Bars es un indicador autoexplicativo con un parámetro de entrada: nPeriod.
Cuando el precio de cierre anterior está por encima de la barra anterior del indicador, la probabilidad de ir en largo es muy alta.
Cuando el precio de cierre anterior está por debajo de la barra anterior del indicador, la probabilidad de ir en corto es muy alta.