M15 Indicator
- Indikatoren
- Version: 4.8
- Aktualisiert: 20 April 2020
- Aktivierungen: 5

Da ein flacher Kurs innerhalb der gleichen Spanne bleibt und sich kaum bewegt, kann sich ein horizontaler oder seitwärts gerichteter Trend negativ auf die Handelsposition auswirken.
Ein "Flat" kann sich auch auf einen Handel beziehen, bei dem sich das Währungspaar nicht signifikant nach oben oder unten bewegt hat und daher der Devisenhandelsposition kein großer Gewinn oder Verlust zugeschrieben wird.
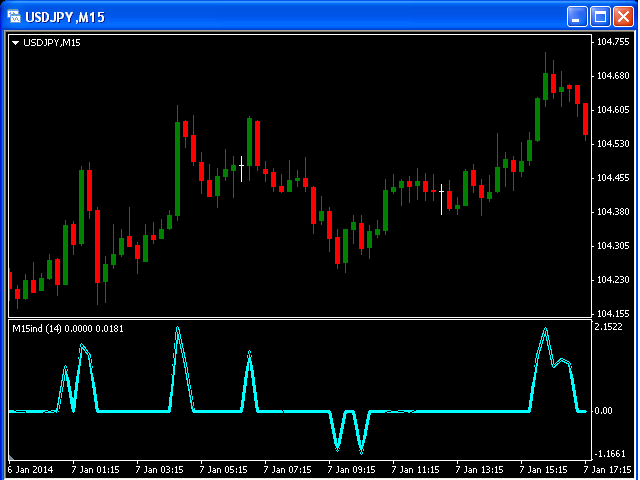
Dieser Indikator wurde für einen M15-Zeitrahmen erstellt.
Die Nulllinie bedeutet einen flachen Markt.
Die positiven und negativen Impulse zeigen entsprechend die Long- und Short-Bewegungen an.