Five CCIs Main Pairs
- Indicadores
- Versión: 5.42
- Actualizado: 23 marzo 2020
- Activaciones: 5

Este indicador se basa en dos ideas:
- Correlaciones entre 5 pares de divisas principales: EURUSD, GBPUSD, USDCHF, USDJPY, USDCAD;
- Índice del dólar estadounidense = valor del dólar estadounidense en relación con una cesta de divisas extranjeras.
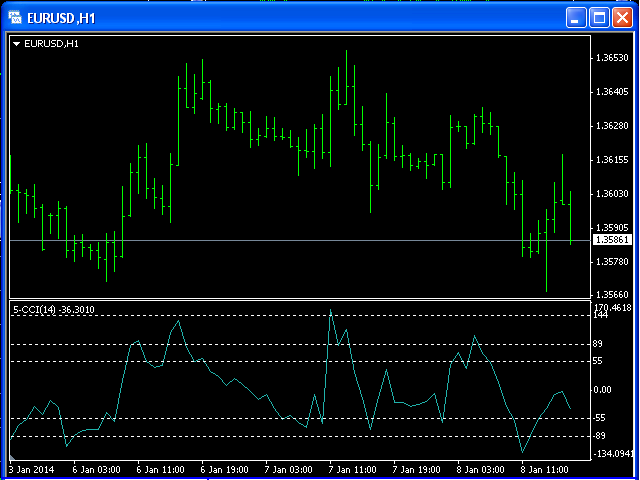
El uso del indicador es el mismo que el del indicador clásico Commodity Channel Index (CCI).
El CCI se calcula con la siguiente fórmula:(Precio típico - Media móvil simple) / (0,015 x Desviación media)
(Precio típico - Media móvil simple) / (0,015 x Desviación media)