Probability
- Indicadores
- Versión: 8.8
- Actualizado: 20 noviembre 2021
- Activaciones: 5

La probabilidad se refiere a la posibilidadde que ocurra un acontecimiento. La probabilidad en Forexindica una posibilidad en un momento determinado. Esto se debe a que el mercado de divisas es muy volátil, y predecir los acontecimientos futuros que le afectan es imposible.
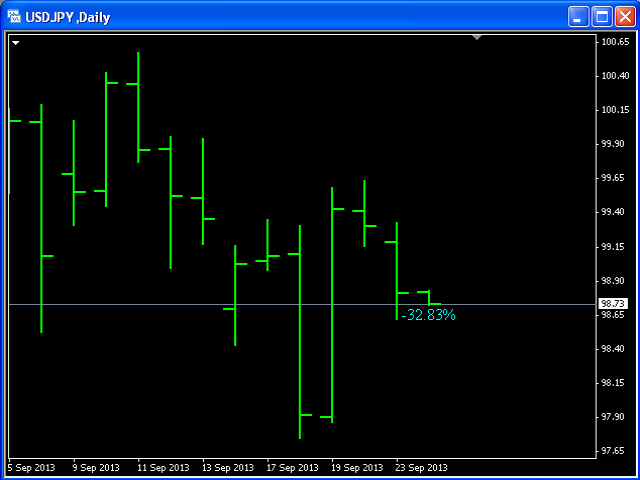
Este indicador mostrará un número positivo por encima del Máximo actual o un número negativo por debajo del Mínimo actual como probabilidad de la tendencia.
Los marcos de tiempo más altos generalmente muestran una probabilidad más alta, incluso más del 100%.
what do the settings mean?
q1qqqqq@gmail.com