All MT5 TimeFrames PSAR
- Indicadores
- Versión: 4.9
- Actualizado: 23 mayo 2020
- Activaciones: 5

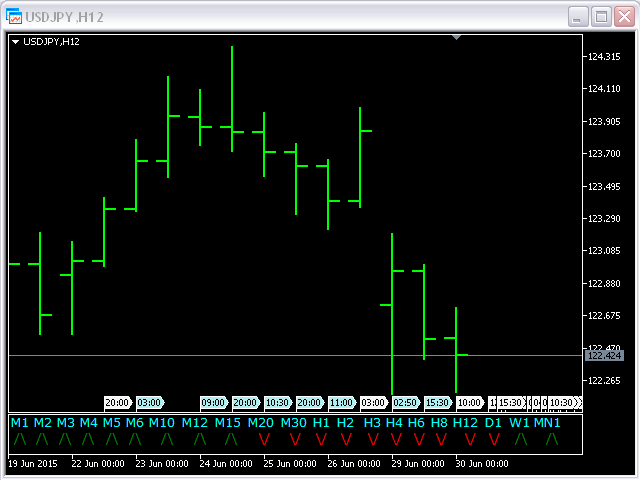
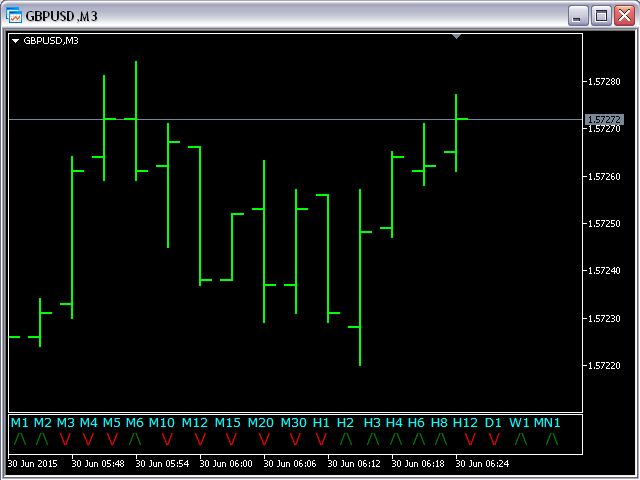
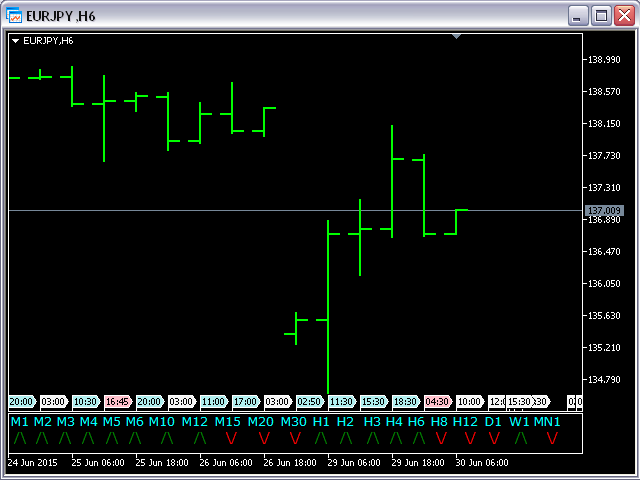
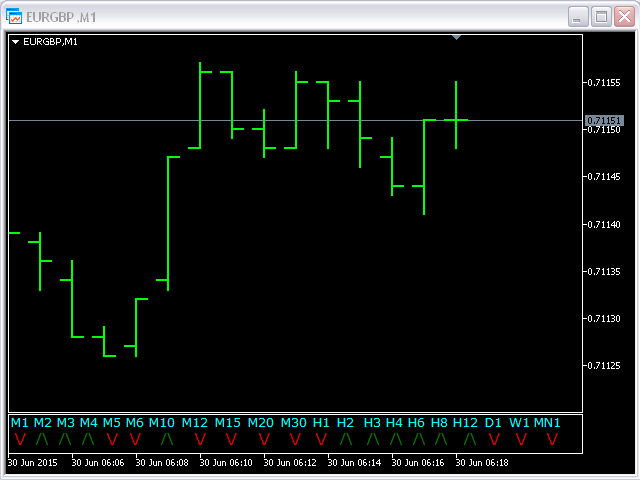
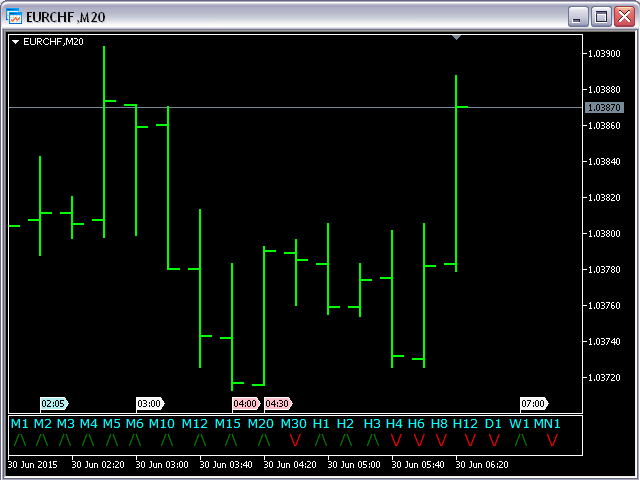
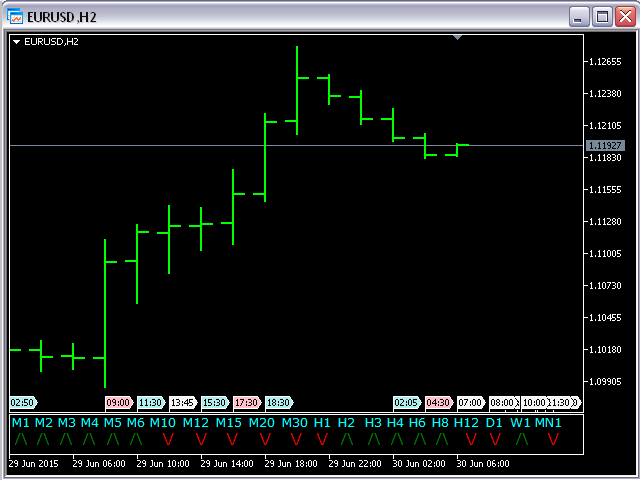
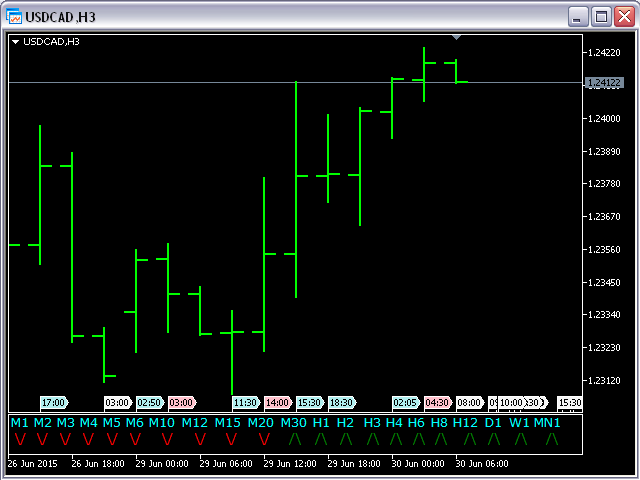
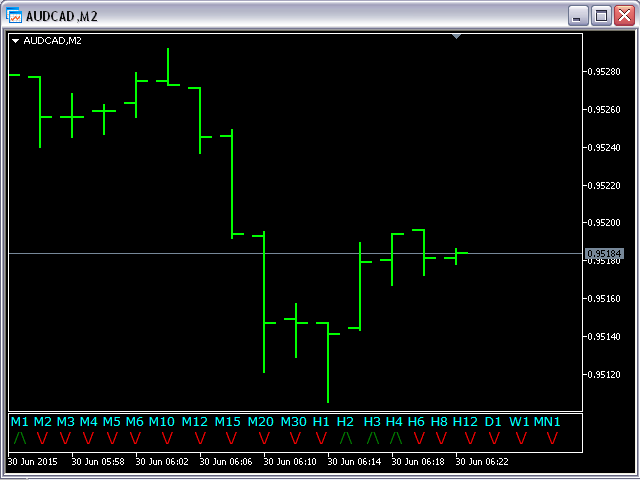
Este indicador se basa en el indicador clásico Parabolic SAR y será útil para aquellos que aman y saben cómo utilizar no una representación visual, sino digital del indicador. Todos los MT5 TimeFrames PSAR indicador muestra los valores de cada uno de los marcos de tiempo:
- M1, M2, M3, M4, M5, M6, M10, M12, M15, M20, M30, H1, H2, H3, H4, H6, H8, H12, D1, W1, Y MN1.
Podrá cambiar los principales parámetros de entrada de cada CCI para cada TF.
Ejemplo para M1
- sTF1___ = "M1";
- pPaso1 = 0.02;
- pMax1 = 0.2;
Parámetro de entrada:
- aColor = clrAqua; - Color de las etiquetas de los TFs
Nota
- Cuando se cambia el par de divisas para el gráfico abierto hay que esperar un par de segundos (Next Tick) para el recálculo.
- Antes de usar este indicador tiene que abrir todos los gráficos (todos los TFs) para los pares de divisas actuales.