All MT5 TimeFrames Stochastic
- Indicadores
- Versión: 5.9
- Actualizado: 18 noviembre 2021
- Activaciones: 5

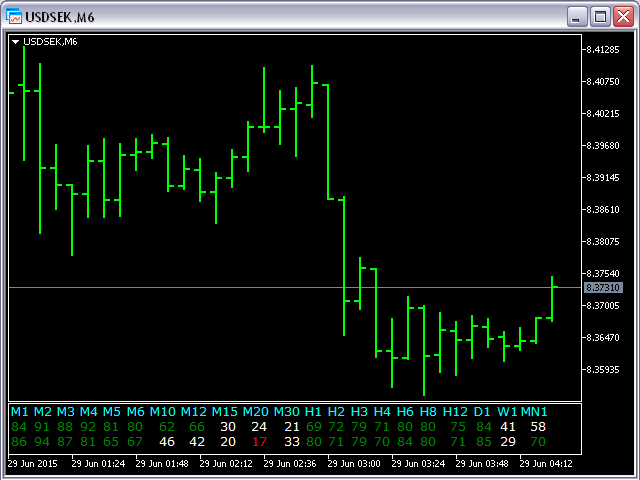
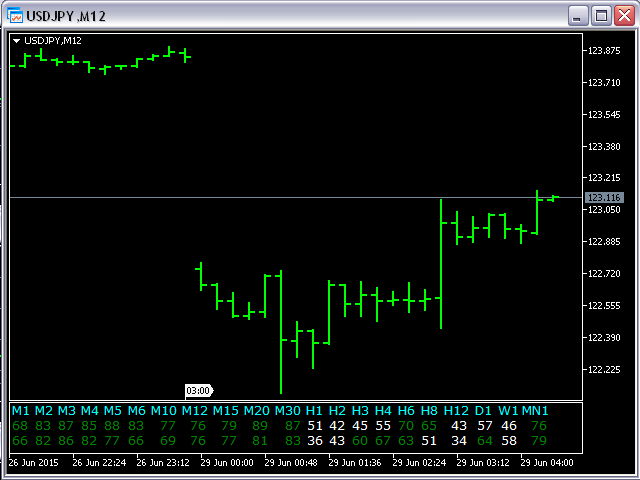
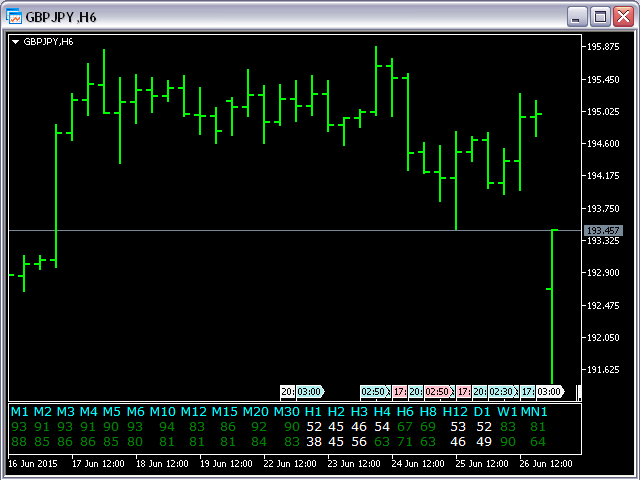
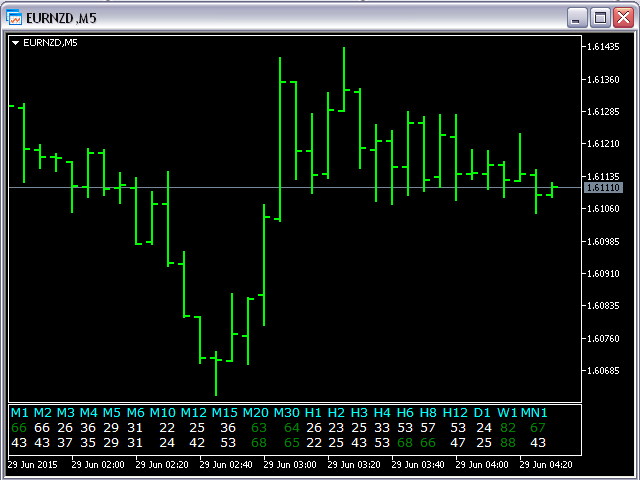
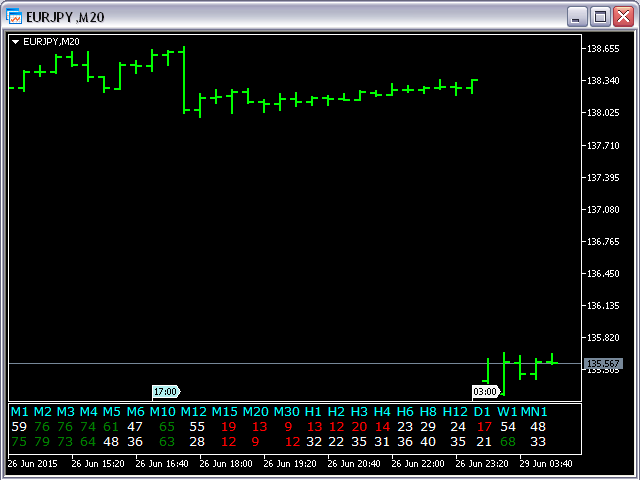
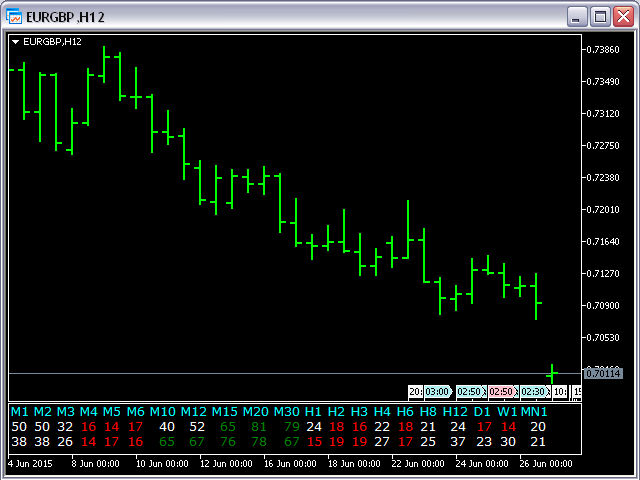
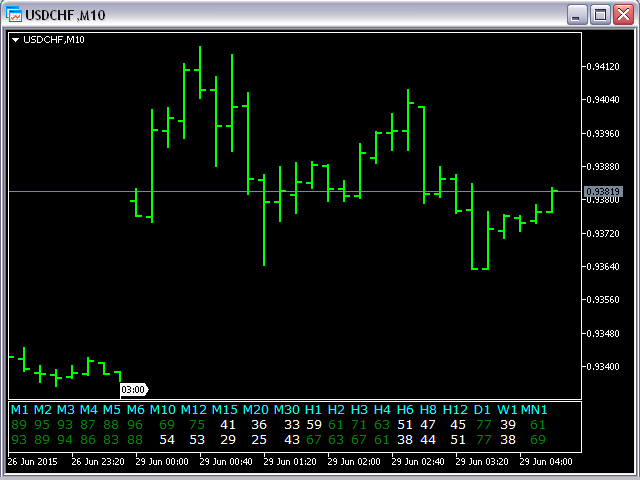
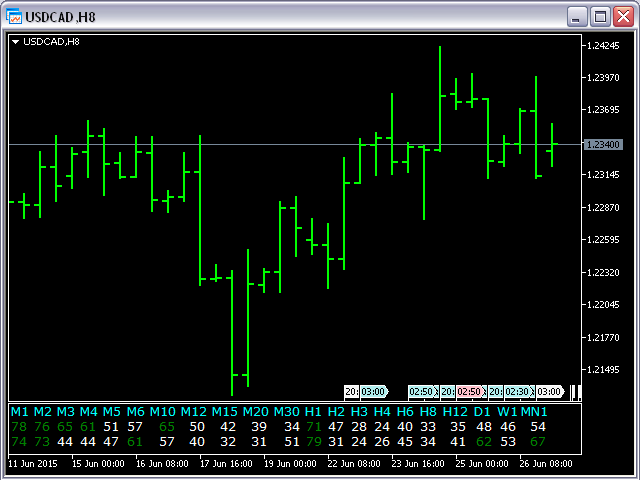
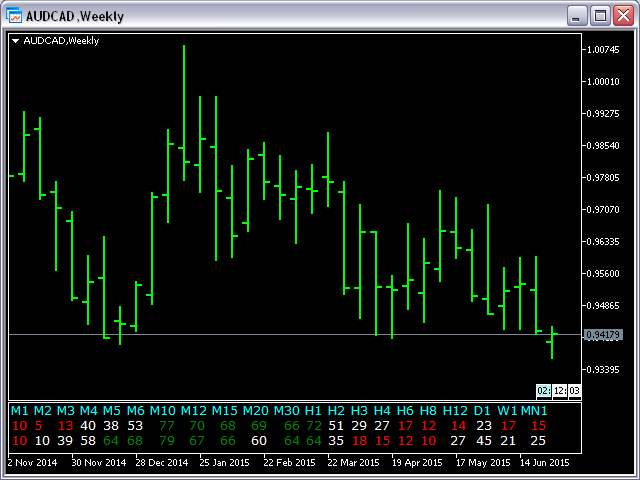
Este indicador se basa en el indicador clásico Estocástico y será útil para aquellos que aman y saben cómo utilizar no una representación visual, sino digital del indicador. Todos los MT5 TimeFrames indicador estocástico muestra los valores de cada uno de los marcos de tiempo:
- M1, M2, M3, M4, M5, M6, M10, M12, M15, M20, M30, H1, H2, H3, H4, H6, H8, H12, D1, W1, Y MN1.
Podrá cambiar los principales parámetros de entrada de cada Indicador para cada TF.
La primera línea de datos representa los cálculos principales del estocástico.
La segunda línea de datos representa los cálculos de la señal del estocástico.
Ejemplo para M1
- sTF1____ = "M1";
- K_Period1 = 5;
- D_Period1 = 3;
- S_Period1 = 3;
- Método1 = MODE_SMA;
- iPrice1 = STO_LOWHIGH;
Parámetros de entrada
- OverboughtLevel = 80; - Nivel de sobrecompra (todos los TFs) para estocástico
- OversoldLevel = 20; - Nivel de Sobreventa (todos los TFs) para Estocástico
- aColor = clrAqua; - Color de las etiquetas de los TFs
- wColor = clrWhite; - Color de los valores estocásticos digitales
Nota:
- Cuando se cambia el par de divisas para el gráfico abierto hay que esperar un par de segundos (siguiente tick) para el recálculo.
- Antes de utilizar este indicador tiene que abrir todos los gráficos (todos los TFs) para los pares de divisas actuales.