All MT5 TimeFrames PSAR
- Indikatoren
- Version: 4.9
- Aktualisiert: 23 Mai 2020
- Aktivierungen: 5

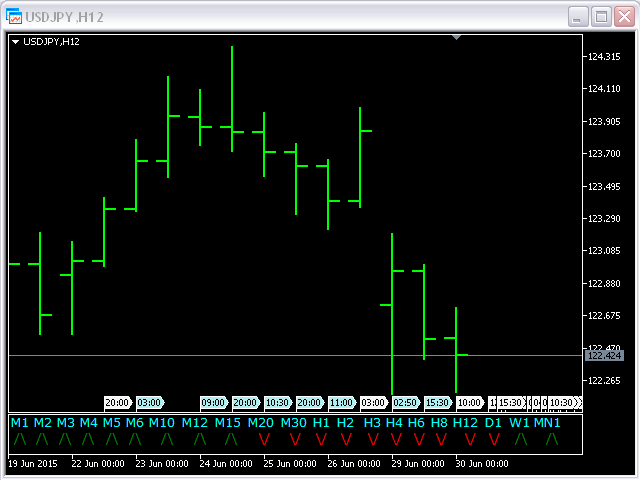
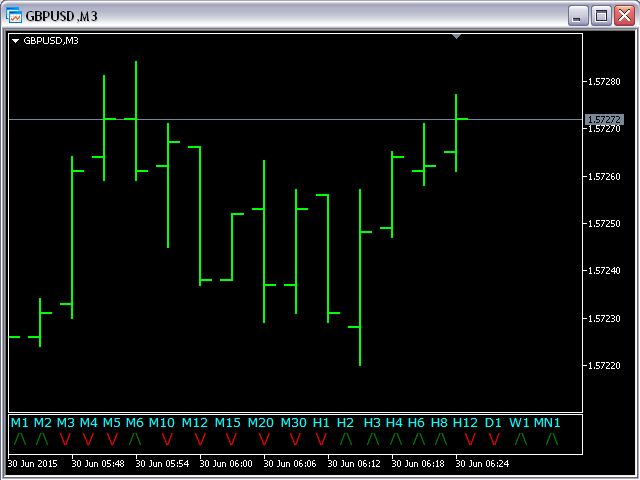
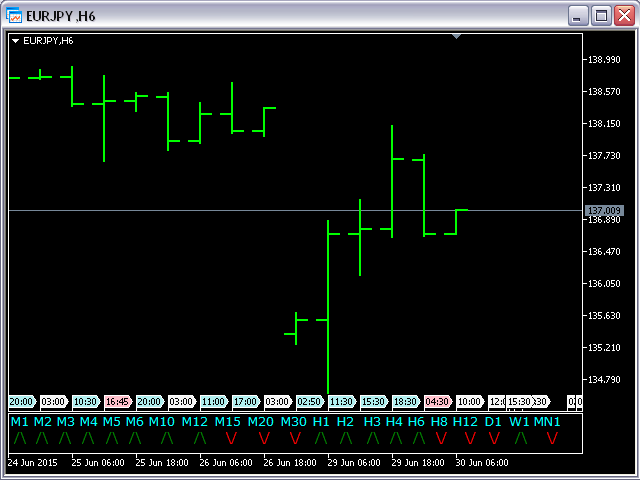
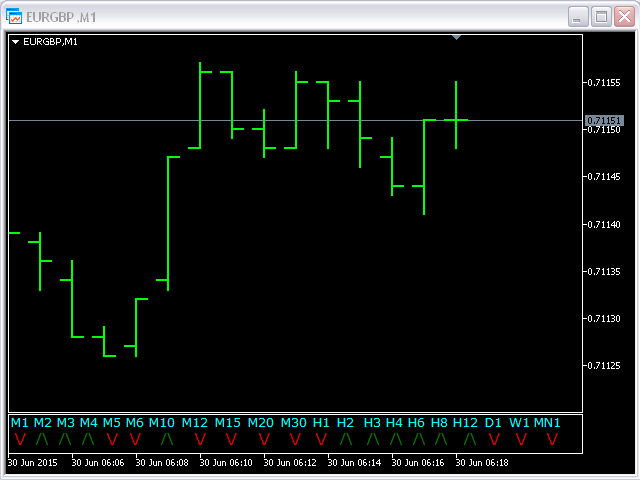
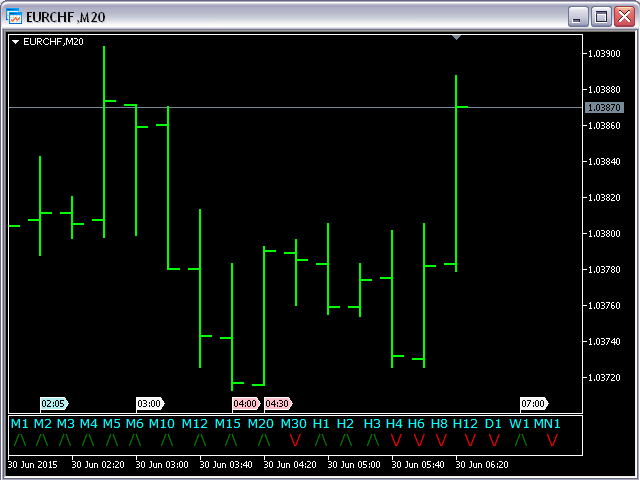
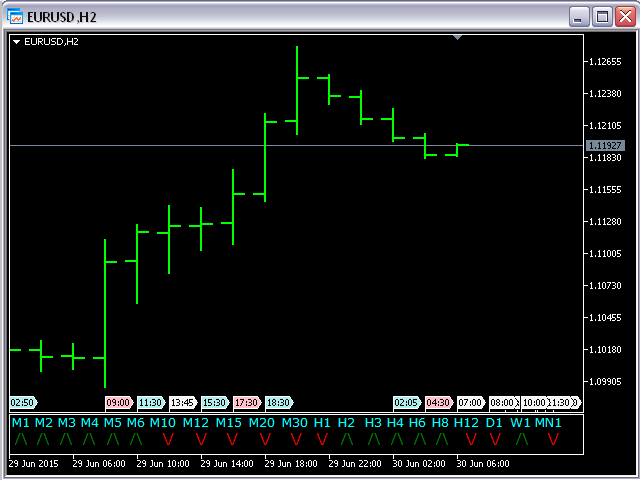
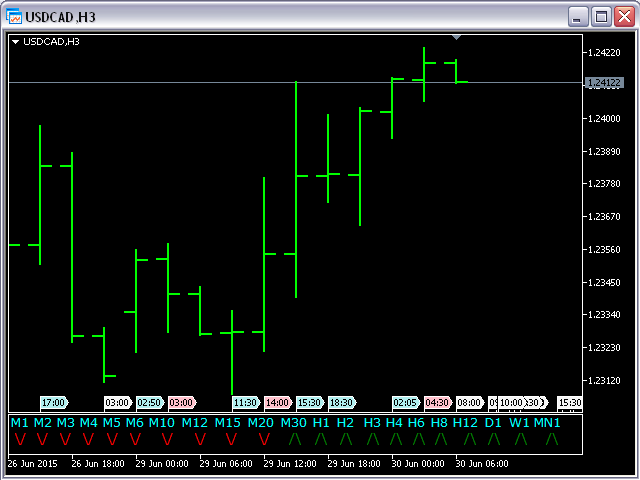
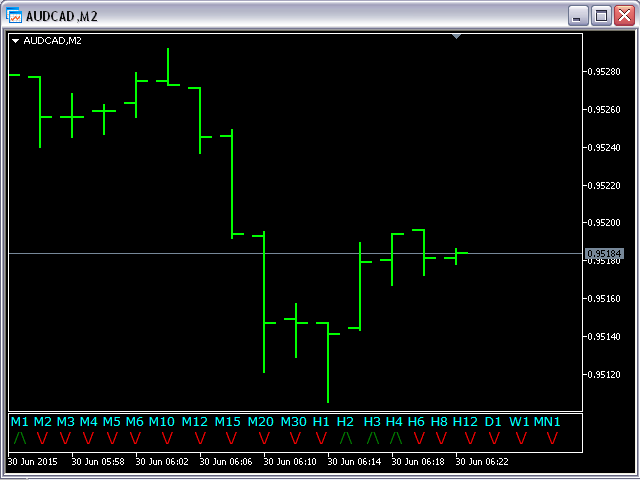
Dieser Indikator basiert auf dem klassischen Indikator Parabolic SAR und wird für diejenigen hilfreich sein, die es lieben und wissen, wie man nicht eine visuelle, sondern eine digitale Darstellung des Indikators verwendet. Alle MT5 TimeFrames PSAR-Indikator zeigt Werte aus jedem Zeitrahmen:
- M1, M2, M3, M4, M5, M6, M10, M12, M15, M20, M30, H1, H2, H3, H4, H6, H8, H12, D1, W1, UND MN1.
Sie können die wichtigsten Eingabeparameter für jeden CCI für jeden TF ändern.
Beispiel für M1
- sTF1___ = "M1";
- pStep1 = 0,02;
- pMax1 = 0,2;
Eingabeparameter:
- aColor = clrAqua; - Farbe für TFs Beschriftungen
Hinweis
- Wenn Sie das Währungspaar für den geöffneten Chart ändern, müssen Sie einige Sekunden (nächster Tick) auf die Neuberechnung warten.
- Bevor Sie diesen Indikator verwenden, müssen Sie alle Charts (alle TFs) für die aktuellen Währungspaare öffnen.