Nine Lives of RSA MT5
- Indicadores
- Versión: 4.2
- Actualizado: 18 noviembre 2021
- Activaciones: 5

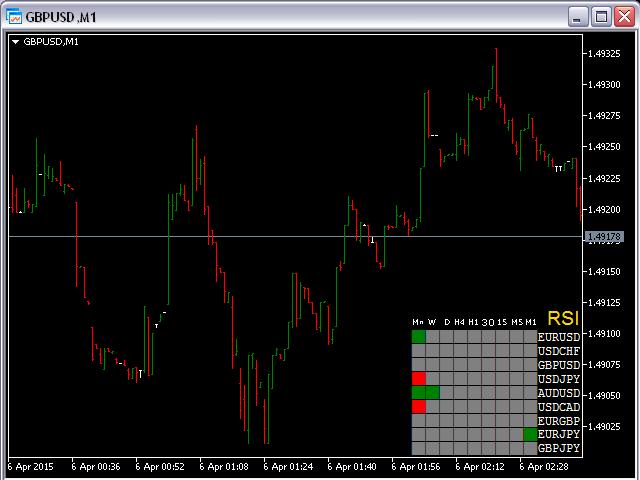
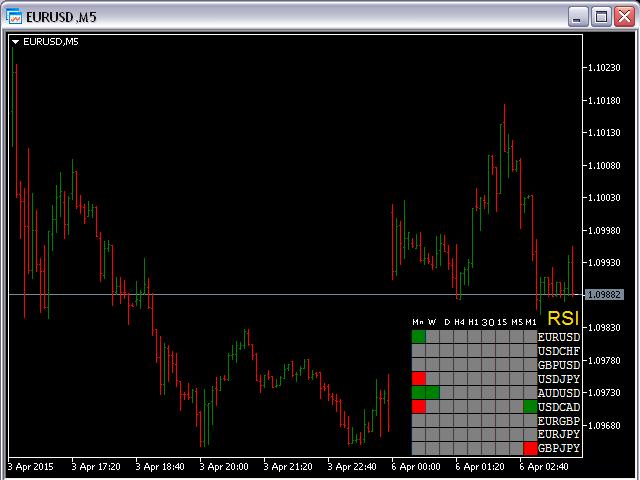
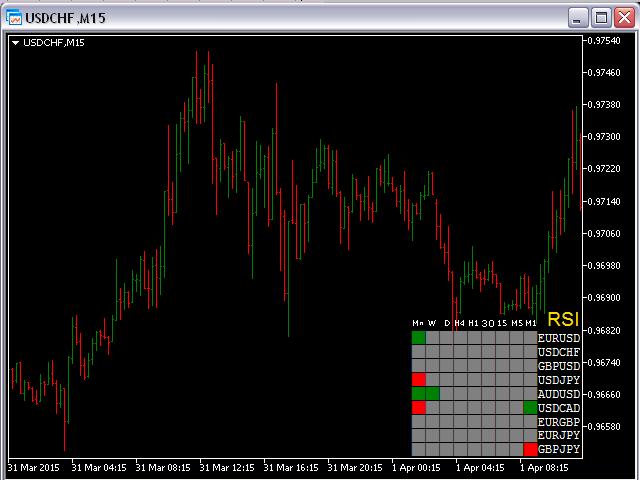
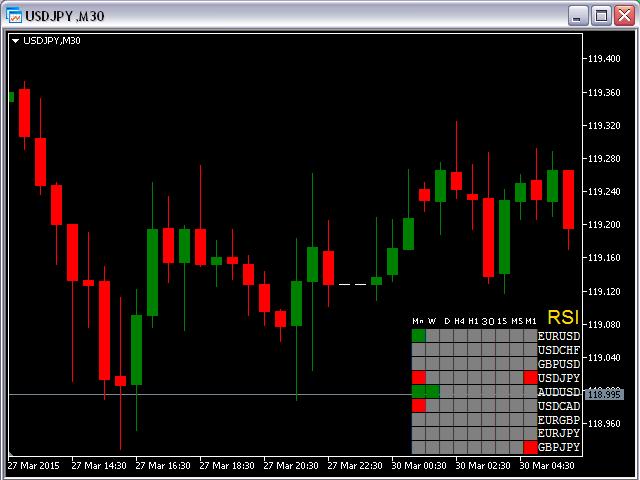
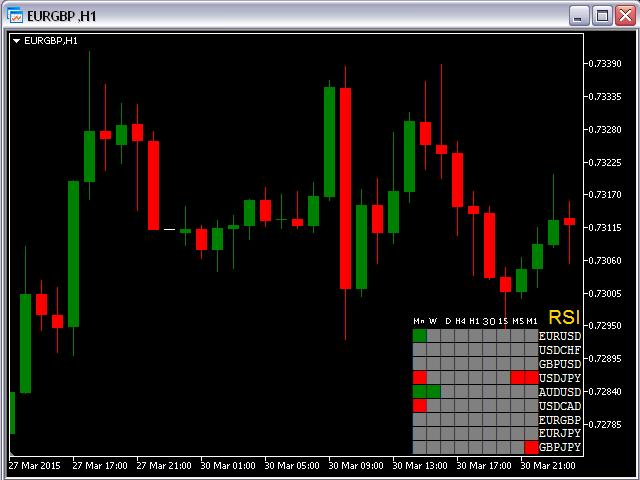
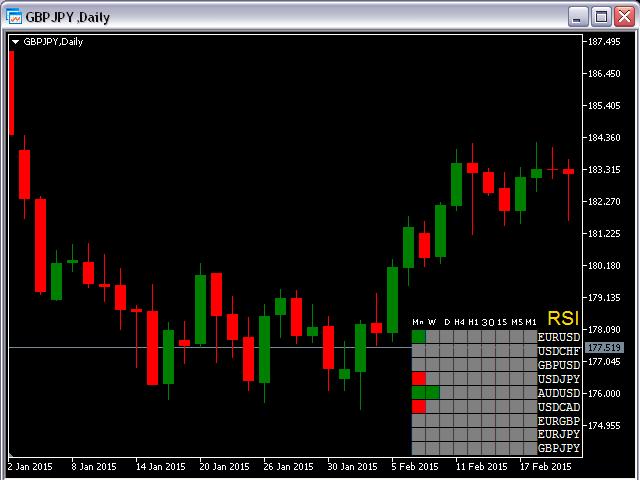
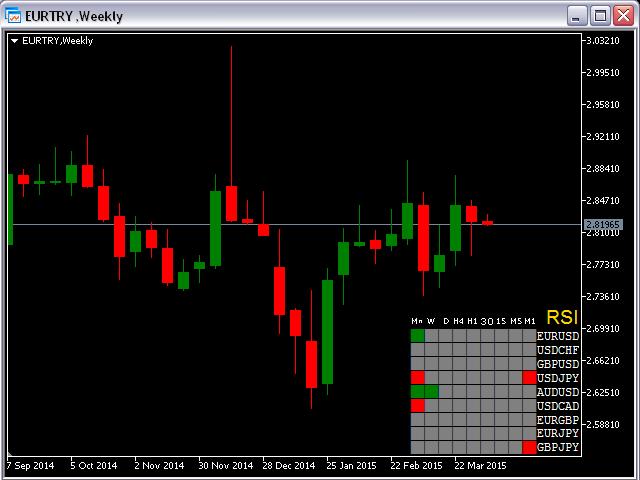
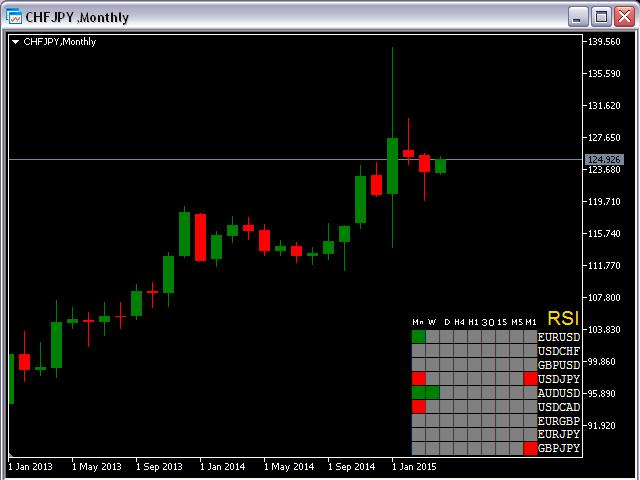
Este indicador muestra datos de 9 pares de divisas a su elección para los 9 Marcos de Tiempo.
Si un valor digital del RSI es menor o igual a DnLevel = 30 (o cualquier número que haya decidido poner), entonces aparecerá un cuadrado verde. Esta es potencialmente una condición de sobreventa y tal vez un buen momento para ir en largo.
Si un valor digital del RSI es mayor o igual a UpLevel = 70 (o cualquier número que haya decidido poner), entonces aparecerá un cuadrado rojo. Esto es potencialmente una condición de sobrecompra y tal vez un buen momento para ir en corto.
Si un valor digital del RSI está entre un UpLevel y un DnLevel entonces aparecerá un cuadrado Gris.
Parámetros de entrada:
- De Symb1 a Symb9 - puede cambiar cualquiera de estos Símbolos a cualquier par de divisas legal existente en su plataforma.
- rPeriod = 14; - periodo promedio para el RSI.
- appPrice = PRICE_CLOSE; - aplicar precio para el RSI.
- UpLevel = 70; - nivel de sobrecompra.
- DnLevel = 30; - nivel de sobreventa.
- SymbColor = clrWhite; - puede cambiar el color de todas las etiquetas.
Atención:
Antes de utilizar este indicador tiene que abrir todos los gráficos (todos TF) para los 9 pares de divisas.