Triple Channel MT5
- Indicadores
-
Sergey Deev
 I'm implementing your ideas in MQL4: https://www.mql5.com/ru/job/new?prefered=work2it
 - Versión: 1.1
- Actualizado: 18 noviembre 2021
- Activaciones: 5
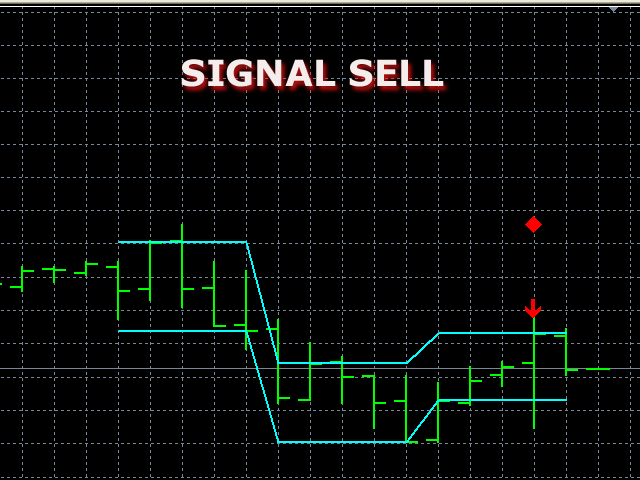
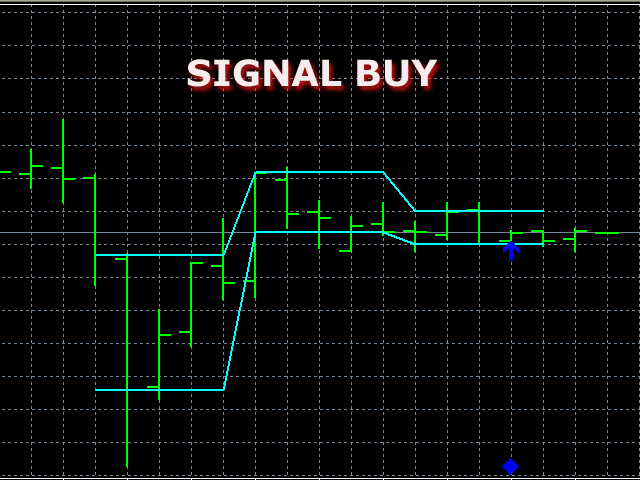
El indicador traza tres canales consecutivos por precios de Cierre y comprueba si coinciden con el esquema mostrado en las capturas de pantalla. La longitud de cada canal no es fija y es seleccionada por el programa dentro del rango ChMin y ChMax. Cuando se encuentra la coincidencia, se forma una señal (una flecha del color apropiado). Un posible nivel de stop loss se muestra como un rombo. Una señal puede ir acompañada de una ventana emergente, una notificación push y/o un correo electrónico. El indicador funciona por precios de apertura.
Parámetros
- ChMin - longitud mínima del canal;
- ChMax - longitud máxima del canal;
- signalLive - tiempo de vida de la señal (intervalo repetido de fijación de la señal);
- UseAlert - permitir una ventana emergente;
- UsePush - permite una notificación push;
- UseEmail - permite una alerta por correo electrónico.


El usuario no ha dejado ningún comentario para su valoración