Trend in Colors MT5
- Indicadores
- Versión: 2.7
- Actualizado: 23 mayo 2020
- Activaciones: 5

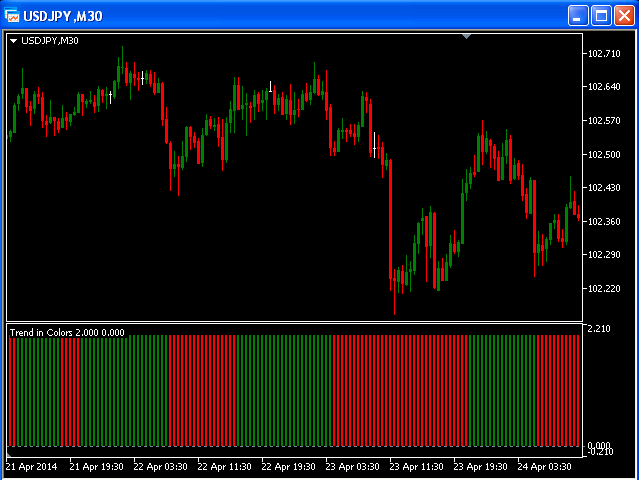
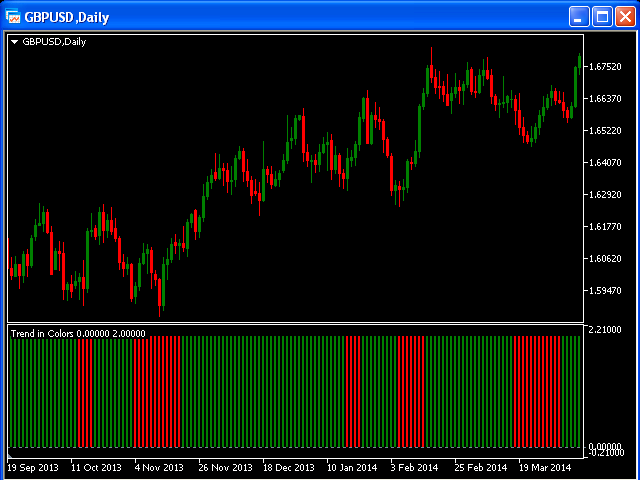
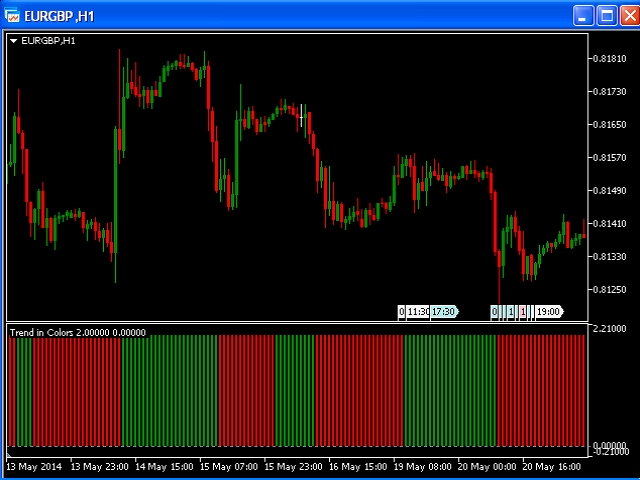
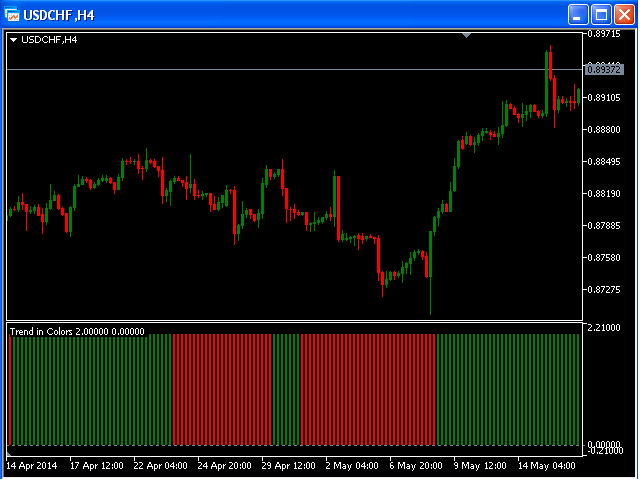
Los tres tipos básicos de tendencias son alcista, bajista y lateral. Una tendencia alcista se caracteriza por un aumento general del precio. Nada se mueve hacia arriba durante mucho tiempo, por lo que siempre habrá oscilaciones, pero la dirección general tiene que ser al alza. Una tendencia bajista se produce cuando el precio de un activo baja durante un periodo de tiempo.
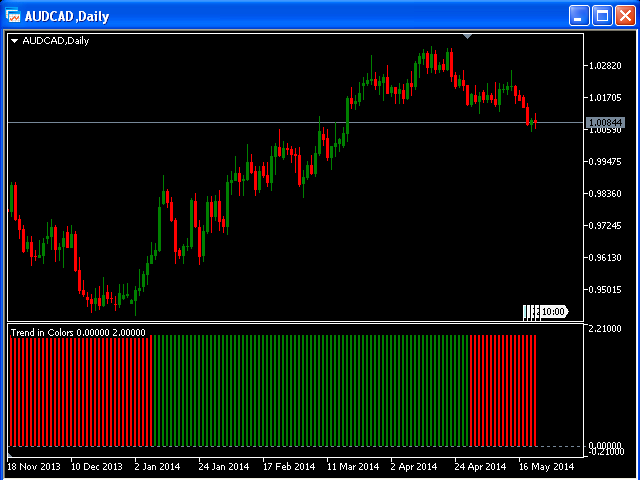
Se trata de un indicador de ventana independiente sin parámetros de entrada.
El histogramaverde representa una tendencia alcista y el histograma rojo una tendencia bajista.