Multi TimeFrame Moving Average
- Indicadores
- Versión: 4.4
- Actualizado: 20 noviembre 2021
- Activaciones: 5

Este indicador se basa en un indicador clásico de medias móviles. Las medias móviles nos ayudan, en primer lugar, a definir la tendencia y, en segundo lugar, a reconocer los cambios en la tendencia.
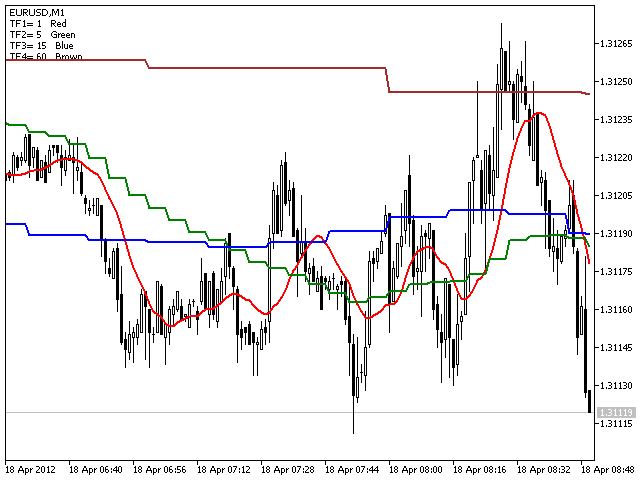
El indicador Multi TimeFrame MTF-MA muestra datos MA de los 4 timeframes a su elección.
Por defecto este indicador tiene parámetros externos:
- TF1 = 1;
- TimeFrame2b = verdadero;
- TF2 = 5;
- TimeFrame3b = true;
- TF3 = 15
- TimeFrame4b = verdadero
- TF4 = 60;
- InpPSARSPaso = 0,02;
- InpPSARMáximo = 0,2;
Puede cambiar TF1-TF4 en los siguientes límites:
- TF1 de M1 (1) a H4 (240)
- TF2 de M5 (5) a D1 (1440)
- TF3 de M15 (15) a W1 (10080)
- TF4 de M30 (30) a MN1 (43200)
Todos los TF elegidos no deben ser inferiores al marco temporal actual.
Puede utilizar datos de 4 o menos TFs utilizando parámetros bool: TimeFrame1b - TimeFrame4b.

I bought two indicators from you to my MetaTrader 5 but both do not work satisfactorily because the plot of the same in the graphs is intermittently asking you to be giving refresh on all graphs times. It would be a bug? The indicators was: MultiFrame Moving Average and Fractals Support Resistance.