Pivot classic woodie camarilla fibonacci demark
- Indicadores
- Versión: 1.10
- Actualizado: 28 enero 2023

Pivot Classic, Woodie, Camarilla, Fibonacci and Demark
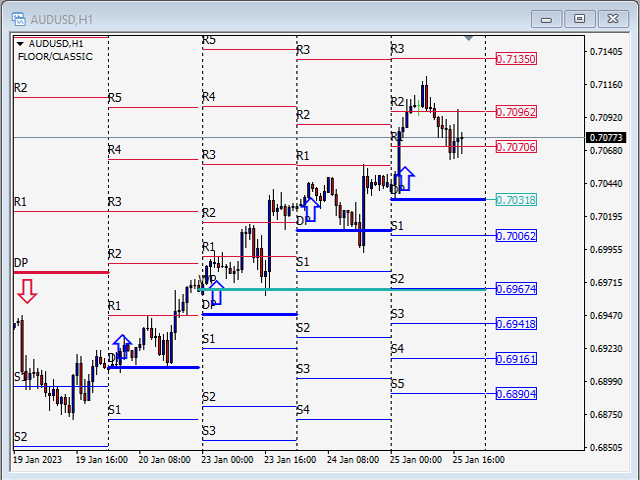
Floor/Classic
Los puntos de pivote, o simplemente pivotes, son útiles para identificar posibles niveles de soporte/resistencia, rangos de negociación, reversiones de tendencia y sentimiento del mercado al examinar los valores máximo, mínimo y de cierre de un activo. Los puntos de pivote Floor/Classic se pueden calcular de la siguiente manera.
Pivot Point (P) = (High + Low + Close)/3
S1 = P * 2 - High
S2 = P - (High - Low)
S3 = Low – 2*(High - P)
R1 = P * 2 - Low
R2 = P + (High - Low)
R3 = High + 2*(P - Low)
Woodie
Se diferencia del método estándar de cálculo del punto de pivote. Utiliza la diferencia entre el máximo y el mínimo del día anterior, también conocido como rango, para calcular los niveles de soporte y resistencia. Algunos comerciantes prefieren usar las fórmulas Woodie ya que le dan más peso al precio de cierre del período anterior. Los puntos de pivote Woodie se pueden calcular de la siguiente manera.
R2 = P + (H - L)
R1 = (2 * P) - LOW
P = (HIGH + LOW + (CLOSE * 2)) / 4
S1 = (2 * P) - HIGH
S2 = P - (H - L)
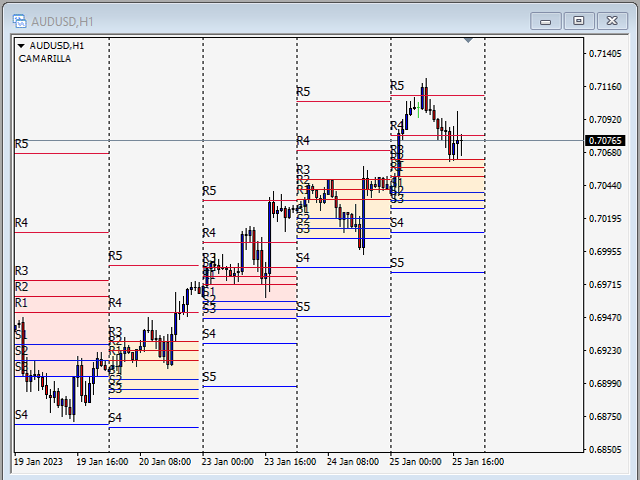
Camarilla
Las fórmulas Camarilla son similares a la fórmula Woodie. Su idea básica es que el precio tiende a volver a su promedio. Los niveles Camarilla ayudan a apuntar a órdenes de stop loss y ganancias precisas. Los niveles más importantes son S3, S4 y R3, R4. Los puntos de pivote Camarilla se pueden calcular de la siguiente manera.
R4 = ((High - Low) * 1.1) / 2 + Close
R3 = ((High - Low) * 1.1) / 4 + Close
R2 = ((High - Low) * 1.1) / 6 + Close
R1 = ((High - Low) * 1.1) / 12 + Close
S1 = Close - ((High - Low) * 1.1) / 12
S2 = Close - ((High - Low) * 1.1) / 6
S3 = Close - ((High - Low) * 1.1) / 4
S4 = Close - ((High - Low) * 1.1) / 2
Fibonacci
Los niveles del punto pivote Fibonacci se determinan calculando primero el punto pivote, como en el método estándar. A continuación, multiplique el rango del día anterior por el nivel correspondiente de 2004. La mayoría de los operadores utilizan correcciones del 38,2 %, 61,8 % y 100 % en sus cálculos. La razón detrás de esto es que muchos comerciantes usan probabilidades Fibonacci. Los puntos de pivote Fibonacci se pueden calcular de la siguiente manera.
Pivot Point (P) = (High + Low + Close)/3
Support 1 (S1) = P - (0.382 * (High - Low))
Support 2 (S2) = P - (0.6182 * (High - Low))
Support 3 (S3) = P - (1 * (High - Low))
Resistance 1 (R1) = P + (0.382 * (High - Low))
Resistance 2 (R2) = P + (0.6182 * (High - Low))
Resistance 3 (R3) = P + (1 * (High - Low))
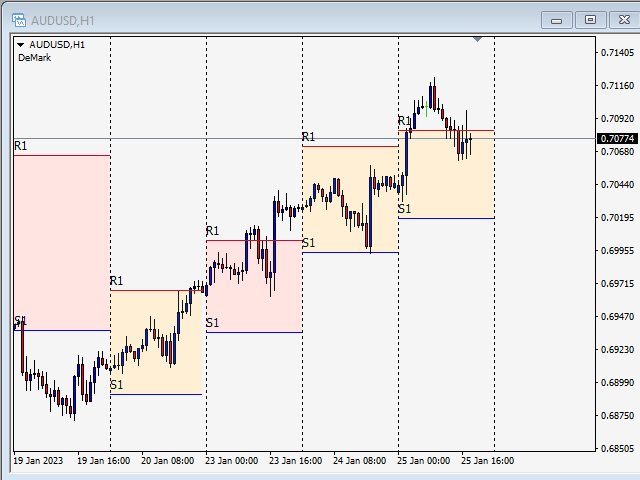
Demark
Estos puntos de pivote tienen una naturaleza condicional que pone más énfasis en los movimientos de precios recientes en función de la relación entre el precio de apertura y el precio de cierre. Los puntos de pivote Demark se pueden calcular de la siguiente manera.
If Close < Open, then X = High + (2 * Low) + Close
If Close > Open, then X = (2 * High) + Low + Close
If Close = Open, then X = High + Low + (2 * Close)
Support 1 (S1) = X/2 - High
Resistance 1 (R1) = X/2 - Low
El usuario no ha dejado ningún comentario para su valoración