TSO Stochastic RSI
- Indicadores
-
Dionisis Nikolopoulos
 We are a small team of individuals with a strong passion for trading.
Our research is focused in the area of trading methods and mechanical trading systems
developed on the MT4 and MT5 trading platforms.
Many more features will be coming in the future, so stay with us! - Versión: 1.15
- Actualizado: 29 junio 2019
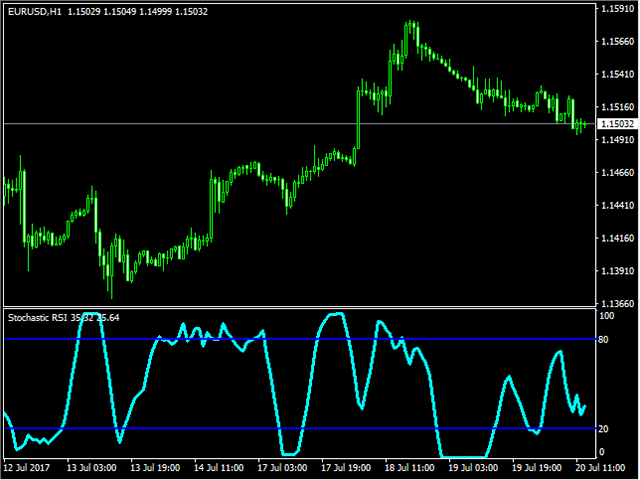
Stochastic RSI realiza un cálculo estocástico sobre el indicador RSI. El Índice de Fuerza Relativa (RSI) es un conocido oscilador de impulso que mide la velocidad y el cambio de los movimientos de los precios, desarrollado por J. Welles Wilder.
Características
- Encuentra situaciones de sobrecompra y sobreventa.
- Alerta sonora cuando se alcanza el nivel de sobrecompra/sobreventa.
- Recibe alertas por correo electrónico y/o notificaciones push cuando se detecta una señal.
- El indicador no repinta.
- Devuelve valores de tampón para %K y %D para ser utilizados como parte de un EA . (ver más abajo)
Estrategia Básica
- Busque posiciones cortas cuando el precio suba por encima del límite superior.
- Busque posiciones largas cuando el precio caiga por debajo del límite inferior.
Entradas
- Periodo RSI: Típicamente fijado en 14
- Periodo %K: Típicamente fijado en 8
- Periodo de suavizado %K: Establezca 1 para el cálculo de %K por defecto. Establezca un valor más alto para que %K se suavice utilizando una Media Móvil Simple (SMA) de X periodos. Esto también afecta a %D ya que es la SMA de %K.
- Periodo de %D: Normalmente se establece en 5
Para desarrolladores de EA
El indicador puede utilizarse fácilmente como parte de un EA.
- Buffer para valor %D = 0
- Buffer para valor %K = 1


I too used this indicator, and I Love it! Can´t thank you enough for sharing it with us.But, Can you tell me if there is any way of getting the "source code"(MQL File) for it?