EMA Multi meter
- Indicadores
-
Abir Pathak
 I create MT4 and MT5 indicators. They are mainly arrows and scanner indicators and also some essential utilities.
I'm hoping they will make your trading easier and make you profitable.
You can join my Telegram channel to keep track of all products I post. - Versión: 1.3
- Actualizado: 12 noviembre 2020
Cómo funciona el indicador:
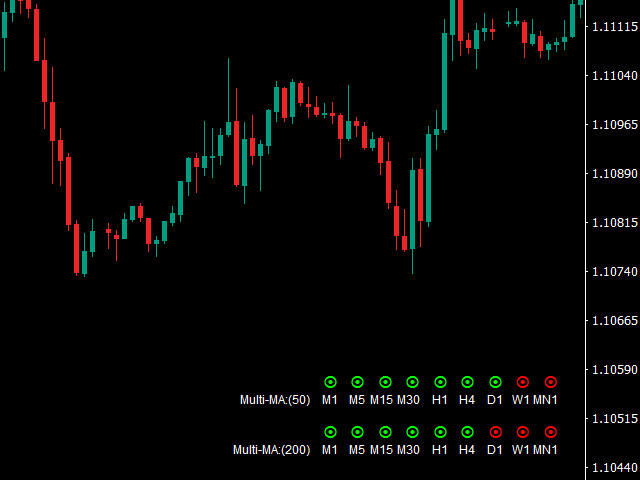
Este es un indicador multimedidor Multi-timeframe MA que estudia si el precio está por encima o por debajo de un rango EMA particular y muestra señales rojas / verdes / amarillas.
Rojo: Precio por debajo del rango EMA
Verde: Precio por encima del rango
Amarillo: Precio dentro del rango
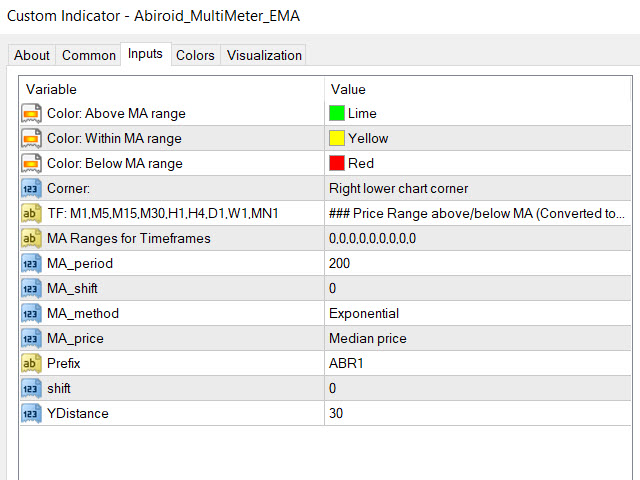
Propiedades del indicador:
Ajustes EMA:
- El periodo por defecto es 200. Puede cambiar todos los ajustes de MA como Período, Método MA (SMA, EMA, etc) o Precio MA Aplicado (Cierre, Apertura, etc).
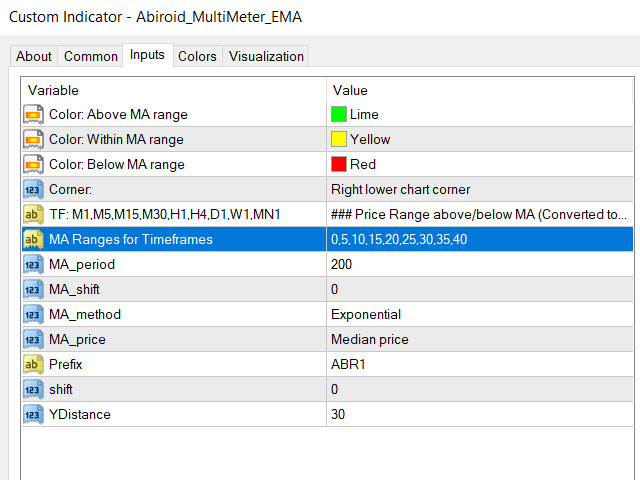
- La lista de Rango EMA es una lista de valores separados por comas para diferentes marcos de tiempo. Se convertirá en puntos.
Si el precio está por encima del rango es verde, el precio por debajo es rojo y el precio dentro es amarillo.
Por ejemplo EURUSD: Si para M1 necesita usar sólo 5 Puntos será 0.00005.
Pero para un TF más alto como H1 necesita utilizar un rango mayor como 25, por lo que se convertirá a 0.000025.
Por defecto la lista es 0,0,0,0,0,0,0,0,0 para los 9 timeframes M1,M5,M15,M30,H1,H4,D1,W1,MN1 respectivamente.
Pero se puede establecer en algo como 5,10,15,20,25,30,35,40,45
Si falta algún valor será 0 por defecto.
- Puede cambiar los colores para arriba/abajo/dentro del rango.
- Y también en qué esquina de la pantalla aparecerá este multímetro.
- Y la posición Y. Esto es útil si necesitas varios multímetros para diferentes EMAs. También cambiar Prefijo para múltiples multímetros para que no se sobreescriban entre ellos.
- EsperarTicks: Espera un número de ticks antes de refrescar el multímetro. Mantenga un número más alto como 200 o 500 para un mejor rendimiento.
Acerca de EMAs:
EMA (Exponential Moving Average) es un muy buen indicador de la tendencia actual. Especialmente una más alta 200 período uno.
En EMA, se da más peso a los datos más recientes y la EMA reacciona más rápido a los cambios recientes en los precios.
Por lo tanto, el estudio de diferentes plazos EMA juntos puede dar una muy buena indicación de la tendencia general del mercado.
Es por eso que este indicador Multi Timeframe es muy útil.
Tendencias:
Tendencia bajista: El precio está por debajo de la EMA 200.
Tendencia alcista: El precio está por encima de 200 EMA.
Buena estrategia de EMA:
- Encuentra la Tendencia:
1. Observe la tendencia D1
2. Mira la tendencia en H4 si tiene la misma tendencia con el gráfico diario.
3. Mira en H1 si tiene la misma tendencia con H4 y gráfico diario.
- Siguiente:
En el H1, espere a que el precio vuelva a tocar la EMA 200 y entre en la reversión. Puede identificar la reversión a través de la vela de reversión.
Si está pensando en una posición de venta, coloque una orden stop de venta 3-5 pips por debajo del mínimo de la vela de inversión y establezca un stop loss 10-15 pips por encima del máximo de la vela de inversión.
Si está pensando en una posición de compra, coloque una orden stop de compra 3-5 pips por encima del máximo de la vela de inversión y establezca un stop loss 10-15 pips por debajo del mínimo de la vela de inversión.
El objetivo de beneficios es el máximo o mínimo de la oscilación anterior en el marco temporal H1, o puede seguir las paradas moviendo el stop loss si el mercado se mueve a favor de su posición.
Combine esta estrategia con Price Action y Soporte/Resistencia para obtener mejores resultados.
Mire las capturas de pantalla para Múltiples Medidores Múltiples y cómo se ven. Y para las pantallas de configuración.


Good indicator. Many thanks for sharing.