Stochastic Candles
- Indicadores
-
Wartono
 No body knows. No Big Boy. BUY-SELL is only the wave. Everything will be back to nature.
 - Versión: 1.0
- Activaciones: 5
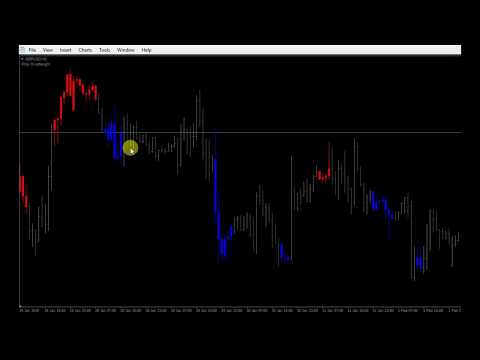
Indicador de Velas Estocásticas
Convierte el indicador estocástico de una ventana separada a la ventana del gráfico dibujando velas de sobreventa y sobrecompra. Red es sobrecompra y azul es sobreventa por default.and puede cambiar el color más tarde en el indicador externo setting.This es Multi indicador de marco de tiempo que significa que puede mostrar el resultado de la apariencia de otro timeframe.E.g: Si establece timeframe H1 entonces se dibujará velas de Timeframe H1 cualquier timeframe adjuntar on.
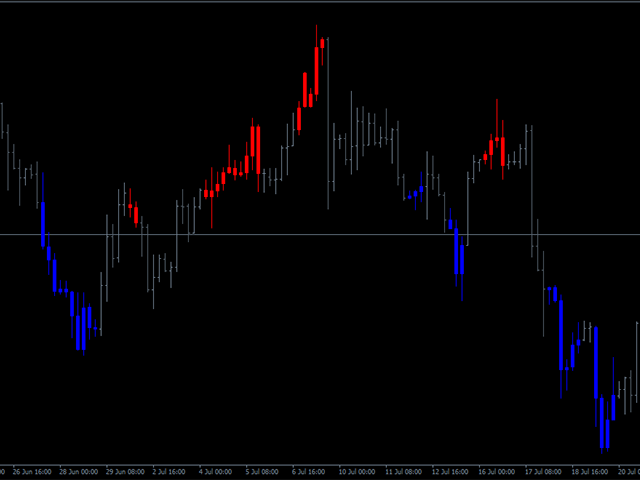
Será útil para los que quieren usarlo y combinado por otros indicadores porque el gráfico se verá más fácil de entender con un aspecto más simple.
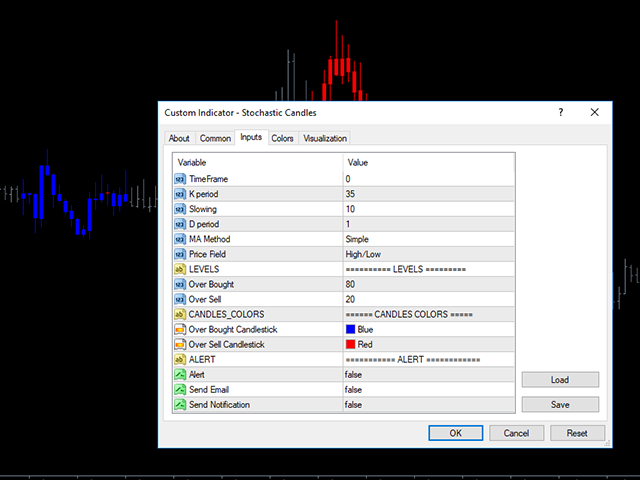
Características:
1. Multi Timeframe,Timeframe M1=1,Timeframe M5=5,Timeframe M15=15,etc
2. Buena configuración para la tendencia = 35,10,1
3. Alerta,incluye popup,email,sonido,notificación push
4. Color de las velas, puede cambiar el color en la configuración externa.
5. Cualquier moneda
6. Sólo para MT4
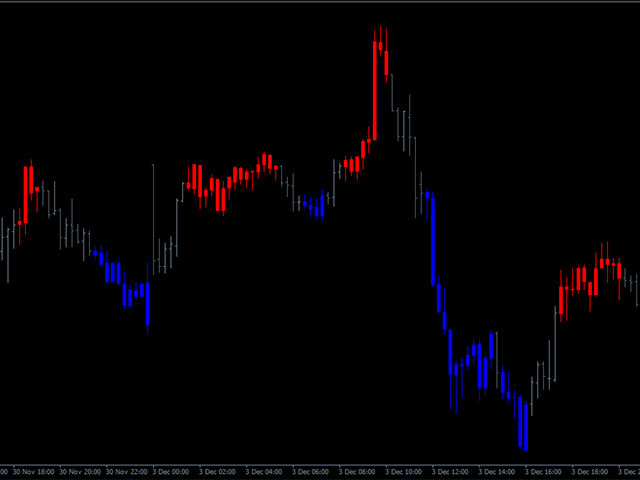

Really great indicator, complete with all stochastic options and ability to select them for a particular user preference, looks and works perfectly. Could add an option for arrows to mark bar going in or out OBS zones without bar colours, but it is shown by bar colours. The pattern of coloured bars is very good for candlestick traders.