X3 Chart Pattern Scanner MT4
- Indicadores
-
Young Ho Seo
 Harmonic Pattern Indicator - Repainting + Japanese Candlestick Pattern Scanner + Automatic Channel + Many more
https://www.mql5.com/en/market/product/4488 - Versión: 8.71
- Actualizado: 12 enero 2022
- Activaciones: 5
Introducción al X3 Chart Pattern Scanner
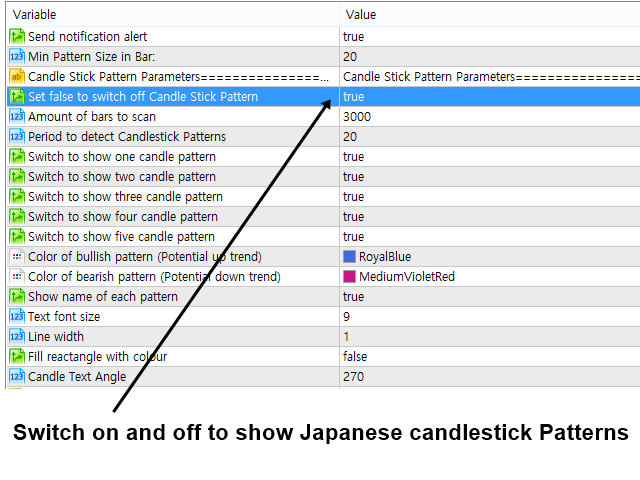
X3 Cherart Pattern Scanner es el indicador no repintado y no rezagado que detecta patrones de gráficos X3, incluyendo patrones armónicos, patrones de ondas de Elliott, patrones X3 y patrones de velas japonesas. Los patrones históricos coinciden con los patrones de señal. Por lo tanto, usted puede desarrollar fácilmente la estrategia de negociación sólida en su gráfico. Y lo que es más importante, este magnífico escáner de patrones puede detectar el patrón óptimo de su clase. Además, puede activar y desactivar patrones individuales según sus preferencias. Por ejemplo, si sólo desea operar con patrones armónicos, entonces simplemente desactive todos los patrones Elliott Wave y X3. Además, tenga en cuenta que cada patrón se puede personalizar con la notación RECF. Los patrones de velas japonesas son una especie de paquete adicional añadido en el indicador. Los patrones de velas japonesas se pueden utilizar como confirmación secundaria para los patrones armónicos, de onda de Elliott y X3. También puede activar y desactivar los patrones de velas japonesas.
Categoría de patrones armónicos
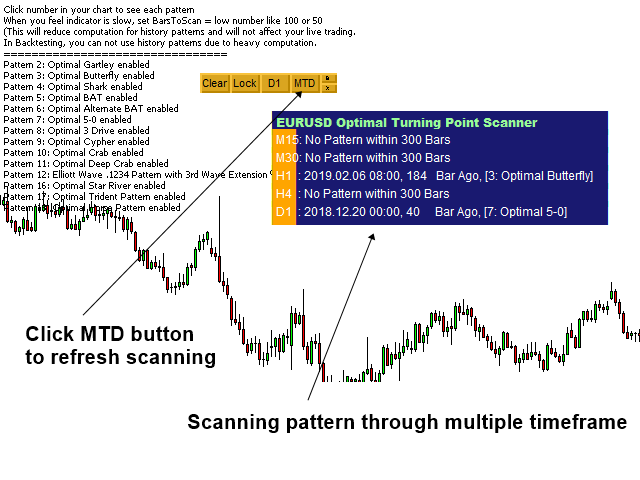
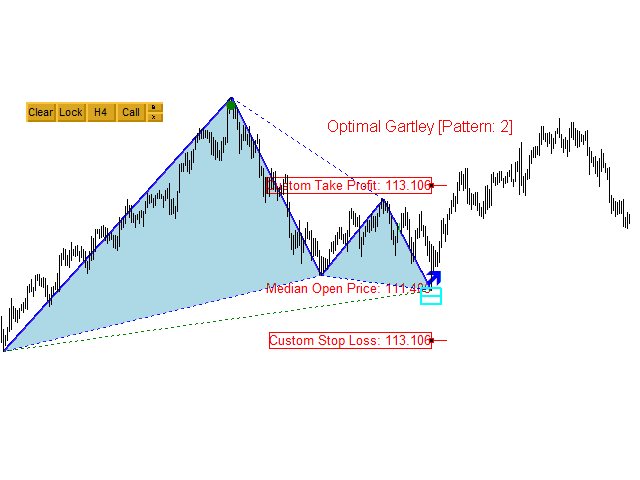
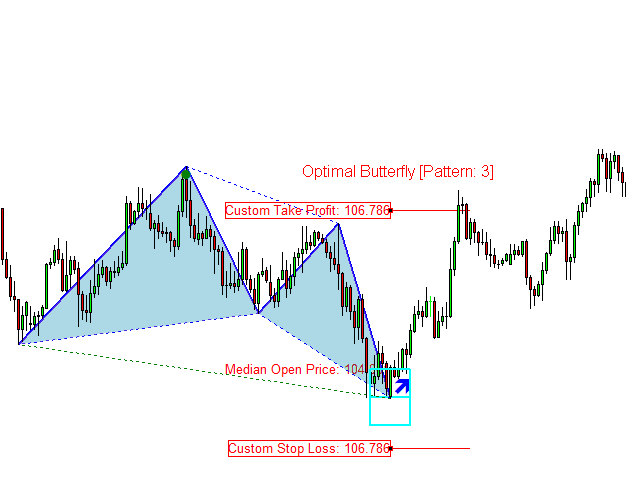
Los patrones armónicos detectables incluyen AB=CD óptimo, patrón mariposa óptimo, patrón Gartley óptimo, patrón murciélago óptimo, patrón murciélago alterno óptimo, patrón tiburón óptimo, patrón cangrejo óptimo, patrón cangrejo profundo óptimo, patrón Cypher óptimo, patrón 5-0 óptimo y patrón 3 unidades óptimo.
Categoría de patrones de ondas de Elliott
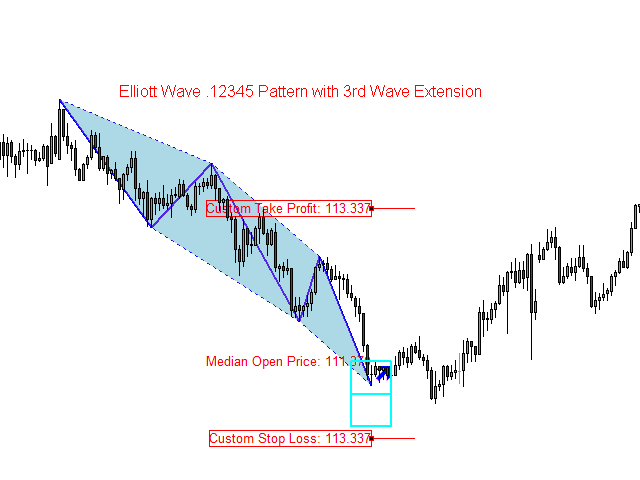
Los patrones detectables de la Onda de Elliott incluyen el Patrón de la Onda de Elliott .1234, el Patrón de la Onda de Elliott .12345, el Patrón de la Onda de Elliott .12345AB y el Patrón de la Onda de Elliott .12345ABC. Además, puede modificar la estructura de los patrones de Onda de Elliott como desee.
Categoría de patrones de gráficos X3
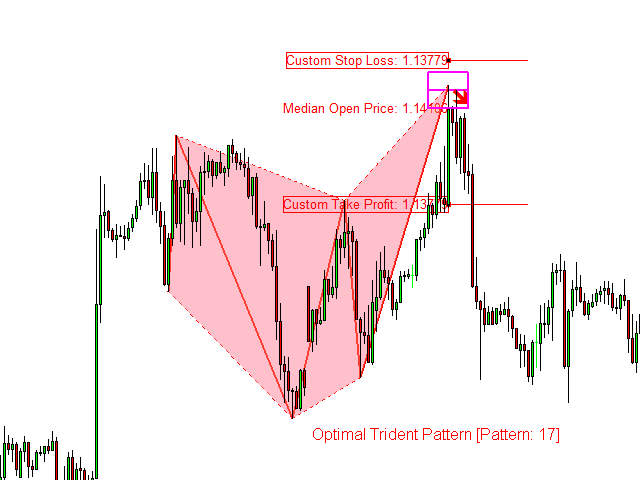
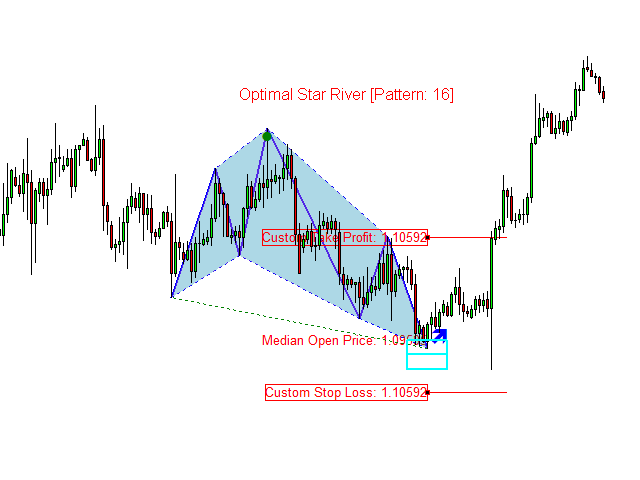
Los patrones de gráficos X3 detectables incluyen el patrón Star River, el patrón Trident, el patrón Horse, el patrón Eagle y el patrón Phoenix.
Categoría de patrones de velas japonesas
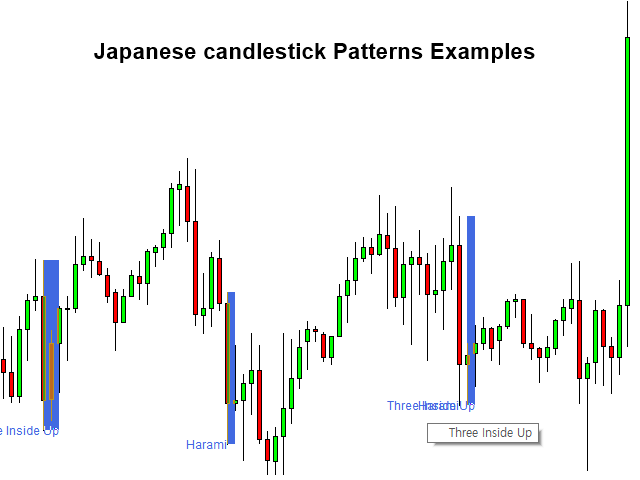
Los patrones de velas japonesas detectables incluyen Engulfing, Piercing Line, Morning Star, Doji Star, Hammer, Harami y muchos más patrones de velas japonesas también detectables.
Características del producto
- Patrón armónico, patrón de onda de Elliott y escáner de patrones de gráficos X3 sin repintado ni retardo
- Intervalo de finalización del patrón
- Zona de reversión potencial
- Zona de continuación potencial
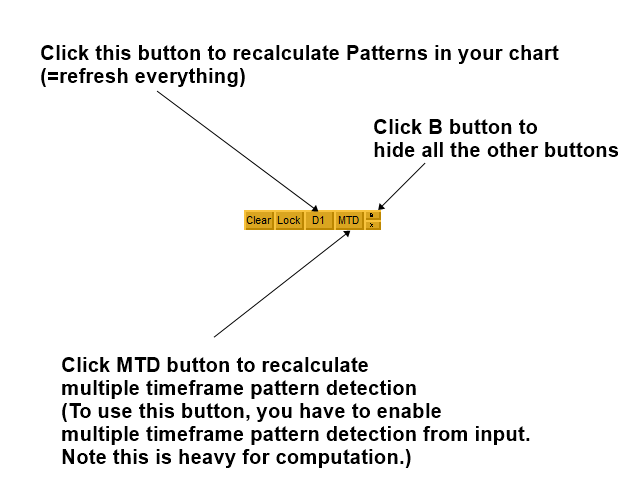
- Función de bloqueo y desbloqueo de patrones
- Stop Loss y Take Profit interactivos en función de su relación Recompensa/Riesgo
- Patrones Históricos
- Puede detectar alrededor de 52 patrones de velas japonesas
- Escaneo de patrones de múltiples marcos temporales para patrones armónicos, patrones de ondas de Elliott y patrones X3.
Entrada y Salida para Operar
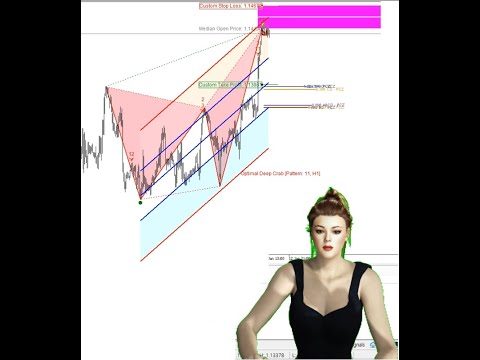
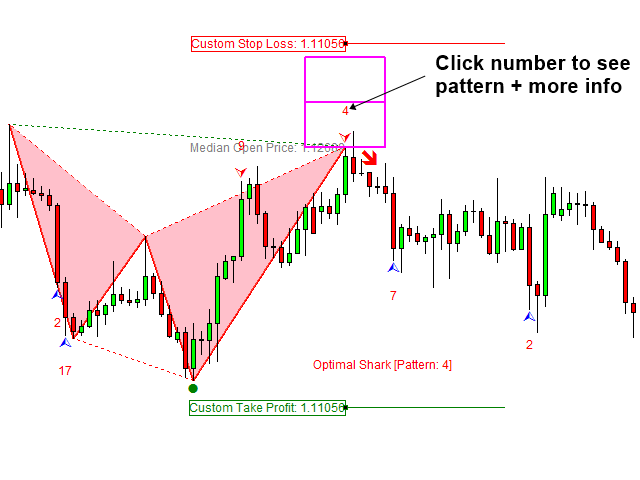
Este indicador proporciona tres componentes esenciales para operar y gestionar el riesgo de la operación, incluyendo el intervalo de finalización del patrón, la zona de reversión potencial y la zona de continuación potencial. Los niveles de stop loss y take profit son móviles y ajustables. La zona de inversión potencial se puede utilizar para identificar la ubicación del punto de inflexión. La zona de continuación potencial se puede utilizar para predecir el movimiento futuro del precio después de la detección del punto de inflexión. El Intervalo de Finalización del Patrón es el lugar táctico donde se puede establecer el punto de equilibrio, o el stop de beneficios o para abrir una nueva entrada de acuerdo con las condiciones del mercado.
Confirmación secundaria
Cualquier trader experimentado recomendará el uso de la confirmación secundaria junto con los patrones gráficos X3. Dependiendo de su habilidad, puede combinar varias técnicas de confirmación secundaria con el X3 Chart Pattern Scanner.
- Otros indicadores técnicos (i.e. RSI, CCI, MACD, etc)
- Análisis de oferta y demanda
- Análisis fundamental
- Análisis de ondas de Elliott
- Patrones de triángulo, cuña ascendente y cuña descendente
Guía de estrategias de negociación
Puede encontrar una estrategia de negociación detallada en el siguiente enlace. Recomendamos encarecidamente leer esta guía antes de utilizar este indicador.
https://www.mql5.com/en/blogs/post/750344
https://www.mql5.com/en/blogs/post/750343
Nota Importante
X3 Chart Pattern Scanner proporciona muchos buenos patrones. Sin embargo, utilice sólo los patrones que le gusten, ya que cada patrón del escáner puede activarse y desactivarse. Este indicador se puede probar en el probador de estrategias hasta el 80% de sus características. Por favor, pruébelo antes de comprarlo. Este es un producto "off the shelf". Por lo tanto, no aceptamos ninguna solicitud de modificación o personalización de este producto. Además, no proporcionamos ninguna biblioteca de código o cualquier apoyo para su codificación para este producto.


amazing indicator