MMM Gold Sniper
- Indicators
- Version: 2.0
- Updated: 4 September 2022
- Activations: 5

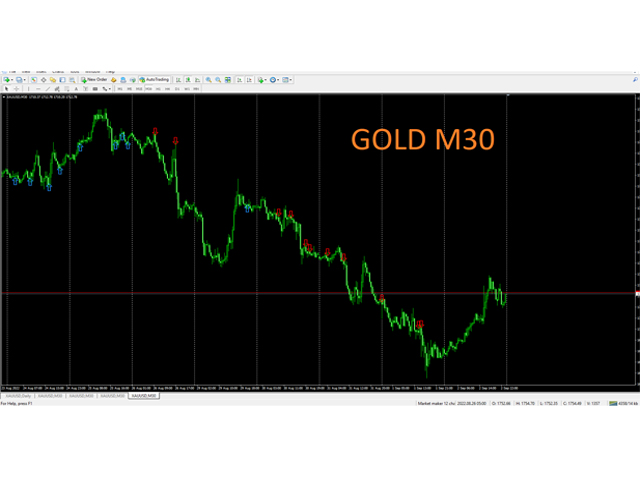
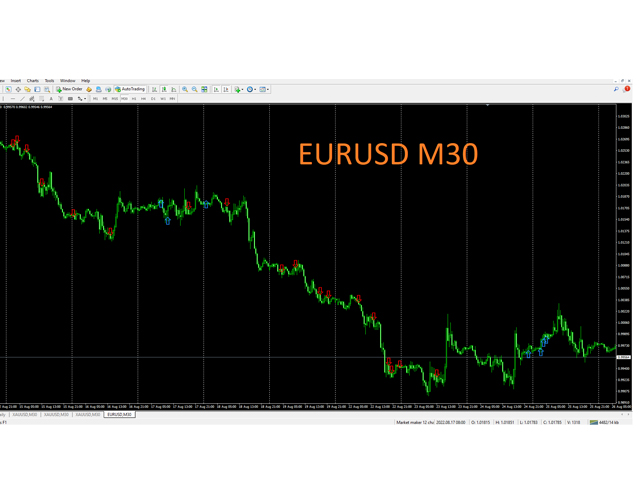
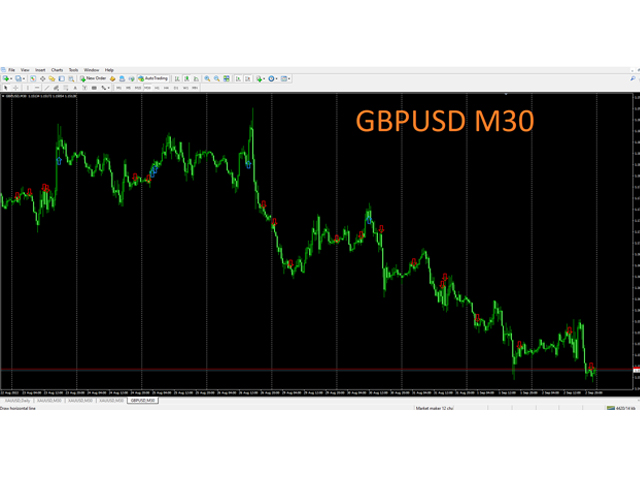
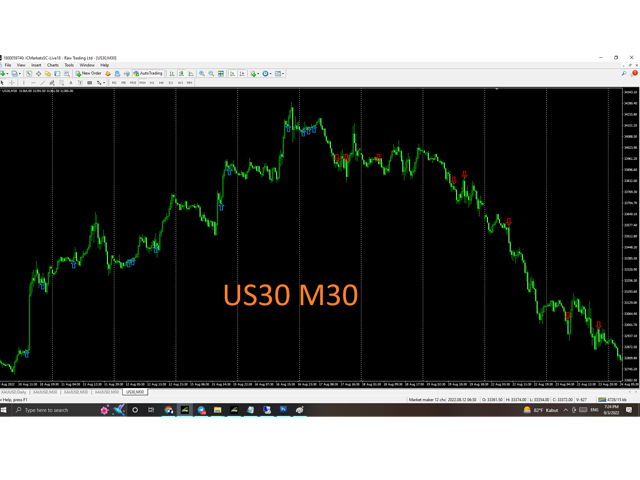
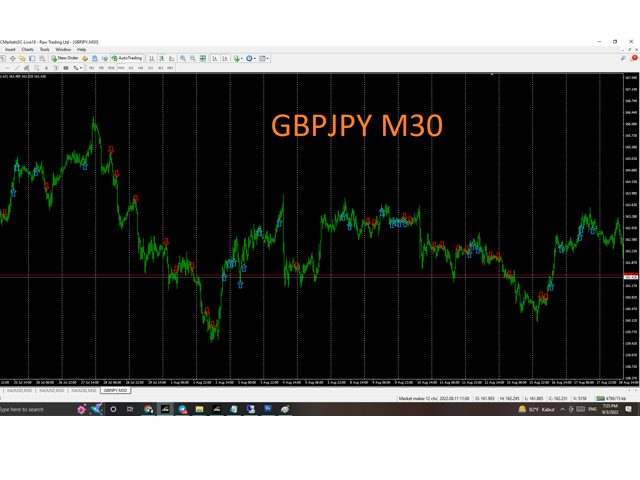
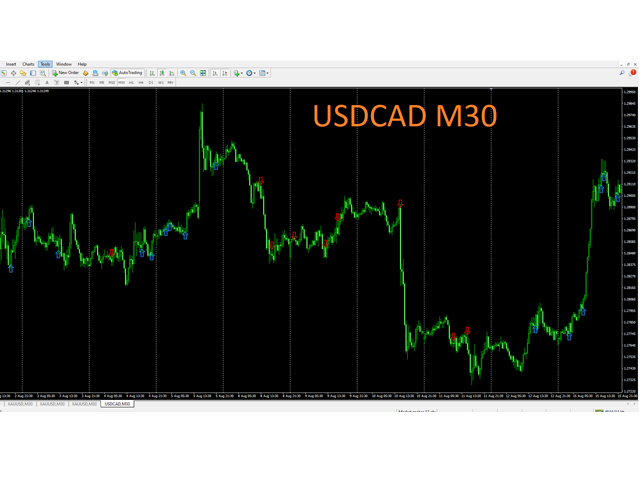
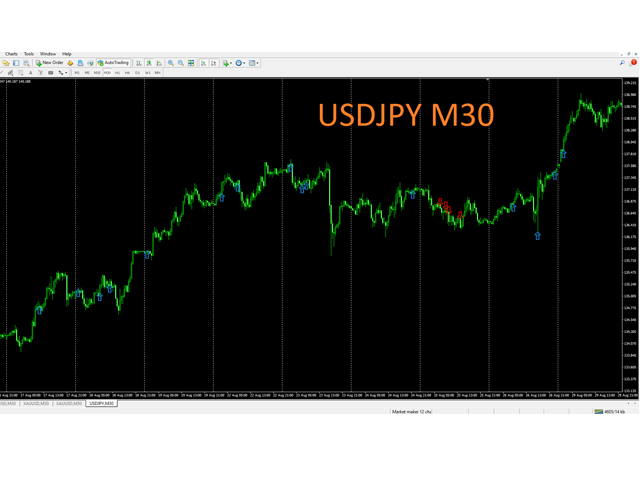
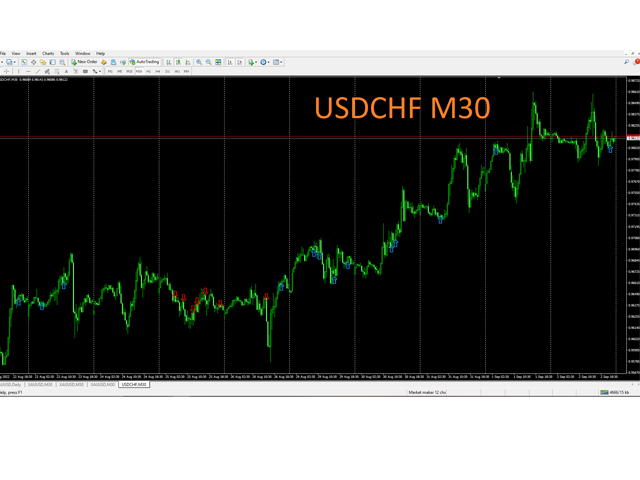
Indicator is based on Market Maker Strategy. NO REPAINT.
MM's are traders and their objective is to make money. This includes strategies to trade against retails traders. The major difference between them and other traders is that they have the ability, through access to massive volumes, to move price at their will. So to make money, they aim to buy at a lower price and then sell at a higher price.
They achieve this by:
1. Inducing traders to take positions. This is achieved by using a range of price movements to ‘trick' traders into taking a position in a given direction but then reversing it again. This means that the MM can sell a specific currency at a certain price and then buy it back at a lower price when the retail trader feels too much pain from the currency value moving backward and wanting to sell it back again (e.g. via the stop loss)
2. Create panic and fear to induce traders to become emotional and think irrationally. This often involves:
⋅ quick moves
⋅ spike candles
⋅ news releases
⋅ ‘inexplicable' price behaviour.
3. Hit the Stops and Clear the Board. This forces traders into ‘margin trouble' and ultimately out of the game.
All information about Market Maker Method are simplified in this indicator.
How to use:
NO INPUT AT ALL. Easy to use. You don't have to change any setting. All algorithm are set behind the screen.
Recommended Time Frame:
M5 for Scalper
M15 and M30 for intraday trader.
H1 and H4 for swing trader.
PAIRS:
XAUUSD
FOREX MAJOR, FOREX MINOR
OTHER COMMODITIES
INDICES
Entry:
Make entry after signal goes off at the next candle open.
Signal may blinking during pre-confirmation.
NO ARROW = INVALIDATE
ARROW = CONFIRM SIGNAL
Risk and Money Management:
Always risk 1-2% max from your capital. Do not over leverage.
Stoploss at nearest support/ resistance.
Take Profit:
Set your own daily target. Always secure your profit with trailing stop.
Always secure your profit with trailing stop.
Close partial lot and let the remaining order run with trailing stop.
=============================================================================
How to setup push notification to your MT4 Mobile App:
https://www.metatrader4.com/en/trading-platform/help/setup/settings_notifications