Entry Points Pro for MT5

4.5

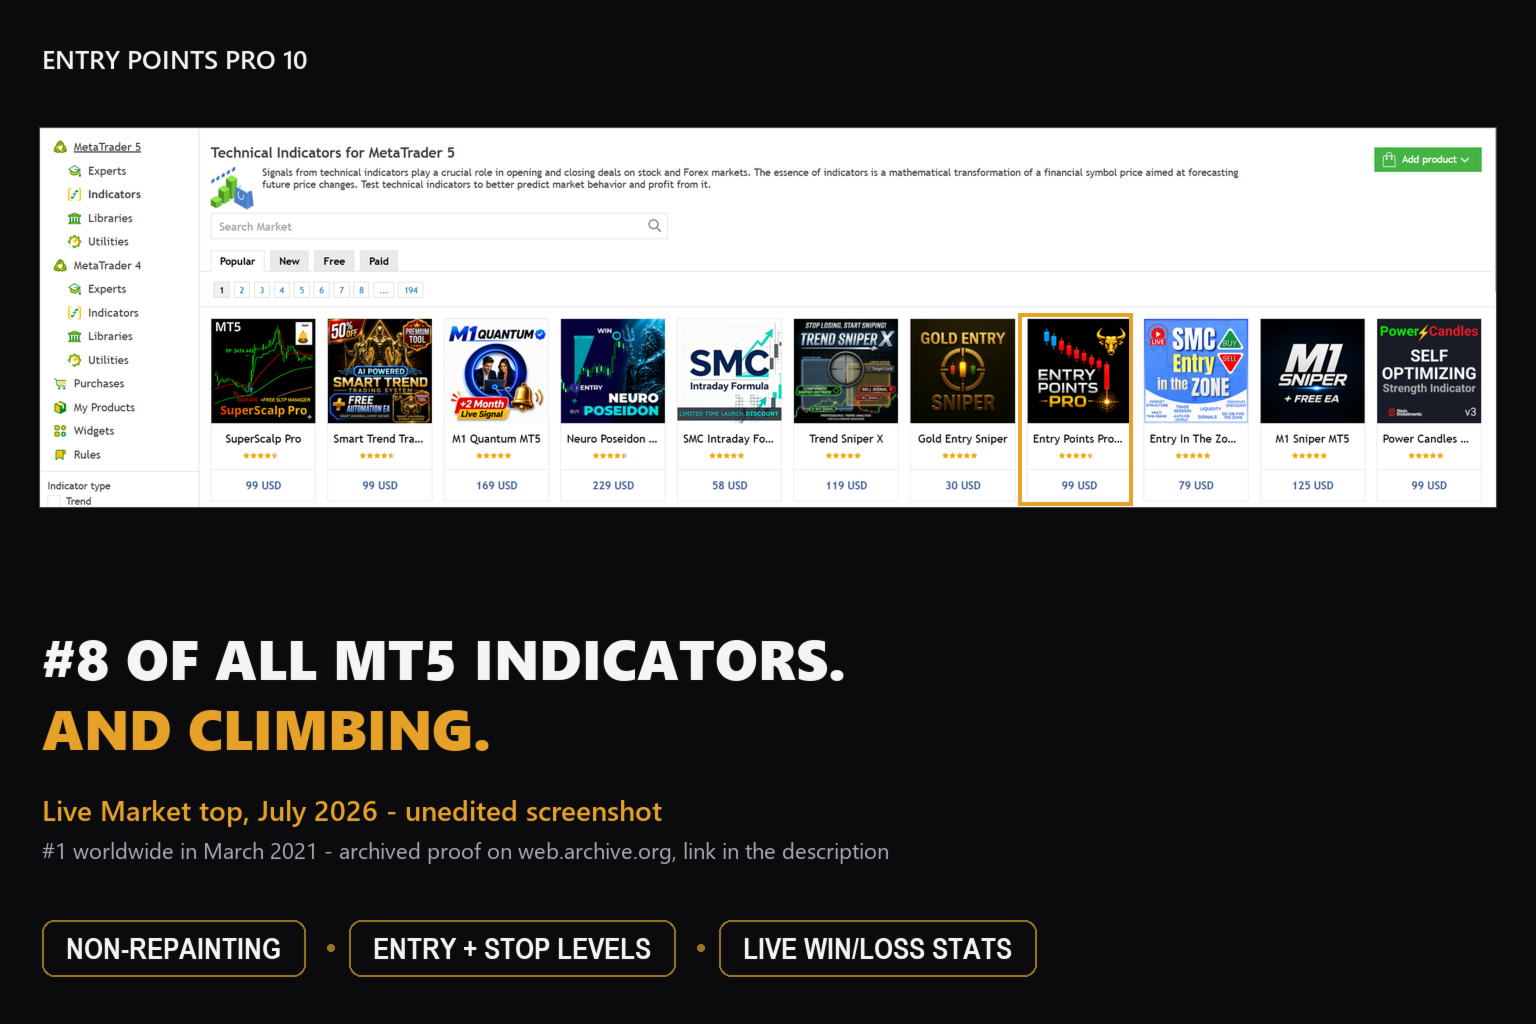
전설이 돌아왔습니다: Entry Points Pro 10. MQL5 마켓 Top-3 자리를 3년간 지켜온 전설적인 지표의 재출시입니다. 수백 개의 호평 리뷰(두 버전 합산 589개), 매일 이 지표로 거래하는 수천 명의 트레이더, 31,000회 이상의 데모 다운로드 MT4+MT5. 지난 5년간 여러분이 남긴 리뷰를 하나도 빠짐없이 읽었고, 약속 대신 그 답을 버전 10에 담았습니다. 1999년부터 시장에서 활동하며 정직함과 자신의 평판, 그리고 고객을 소중히 여기는 개발자가 만들었습니다.

Entry Points Pro의 진입 시그널은 절대 리페인팅되지 않습니다. 그리고 이번에는 개발자의 말뿐이 아니라 검증 가능한 사실입니다: 확정 시그널은 캔들 종가에서만 표시되며, 자동화 테스트에서 리페인팅 0건이 확인되었습니다(EURUSD, XAUUSD, BTCUSD에서 2,486,568회의 불변조건 검사 — 위반 0건). 검증 방법은 공개되어 있으니 전략 테스터에서 직접 재현해 보실 수 있습니다.

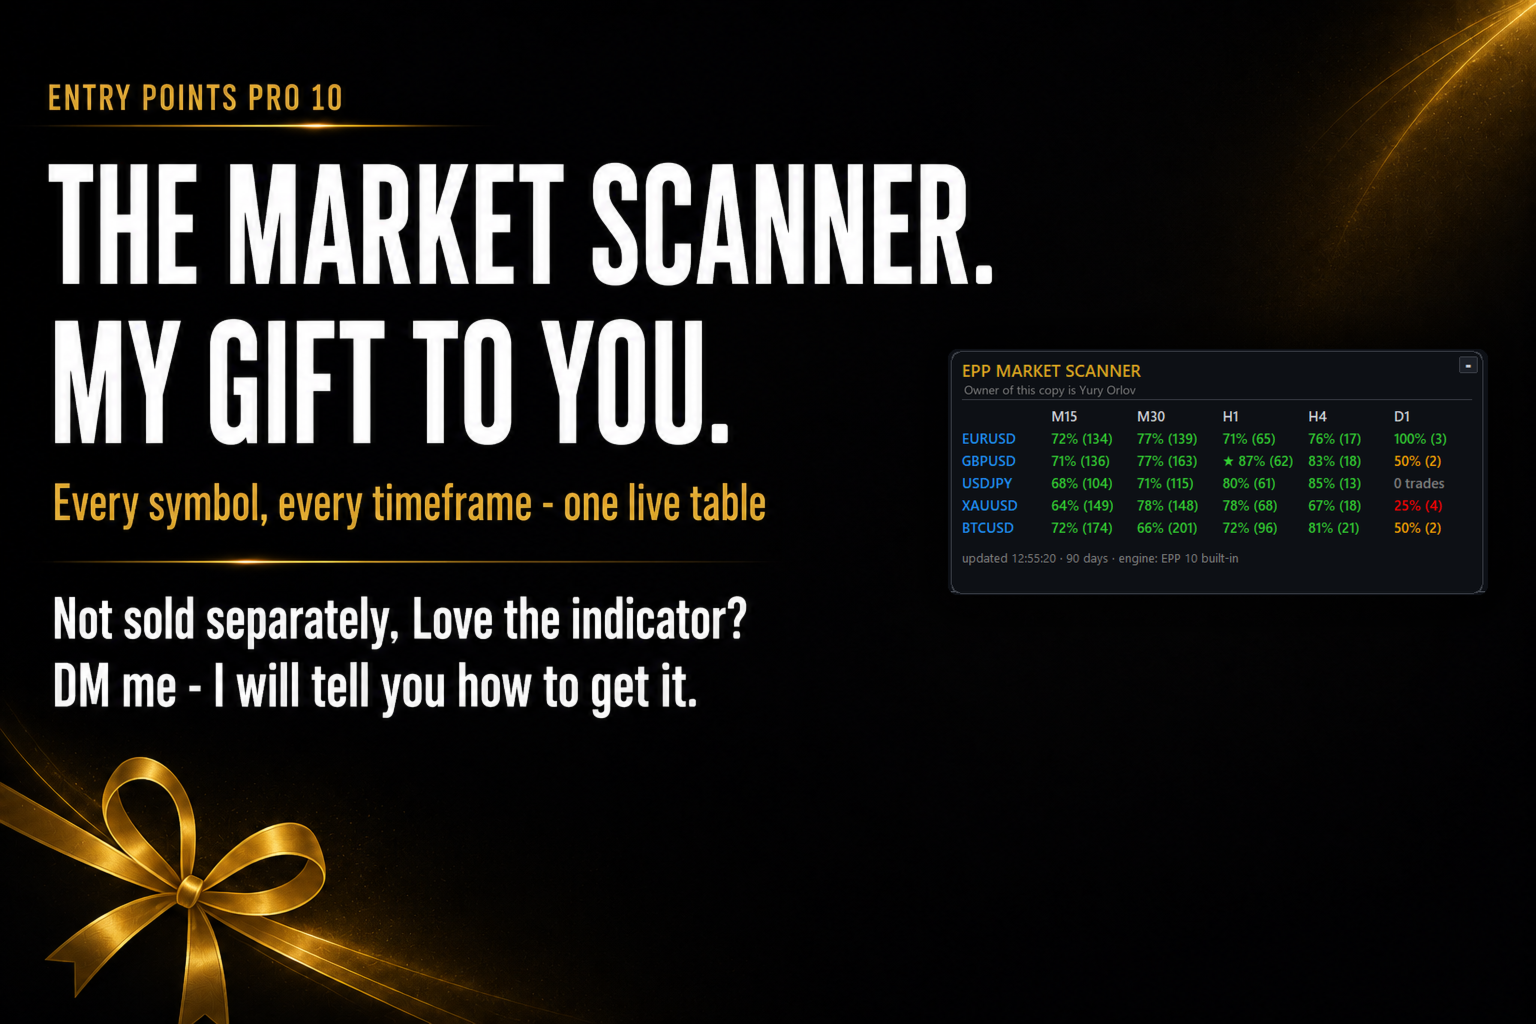
구매 직후 반드시 저에게 개인 메시지를 보내 주세요. 지표 매매의 완전한 가이드인 확장 매뉴얼 ‘트레이더의 바이블’을 보내 드리고, 보너스인 마켓 스캐너를 무료로 받는 방법을 알려 드립니다. 이 스캐너는 여러 종목과 타임프레임을 동시에 분석해, 지금 이 순간 Entry Points Pro가 가장 잘 작동하는 곳을 한 화면에 보여 줍니다.

말만 믿으라고 하지 않습니다. 직접, 무료로 확인해 보세요

  • 데모 = 정식 버전. 숨기거나 비활성화한 기능이 전혀 없습니다.
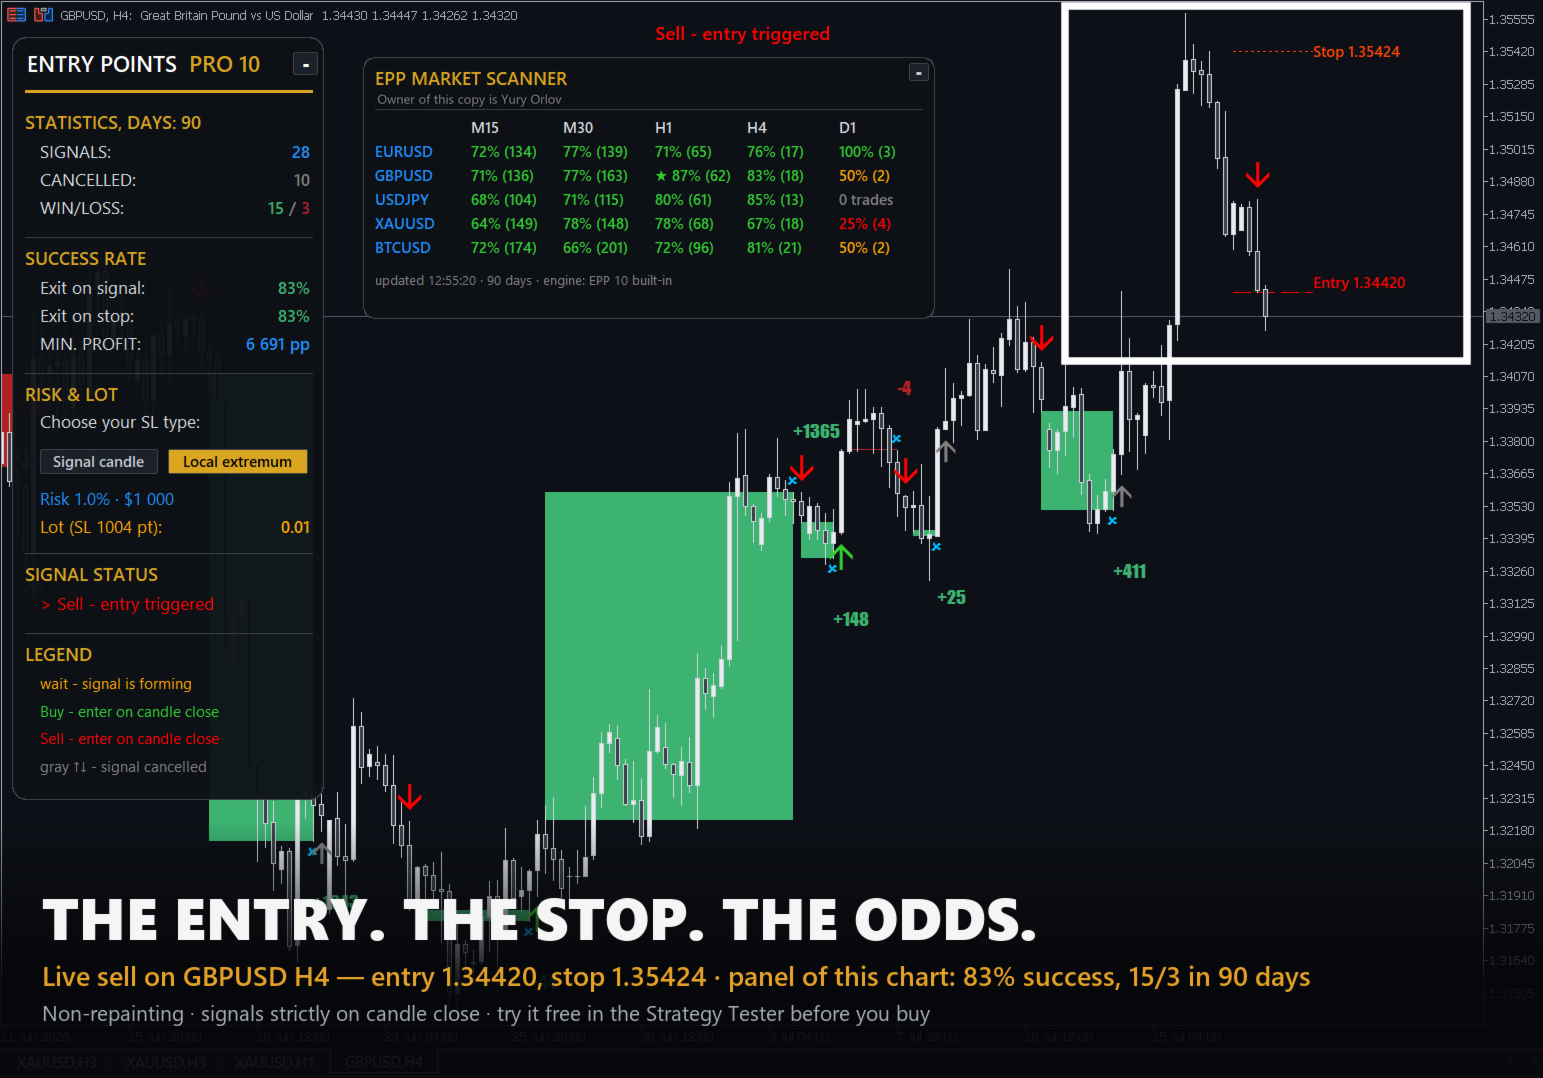
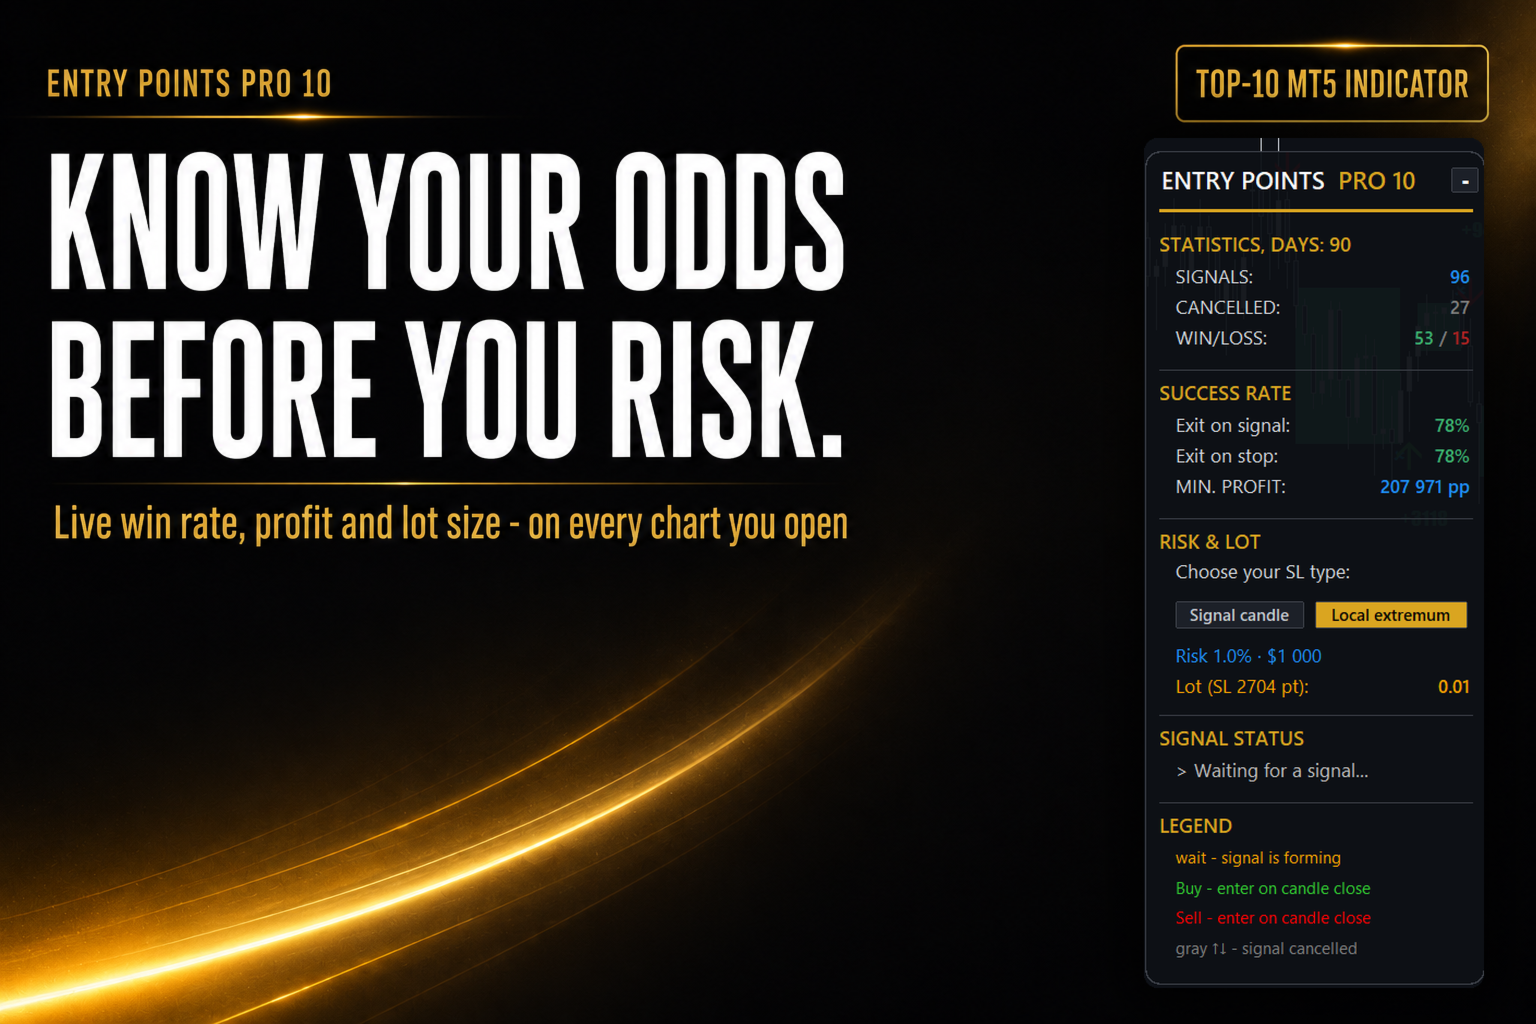
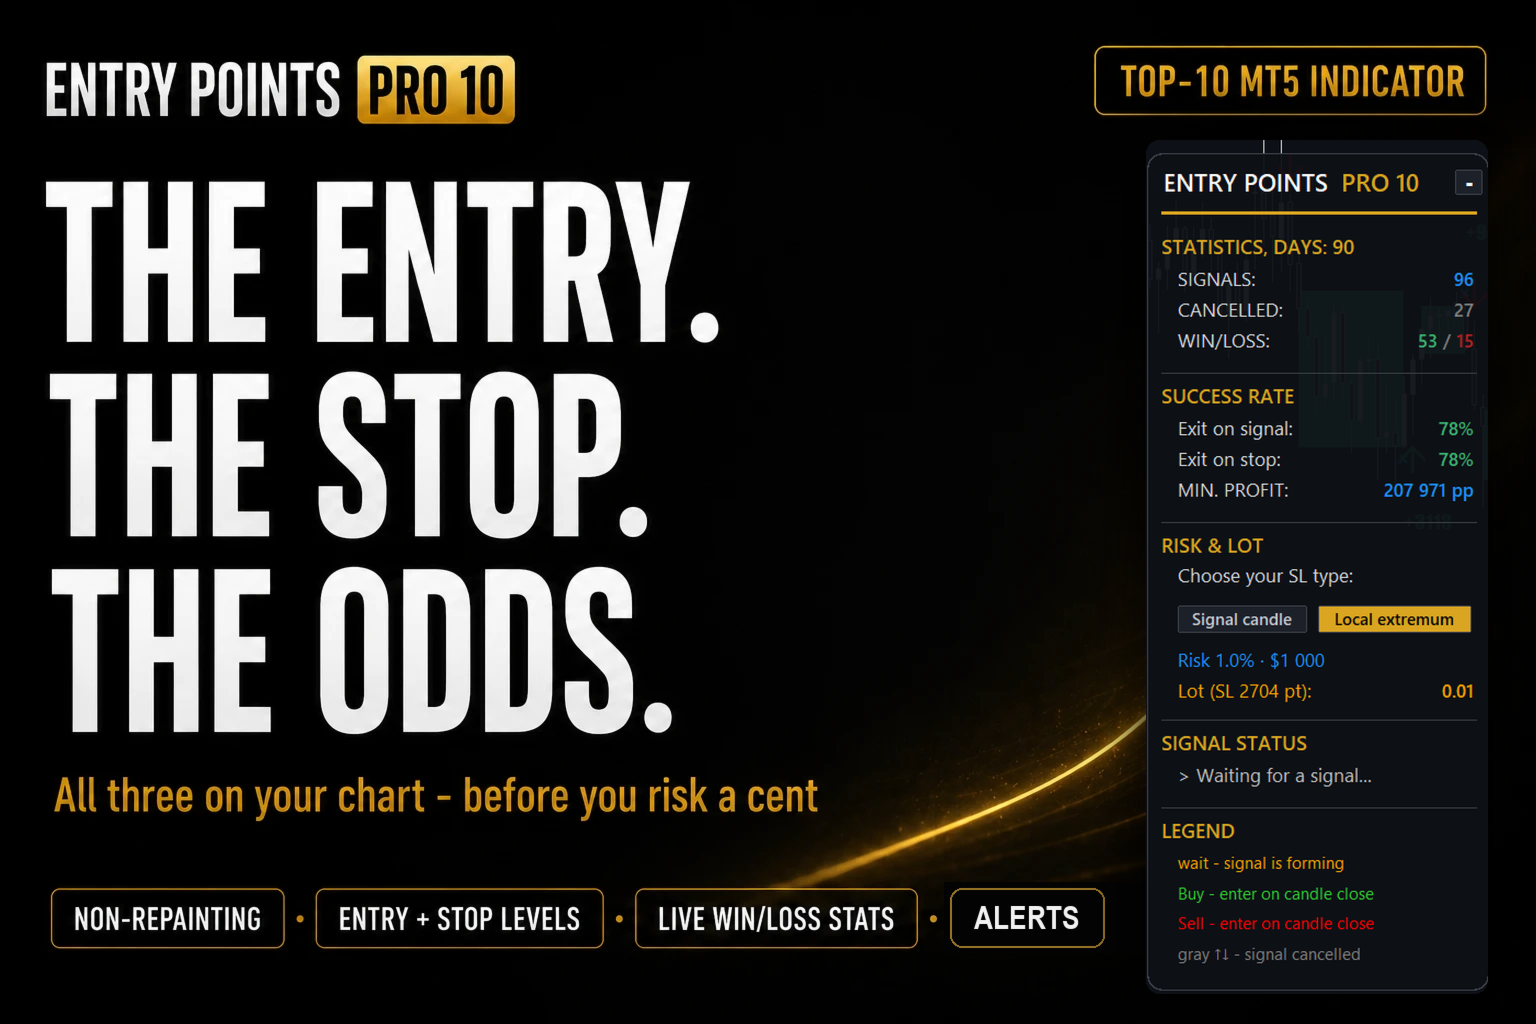
  • 여러분의 차트 위 실시간 통계. 패널이 여러분의 종목과 타임프레임에서 모든 시그널의 결과를 계산합니다: 반전 청산 시와 스탑 청산 시 각각의 성공률, 그리고 포인트 기준 순수 합계. 판매자의 스크린샷이 아니라, 여러분의 데이터로 계산한 여러분의 숫자입니다.
  • 어떤 경쟁 제품과도 비교해 보세요. 자신의 통계를 여러분의 차트 위에 그대로 보여 주기를 두려워하지 않는 지표를 하나라도 더 찾아보시기 바랍니다.
  • 1분 만에 자신의 타임프레임을 고르세요. M5–H4를 차례로 살펴보면, 어느 타임프레임에서 해당 종목의 성공률이 가장 높고 시그널이 충분한지 패널이 즉시 보여 줍니다. 과거가 미래를 보장하지는 않지만 훌륭한 기준점이 됩니다. 더구나 EPP는 시장의 기본 속성을 이용하므로, 그 속성이 작동을 멈추기보다는 시장 자체가 사라지는 쪽이 먼저일 것입니다.

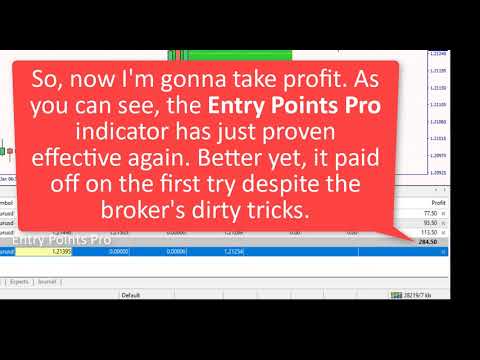
단 하나의 시그널이 지표 가격을 회수한 실제 사례를 담은 영상(6:22)을 확인해 보세요.

취소된 시그널은 리페인팅이 아닙니다

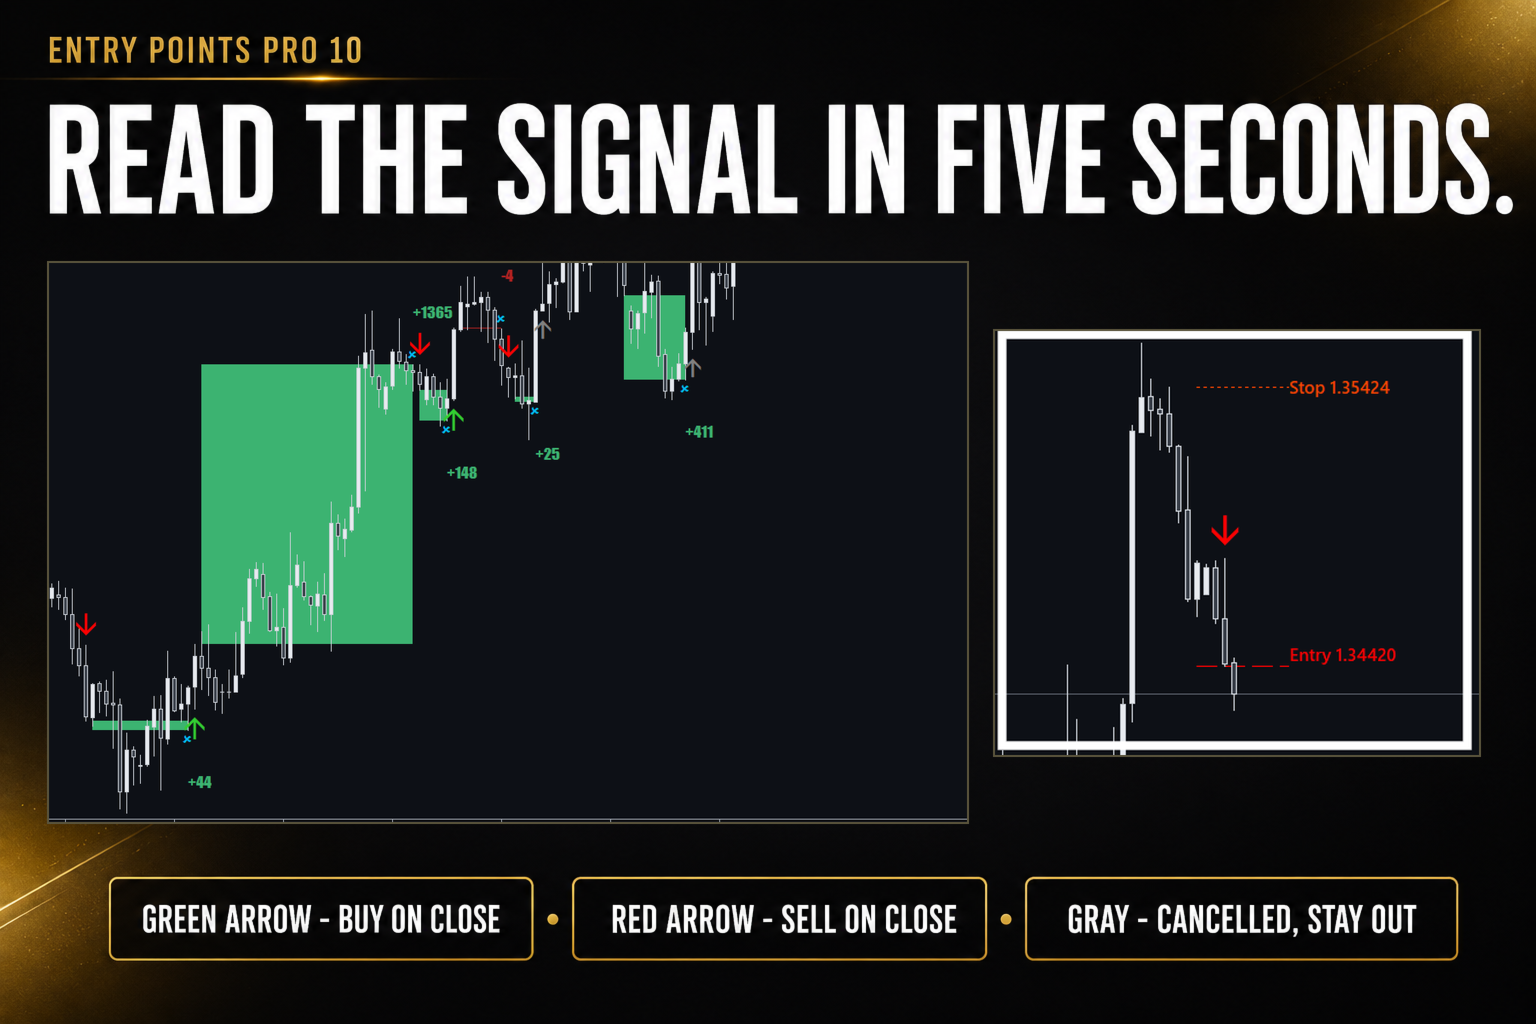
우리가 받아 온 유일한 비판은 ‘시그널이 사라진다’는 것이었습니다. 이 부분이 방식의 핵심이므로 솔직하게 짚어 보겠습니다. 시그널 화살표는 캔들 종가에 나타나지만, 진입은 그 캔들의 극값이 돌파될 때에만 이루어집니다 — 지표가 이 레벨을 가격이 표시된 선으로 그려 줍니다. 다음 캔들이 그 레벨을 돌파하지 못하면 진입은 없었던 것이고, 시그널은 회색으로 표시됩니다: 시장이 움직임을 확인해 주지 않았고, 여러분은 단 1포인트도 잃지 않았습니다. 이것이 약한 시그널을 걸러내는 내장 필터입니다. 대기 주문으로 보수적으로 진입하는 경우 취소된 시그널은 물리적으로 손실을 낼 수 없습니다: Buy Stop 또는 Sell Stop 주문이 체결되지 않을 뿐입니다 — 주문을 삭제하고 다음 시그널을 기다리면 됩니다. 스탑 주문과 리밋 주문으로 올바르게 진입하는 방법은 매뉴얼에서 자세히 다룹니다. 취소된 시그널은 별도의 카운터로 집계되며 성공률 통계에는 포함되지 않습니다. 버전 10에서는 전 과정이 차트에 표시됩니다: 진입 레벨, 실시간 상태, 회색 화살표, CANCELLED 카운터.

회색 화살표가 나타나는 두 번째 경우는 시그널 캔들 크기 자동 필터입니다: 캔들이 비정상적으로 크면 진입에 지나치게 넓은 스탑이 필요하므로, 지표가 돌파 확인 이전 단계에서 해당 시그널을 스스로 걸러냅니다.

차트에서 보게 되는 것

  • 캔들 종가에서만 나타나는 Buy/Sell 화살표 + ‘시그널 형성 중’을 알리는 호박색 조기 경고 마커
  • 돌파 가격이 표시된 진입선과 스탑선
  • 실시간 상태: ‘시그널 대기 → 시그널 형성 중 → 돌파 진입: 가격 → 포지션 보유 중’
  • 비정상 스프레드 경고
  • 알림: 터미널 창, 휴대폰 푸시 알림, 사운드 — 조기 알림과 확정 알림, 중복 없음

가장 중요한 질문에 답하는 패널: ‘이게 정말 작동하기는 하나?’

새 패널은 접거나 숨기거나 원하는 위치로 드래그할 수 있습니다. 여러분의 종목과 타임프레임에서 패널이 보여 주는 것:

  • 통계 기간(기본 90일) 동안의 시그널 수취소된 시그널 수 — 시장이 진입을 확인해 주지 않은 경우로, 단 1포인트도 잃지 않은 시그널입니다.
  • WIN/LOSS — 수익 거래와 손실 거래의 비율.
  • 세 가지 청산 시나리오별 성공률 — 진입은 모두 같아도 포지션 관리 방식은 저마다 다르기 때문입니다:
    1. 시그널 청산 — 이상적인 관리 방식: 지표의 반대 시그널이 나올 때까지 포지션을 유지합니다. 이 방식이 낼 수 있는 상한선입니다.
    2. 시그널 캔들 뒤 스탑 — 짧은 스탑: 거래당 리스크는 최소이지만 더 자주 걸립니다.
    3. 국소 극값 뒤 스탑 — 가장 가까운 스윙 뒤에 두는 스탑: 덜 자주 걸리고 시장과 함께 호흡합니다. 저는 1999년부터 거래해 왔고 가격을 읽는 데 지표가 필요 없어진 지 오래지만, 제가 실제로 쓰는 방식이 바로 이것입니다: 추세에서 최고의 진입 지점은 조정이 끝난 직후이며, 스탑은 가장 가까운 극값 뒤에 둡니다.
    패널의 버튼으로 바로 전환할 수 있으며, 성공률과 스탑선, 랏이 즉시 다시 계산됩니다. 클릭 한 번으로 어떤 스탑 방식이 바로 여러분의 차트에서 가장 좋은 결과를 내는지 확인할 수 있습니다.
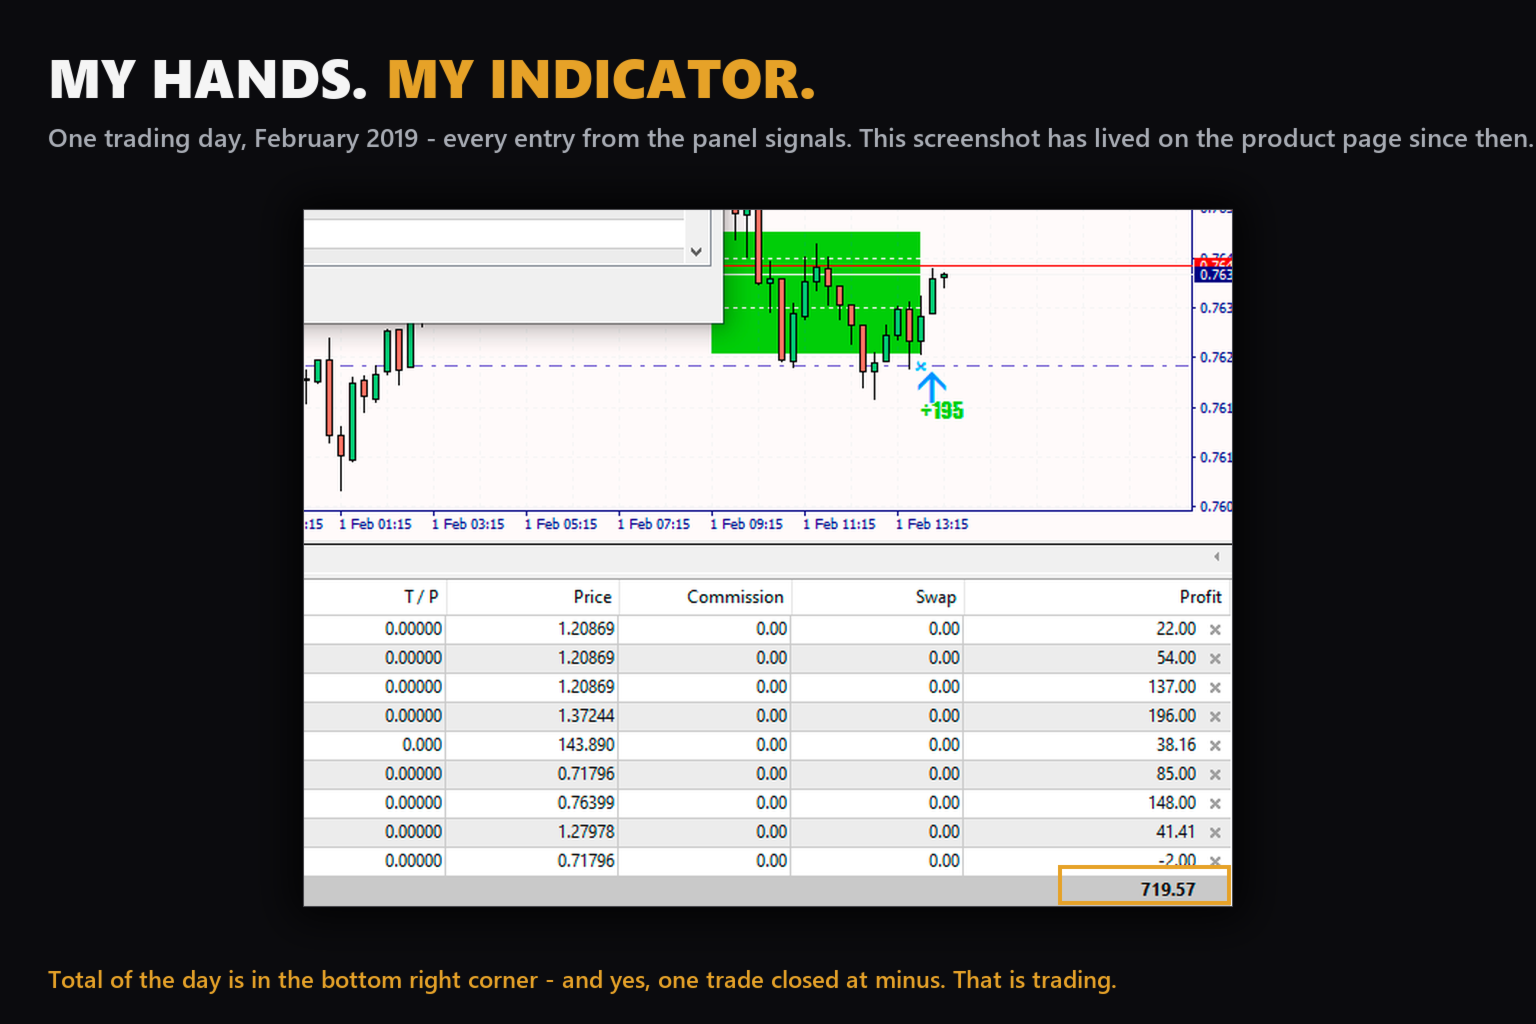
  • MIN. PROFIT — 최소 수익: 기간 내 모든 시그널을 돌파 진입부터 반대 시그널까지 그대로 끌고 갔을 때의 포인트 순합계입니다. ‘최소’인 이유는 최악의 시나리오로 계산했기 때문입니다: 움직임 도중의 익절도, 부분 청산도 없이. 실제 사례가 스크린샷에 있습니다: 표시된 거래는 +107포인트로 기록되었지만, 진입 후 가격은 900포인트 이상 더 움직였습니다. MIN. PROFIT은 천장이 아니라 바닥이며, 그 위의 몫은 여러분의 포지션 관리에 달려 있습니다. 실제 사례는 이 페이지 하단, 설명 아래의 스크린샷에서 확인할 수 있습니다(영상도 그곳에 있습니다).
  • 리스크 기반 랏 계산기: ‘리스크 1% · $1,000 → 랏 0.17’ — 현재 시그널의 실제 스탑을 기준으로 계산합니다. 계산용 예치금은 설정에서 지정합니다: 고정 금액을 입력하거나(예치금이 늘면 갱신하세요), 0으로 두면 지표가 현재 계좌 잔고를 자동으로 가져옵니다. 랏 계산과 진입, 포지션 관리를 로봇에게 맡기고 싶다면 — 이 모든 것을 스스로 수행하며 자동으로 거래하는 EA를 준비하고 있습니다.

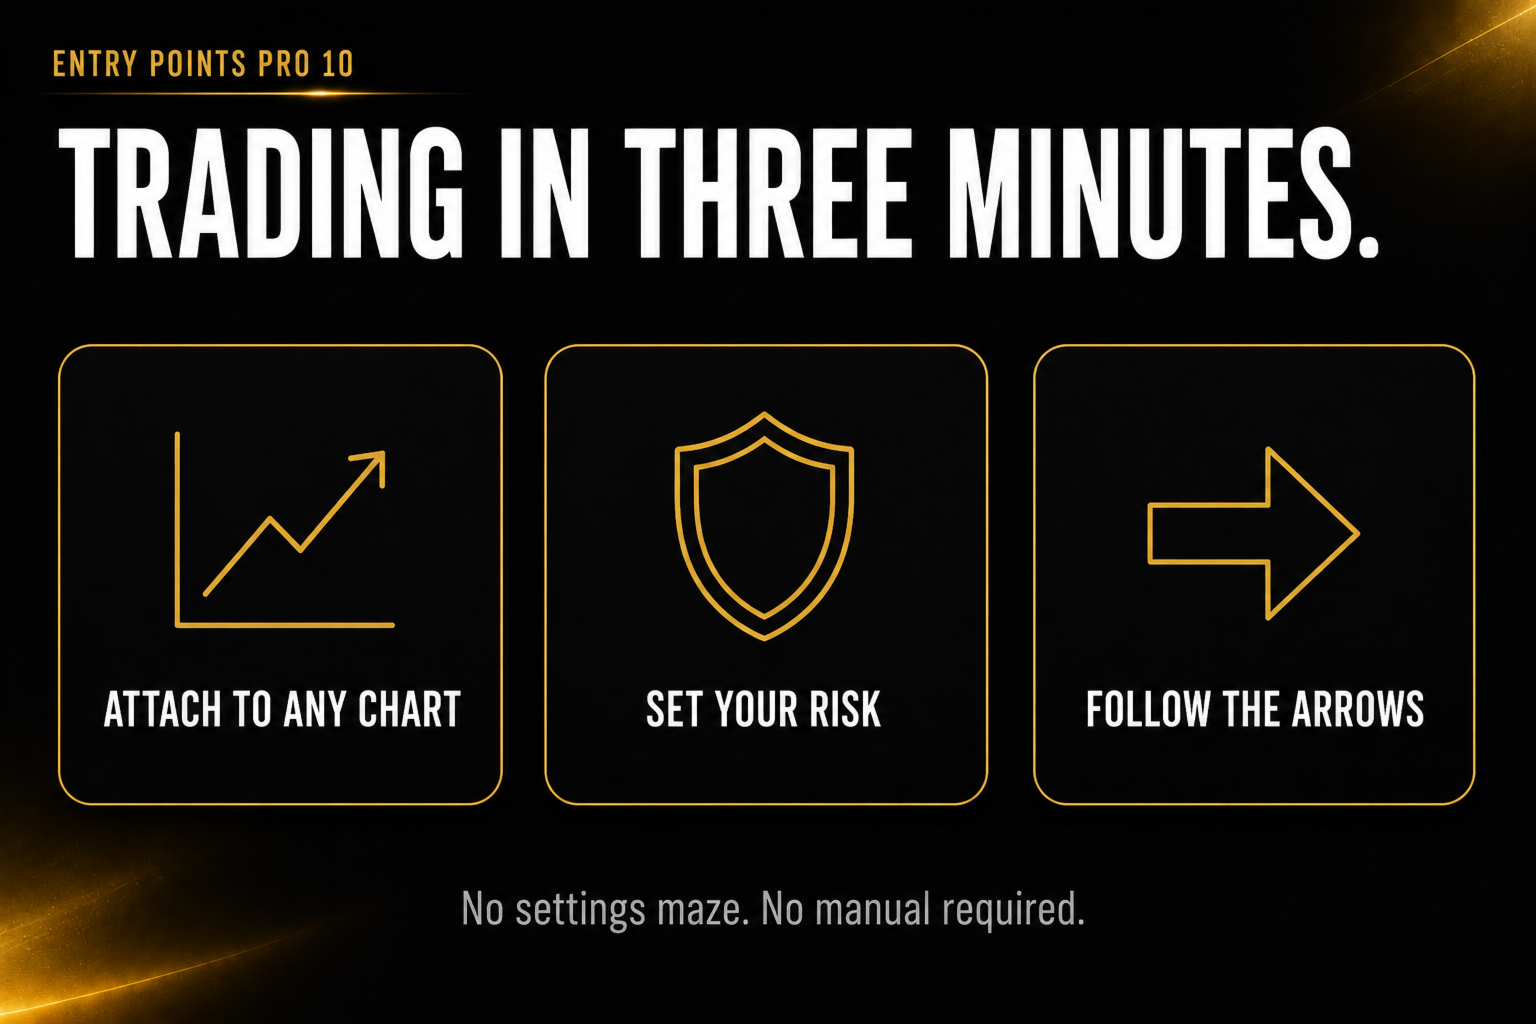
매매 방법 — 3단계

  1. 캔들 종가에 화살표가 나타날 때까지 기다리세요 — 지표가 가격이 표시된 진입 레벨을 그려 줍니다.
  2. 레벨 돌파 시 진입하세요 — 레벨 바로 그 자리에 대기 스탑 주문을 걸어 두는 방법을 권장합니다. 진입은 자동으로 체결됩니다. 스탑은 지표가 보여 주는 레벨 뒤에 두면 되고, 랏은 이미 여러분의 리스크에 맞춰 계산되어 있습니다.
  3. 가격이 기회를 주면 포지션을 본전으로 옮기세요: 리스크는 0이 되고 수익 잠재력에는 제한이 없습니다. 제가 실제로 이렇게 거래합니다. 이후에는 반대 시그널까지 유지하거나, 자신의 스탑으로 관리하세요. 두 시나리오 모두 패널에 정직하게 계산되어 있으니 자신에게 맞는 쪽을 고르시면 됩니다.

영상에서 전략 테스터에서 지표가 작동하는 모습과 제가 지표를 다루는 방법을 보여 드렸습니다. 이전 버전으로 촬영된 영상이며, 곧 버전 10 기준의 새 영상을 만들어 지표를 이용한 실시간 매매를 보여 드리겠습니다. 놓치지 않으시려면 저희 그룹을 구독하세요: 링크는 제 프로필 상단에 있습니다.

버전 10의 새로운 기능

  • 어떤 시장에서든 별도 설정 없이 바로 작동합니다. 시그널 캔들 크기에 대한 스마트 적응형 자동 필터: 비정상적으로 큰 캔들은 지나치게 넓은 스탑을 의미하므로, 그런 시그널은 지표가 스스로 취소합니다(회색 화살표). 금, 암호화폐, 지수, 주식에 더 이상 수동 설정이 필요 없습니다.
  • 실시간 상태 도우미: 지금 무슨 일이 일어나고 있고 다음에 무엇을 해야 하는지 지표가 말로 알려 줍니다.
  • 진입 레벨과 스탑 레벨이 가격과 함께 차트에 그려집니다 — 어디서 진입하고 리스크가 어디에 있는지 한눈에 보입니다.
  • 두 가지 정직한 청산 통계: 반전 기준과 스탑 기준 — 포지션 관리 스타일을 비교해 보세요.
  • 패널의 스탑 선택 버튼, 통계와 랏의 즉각적인 재계산.
  • 리스크 비율과 예치금 기준의 랏 계산기.
  • 조기 + 확정 알림(터미널 창 / 푸시 / 사운드), 중복 없음.
  • 7개 언어 패널: 영어, 러시아어, 스페인어, 독일어, 프랑스어, 이탈리아어, 포르투갈어 — 터미널 언어에 따라 자동 전환됩니다. 그 밖의 터미널 언어(한국어 포함)에서는 패널이 영어로 표시됩니다.
  • 접을 수 있는 패널, 비정상 스프레드 보호, 더 빨라진 코드.

이 지표가 사랑받아 온 이유

  • 리페인팅 없는 시그널 — 캔들 종가에 나타난 뒤 사라지지 않습니다.
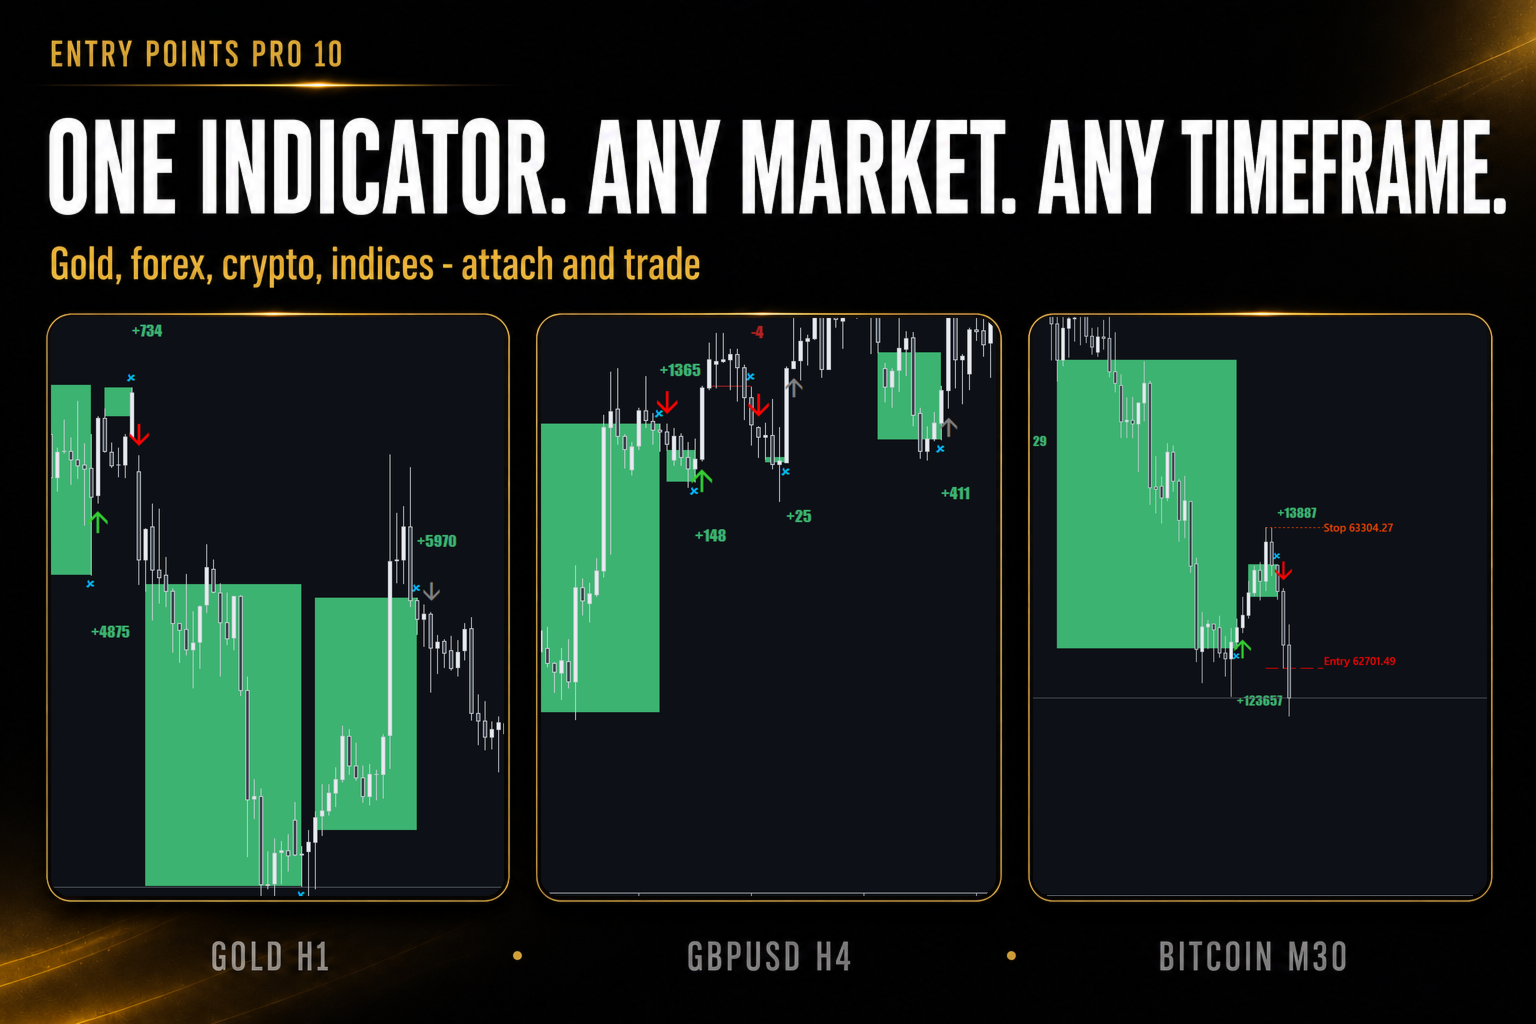
  • 모든 자산: 외환, 금과 금속, 암호화폐, 지수, 주식 — MT5를 지원하는 어느 브로커에서나.
  • M1부터 D1까지 모든 타임프레임.
  • 가벼운 코드 — 터미널을 느리게 하지 않습니다.
  • 초보자와 전문가 모두를 위해: 트레이더들이 ‘트레이더의 바이블’이라 부르게 된 상세 매뉴얼과 개발자의 개인 지원.

개발자 직접 지원

저는 1999년부터 거래해 왔으며 모든 구매자에게 직접 답변합니다. 다시 한번 말씀드립니다: 구매 후 반드시 개인 메시지를 보내 주세요 — ‘트레이더의 바이블’과 지표에 가장 잘 맞는 종목을 찾아 주는 스캐너를 보내 드립니다. 구매, 설치, 사용에 관한 모든 문의도 개인 메시지로 보내 주시면 됩니다.

가격

시작 가격 $99는 첫 10카피에만 적용됩니다. 소진 즉시 가격은 $149로 인상되며, 이후 판매량에 따라 계속 오릅니다. 렌트는 월 $39부터입니다.

미니 FAQ

차트에는 화살표가 있는데 패널은 ‘시그널 대기’라고 표시된다면?
화살표는 과거 이력의 표시입니다. 패널은 바로 지금의 상태를 보여 줍니다. 패널의 상태를 기준으로 매매하세요.

회색 화살표는 무엇인가요?
거래로 이어지지 않은 시그널이며, 이유는 둘 중 하나입니다. 첫째: 다음 캔들이 진입 레벨을 돌파하지 못한 경우 — 시장이 움직임을 확인해 주지 않은 것으로, 패널의 CANCELLED 카운터가 집계합니다. 둘째: 시그널 캔들이 비정상적으로 큰 경우 — 진입에 지나치게 넓은 스탑이 필요해 자동 필터가 시그널을 걸러낸 것입니다. 두 경우 모두 거래가 열리지 않았으므로 아무것도 잃지 않으며, 이 시그널들은 WIN/LOSS에 포함되지 않습니다.

색깔 있는 사각형이 나중에 나타나는데, 리페인팅 아닌가요?
아닙니다. 사각형은 시그널이 아니라 이미 완료된 시그널의 결과를 시각화한 통계입니다. 매매 화살표는 절대 움직이지 않습니다.

제 성공률이 스크린샷과 다른 이유는?
통계는 여러분의 종목, 타임프레임, 기간을 기준으로 계산됩니다. 이것이 이 기능의 장점입니다: 실제로 거래하려는 바로 그곳의 진짜 숫자를 보게 됩니다.

‘시그널 청산’과 ‘스탑 청산’은 무엇이 다른가요?
시그널의 흐름은 하나이고 포지션 관리 시나리오가 둘입니다: 반전까지 유지하거나, 스탑으로 관리하거나. 두 수치 모두 여러분 차트의 실제 히스토리로 계산됩니다.

패널은 어떤 언어로 표시되나요?
터미널 언어를 자동으로 따라갑니다: English, Русский, Español, Deutsch, Français, Italiano, Português. 한국어는 아직 지원되지 않으므로, 한국어 터미널에서는 패널이 영어로 표시됩니다. Buy/Sell, WIN/LOSS 같은 용어는 국제 공통이라 모든 언어에서 동일합니다.
리뷰 270
Ravinder Kumar
62
Ravinder Kumar 2026.07.19 14:42 
 

⭐⭐⭐⭐⭐ (5/5) I've been using Entry Points Pro for a while now, and it's a solid tool for identifying potential trade entries. The signals are clean and easy to understand, making it useful for both beginners and experienced traders. It doesn't guarantee winning trades—which no indicator can—but when combined with proper price action, risk management, and market structure, it performs well.

Sergey84
24
Sergey84 2026.07.16 09:06 
 

Отличный индикатор, если подходить с умом и не лезть во все сделки подряд.

Longus1887
211
Longus1887 2026.07.16 05:48 
 

A must have indicator for manual trading. Very straightforward. Invest paid ou after one trading day!!

추천 제품
Volume flow Profile
Israr Hussain Shah
Master Edition은 거래량과 자금 흐름의 관점을 통해 시장 구조를 시각화하도록 설계된 전문가급 분석 도구입니다. 표준 거래량 지표와 달리, 이 도구는 차트에 일일 거래량 프로필을 직접 표시하여 가격 발견이 발생한 위치와 "스마트 머니"가 위치한 곳을 정확하게 볼 수 있게 합니다. 이 Master Edition은 명확성과 속도를 위해 설계되었으며, 로드 시 차트 레이아웃을 즉시 아름답게 만드는 독특한 자동 테마 동기화 시스템을 특징으로 합니다. 주요 기능: 진정한 자금 흐름 계산: 표준 틱 거래량을 넘어섭니다. "Use Money Flow"를 활성화하면 거래량이 가격에 따라 가중치가 부여되어 특정 가격 수준에서의 실제 자본 투입을 드러냅니다. 가치 영역(VA) 시각화: 가치 영역(기본값: 거래량의 70%)을 자동으로 계산합니다. VA Fill: 통제 구역을 즉시 식별하기 위해 가치 영역 배경을 음영 처리합니다. 주요 수준: 통제점(POC), 가치 영역 고점(VAH), 가치 영


Angus Orderflow Heatmap
Mr Monthon Chaipreechapat
Volume Footprint & Heatmap Indicator This indicator combines Volume Footprint and Heatmap visualization, inspired by the Order Flow and Heatmap concepts found in Bookmap. Unlike futures markets, the Forex market does not provide real exchange-traded volume data. Instead, it only offers Tick Volume . This indicator is designed to simulate Bookmap-style market visualization as closely as possible using the available Tick Volume data. Because the indicator relies on Tick Volume, the quality and acc
This z-score indicator shows the correct z-score of an asset, as it uses the normalized price data for calculation, which is the only correct way. Z-score is only applicable for normal distributed data, therefore not the actual price is considered, but the normalised returns, which were assumed to follow a normal distribution. Returns are mean reverting and assumed to follow a normal distribution, therefore z-score calculation of returns is more reliable than z-score on price, as price is NOT m
Delta Profile Volume
Teresinha Moraes Correia
기술 설명 – MetaTrader 5용 Delta Profile Delta Profile 은 MetaTrader 5에서 정의된 캔들 범위 내의 거래량 흐름을 세부적으로 분석하기 위해 설계된 지표입니다. 이 도구는 각 가격 수준에서 양의 거래량(상승과 관련) 과 음의 거래량(하락과 관련) 간의 불균형을 구조화하고 시각화합니다. 이를 통해 사용자는 실제로 거래가 집중되는 가격 영역과 시장 불균형이 형성되는 구간을 명확하게 파악할 수 있습니다. 핵심 개념 지표는 가격 레벨 을 인식하고 이를 양의 거래량, 음의 거래량 및 순 델타(양-음 차이)로 분류합니다. 각 가격 레벨은 수평 막대 로 차트에 표시되며, 거래가 집중되는 구간을 직관적으로 보여줍니다. 사용자는 분석할 캔들의 개수 , 가격 반올림 정밀도 , 최대 표시 레벨 수 , 표시 옵션 등을 직접 설정할 수 있습니다. 주요 기능 가격 레벨 매핑 : 사용자가 지정한 자릿수에 맞게 가격을 반올림하여 거래량을 집계합니다. 순 델타 계산 : 양
Phantom Edge SMC
Nattapon Chuekamhod
Phantom Edge SMC — The Ultimate Smart Money Indicator for MT5 Tired of manually drawing structures while trading SMC or ICT concepts? Let Phantom Edge SMC do the heavy lifting for you. Key Features Internal & Swing Structure: Automatically detects BOS and CHoCH across two structural levels. Order Blocks (OB): Identifies Internal and Swing OBs with automated mitigation tracking. Equal Highs / Lows: Highlights EQH / EQL to pinpoint Liquidity pools. Fair Value Gaps (FVG): Displays FVGs with
Blahtech Market Profile MT5
Blahtech Limited
5 (10)
Was: $249  Now: $99   Market Profile defines a number of day types that can help the trader to determine market behaviour. A key feature is the Value Area, representing the range of price action where 70% of trading took place. Understanding the Value Area can give traders valuable insight into market direction and establish the higher odds trade. It is an excellent addition to any system you may be using. Inspired by Jim Dalton’s book “Mind Over Markets”, this indicator is designed to suit the
Introduction This indicator detects volume spread patterns for buy and sell opportunity. The patterns include demand and supply patterns. You might use each pattern for trading. However, these patterns are best used to detect the demand zone (=accumulation area) and supply zone (=distribution area). Demand pattern indicates generally potential buying opportunity. Supply pattern indicates generally potential selling opportunity. These are the underlying patterns rather than direct price action. T
SuperAgent v7.0 Diamond Pro - Quantitative Scoring & Dynamic Risk Description: SuperAgent v7.0 Diamond Pro is a high-fidelity MT5 adaptation of an advanced Python financial algorithm. This Expert Advisor (EA) combines a   Quantitative Scoring Engine   with   Dynamic Risk Management   to provide professional-grade portfolio management. Key Features: Multi-Layered Decision Engine:   Evaluates the market through three dimensions: Low-Lag Signal Processing, Trend Bias Confirmation, and Momentum Sco
Adjustable Consecutive Fractals  looks for 2 or more fractals in one direction and sends out a on screen alert, sound alert and push notification, for strong reversal points . Adjustable Consecutive Fractals, shows the fractals on chart along with a color changing text for buy and sell signals when one or more fractals appear on one side of price. Adjustable Consecutive Fractals is based Bill Williams Fractals . The standard Bill Williams fractals are set at a non adjustable 5 bars, BUT withe th
Boom Crash SMC
Israr Hussain Shah
Here   our more valuable tools SMC Trend Trading   ,  Easy SMC Trading  ,  Institutional SMC Architect Volume Analysis Tools  ,  Volume flow Profile  ,  Market volume profile  , FVG with Volume  , Liquidity Heatmap Profile  ,  Volume Spread Analysis Deriv boom and crash index spike killer system you can use it only on m5 timeframe  follow the structure and get signal with alert on phone open trade set sl tp and enjoy easy analysis and trading made simple 
Veles ZigZag
Gennady Mazur
Представлен принципиально новый индикатор ZigZag, который отличается от стандартного абсолютной легкостью, быстродействием расчетов и очень высокой точностью. В основе индикатора заложен принцип цикличности рынка с совокупностью анализа количества текущих баров и их основных ценовых уровней. Чем меньше баров для определения расчетов, тем более агрессивная постройка линий индикатора. Как и в  стандартном индикаторе перерисовывается только последняя линия, при изменении достигнутого экстремума. П
Professional Non-Repainting TMA Channel Indicator for MetaTrader 5 TMA Channel PRO Non Repaint is a professional trend and volatility channel indicator designed for traders who work with dynamic support/resistance zones, trend continuation, reversals, and channel-based trading systems. MAIN FEATURES • Non-Repainting Logic • Dynamic TMA Channel • Vertical Histogram Cloud • Median Trend Lines • Buy & Sell Signal Zones • Adaptive Volatility Structure • Multi-Timeframe Compatibility • Suita
Breakout Boxes with Volume Pressure This indicator automates the identification of key consolidation zones (Supply and Demand) based on Market Pivots and Volatility (ATR). Unlike standard support/resistance tools, this indicator provides a unique   Volume Pressure Analysis   inside every box, giving you insight into the battle between Buyers and Sellers before a breakout occurs. Key Features Automated Supply & Demand Zones:   Automatically detects significant Pivot Highs and Lows to draw dyna
Value Chart Candlesticks
Flavio Javier Jarabeck
4.57 (14)
The idea of a Value Chart indicator was presented in the very good book I read back in 2020 , " Dynamic Trading Indicators: Winning with Value Charts and Price Action Profile ", from the authors Mark Helweg and David Stendahl. The idea is simple and the result is pure genius: Present candlestick Price analysis in a detrended way! HOW TO READ THIS INDICATOR Look for Overbought and Oversold levels. Of course, you will need to test the settings a lot to find the "correct" one for your approach. It
FREE
Here   our more valuable tools SMC Trend Trading   ,  Easy SMC Trading  ,  Institutional SMC Architect Volume Analysis Tools  ,  Volume flow Profile  ,  Market volume profile  , FVG with Volume  , Liquidity Heatmap Profile  ,  Volume Spread Analysis 2. Key Features Dynamic Filtering : The core feature. As soon as the current price crosses a historical liquidity level, that level disappears. This reduces chart clutter and prevents you from trading off "dead" support/resistance. Liquidity Heatma
GDS Renko Entry Helper
Andrey Goida
1 (1)
GDS Renko Entry Helper - Free Renko Price Interaction Indicator for MetaTrader 5 GDS Renko Entry Helper is a free Renko price interaction indicator for MetaTrader 5. It helps traders highlight important areas where price reacts, slows down, returns to a zone or changes behavior around support and resistance. The tool is designed for manual Renko analysis. It does not generate buy or sell signals and does not tell the trader when to enter the market. Its purpose is to help focus attention on area
FREE
Color Histogram Volume Set
Ricardo Almeida Branco
Do you use volume in your reading of the market? Certainly many traders use it, and do not imagine operating without it. The Color Histogram Volume Set indicator allows the user to choose the value that he considers interesting to monitor. When you pass this you will have visual confirmation and if you want you will also have the audible alert that is given by the indicator. Of course, there are other ways to try to find a high volume, such as assessing whether the volume is above av
Stormer RSI 2
Ricardo Rodrigues Lucca
This strategy was learned from Stormer to be used on B3. Basically, 15 minutes before closing the market, it will check RSI and decided if it will open an position. This strategy do not define a stop loss. If the take profit reach the entry price it will close at market the position. The same happens if the maximal number of days is reached. It is created to brazilian people, so all configuration are in portuguese. Sorry Activations allowed have been set to 50.
VOLUME PROFILE SAF-XII MT5용 전문가급 마켓 프로파일 분석 도구 (그리드 스타일 트레이더를 위한 드림 인디케이터) 볼륨 프로파일(Volume Profile)이란? 볼륨 프로파일은 단순히 '시간'에 따른 거래량을 보여주는 일반 지표와 달리, 특정 '가격 수준'에서의 거래 활동을 표시하는 전문 기관용 도구입니다. 설정한 기간 내에 거래가 '어디서' 발생했는지를 시각화하여 다음을 식별할 수 있도록 돕습니다. 가치 영역 (VAH/VAL) – 전체 거래의 대부분이 발생한 가격대. 제어 지점 (POC) – 거래량이 가장 많이 집중된 단일 가격 수준. 유동성 불균형 – 각 가격대에서의 매수(Bull) vs 매도(Bear) 지배력. 지지/저항 – 실제 거래 활동에 기반한 자연적인 가격 지지 및 저항선. 3가지 작동 모드 – "설정 후 방치(Set and Forget)" 가능 VP_MANUAL (스윙 트레이딩 및 주요 레벨 분석) 사용자가 수직선을 드래그하여 분석 범위를 직접
VWAP Z-Score (Rolling) Positive values indicate price trading above VWAP, while negative values indicate price trading below VWAP. Typical Use Cases Mean-reversion strategies Overbought / oversold detection VWAP-based statistical analysis Confirmation tool for discretionary or algorithmic trading Risk-aware trade entries and exits Notes Uses tick volume for VWAP weighting (standard for Forex symbols). The indicator does not repaint. Designed for analytical and decision-support purposes only.
Here   our more valuable tools SMC Trend Trading   ,  Easy SMC Trading  ,  Institutional SMC Architect Volume Analysis Tools  ,  Volume flow Profile  ,  Market volume profile  , FVG with Volume  , Liquidity Heatmap Profile  ,  Volume Spread Analysis The    Liquidity Heatmap   is a sophisticated institutional trading tool designed to reveal where over-leveraged traders are trapped. By calculating estimated liquidation levels based on volume spikes and leverage, this indicator draws a dynamic "h
Volume Profile Advance
Israr Hussain Shah
Daily & Composite Volume Profile   This is a professional-grade market profile tool designed for MetaTrader 5. It utilizes a   Dual-Profile System   to visualize supply, demand, and liquidity concentrations. Key Features Left Side: Daily Session Profiles Automatically identifies the start and end of every trading day. Generates a unique Volume Profile for each individual day. Allows you to see how value migrated from yesterday to today (e.g., Is today's volume higher or lower than yesterday?).
WolfSight AI
Marius Ovidiu Sunzuiana
The WolfSight AI  is a next‑generation market analyzer built for traders who demand speed, clarity, and institutional‑grade intelligence. Powered by a multi‑layer AI decision framework, this indicator evaluates market conditions in real time and transforms them into clear BUY, SELL, or WAIT signals — all displayed through a sleek, interactive panel. This system doesn’t rely on simple crossovers or retail‑grade formulas. Instead, it uses a proprietary AI‑inspired scoring model that processes mul
Volume Trade Levels
Mahmoud Sabry Mohamed Youssef
The idea behind this indicator is very simple , First it contains 2 mechanisms to place your trades: 1- Enter the Pips you want to duplicate to price levels. 2- Automatically let the indicator specify the largest Buy / Sell Volume Candle and place duplicated levels based on the candle itself. How it works: 1- Enter the Pips you want to duplicate to price levels:    1- once the indicator is loaded you will need first to Specify the number of pips in the indicator Configuration window ,you can g
Here   our more valuable tools SMC Trend Trading   ,  Easy SMC Trading  ,  Institutional SMC Architect Volume Analysis Tools  ,  Volume flow Profile  ,  Market volume profile  , FVG with Volume  , Liquidity Heatmap Profile  ,  Volume Spread Analysis The Trading Guide MT5 Indicator is a powerful psychological trading assistant designed to keep traders disciplined, focused, and emotionally balanced. This innovative indicator displays real-time motivational messages, trading rules, and analysis
FREE
Support & Resistance Auto Plot Lines Indicator for MT5 – Perfect for Scalping! Make your trading easier with our Support & Resistance Auto Plot Lines indicator for MT5. This powerful tool automatically detects key support and resistance levels on your chart, helping you make better trading decisions with minimal effort. Why Choose This Indicator? Perfect for Scalping – Quickly identify strong price zones for fast, precise entries and exits. Automatic Level Detection – No need to manually dra
This Indicator adding power to traditional zigzag indicator. With High-Low numbers in vision it will be easier to estimate change of trend by knowing the depth of each wave. Information including points, pips, percentage%, and #bars can be displayed based on configuration. All information is real-time update. This indicator is especially useful in sideway market to buy low sell high.
FibExtender
Syed Oarasul Islam
This Indicator draws Fibonacci Extension levels in two different ways. You can select whether to draw Fibonacci Extension levels based on your favourite ZigZag settings or you can let the indicator to draw Fibonacci Extension  level based on given number of Bars or Candles.  You can also set Mobile and Email notification for your favourite Extension  levels individually. With this indicator you will not have to feel lonely as the it can generate Voice alerts, which will keep you focused on your
Caicai L&S Yield Histogram Important Notice: This indicator is an integral tool of the automated EA Caicai Long and Short Pair Trading . This indicator visually displays the percentage deviation (Yield %) of a pair's current spread relative to its own historical mean. It is an excellent tool for quickly visualizing the gross financial potential of a market distortion in Long & Short operations. Main Features: Percentage Visualization: Understand the size of the distortion in palpable percentage
"Adjustable Fractals"는 프랙탈 지표의 고급 버전으로, 매우 유용한 거래 도구입니다! .................................................................................................................. - 알다시피 표준 프랙탈 MT5  지표에는 설정이 전혀 없습니다. 이는 거래자에게 매우 불편합니다. - Adjustable Fractals는 이 문제를 해결했습니다. 필요한 모든 설정이 있습니다. - 지표의 조정 가능한 기간(권장 값 - 7 이상). - 가격의 고점/저점으로부터 조정 가능한 거리. - 프랙탈 화살표의 조정 가능한 디자인. - 표시기에는 모바일 및 PC 알림 기능이 내장되어 있습니다. 여기를 클릭하여 고품질 트레이딩 로봇과 지표를 확인하세요! 이 MQL5 웹사이트에서만 제공되는 오리지널 제품입니다.
이 제품의 구매자들이 또한 구매함
Neuro Poseidon MT5
Daria Rezueva
4.8 (54)
Neuro Poseidon is a new indicator by Daria Rezueva. It combines precise trading signals with adaptive TP/SL levels - creating best possible trades as a result! Message me and get  Neuro Poseidon Assistant  as a gift to automize your trading process! What makes it stand out? 1. Proven profitability on all assets and timeframes 2. Only confirmed BUY and SELL signals present on the chart 3. Adaptive TP & SL levels generated by the software for each trade 4. Easy to understand - suitable for al
M1 Quantum MT5
Hamed Dehgani
4.56 (9)
M1 Quantum을 이용한 실시간 트레이딩 신호 : 신호   ( Quantum Trade Assistant 에 의해 거래가 자동으로 실행되며, 이 제품에 무료 로 포함되어 있습니다.) 가격 계획: 현재 가격: $169 (얼리 어답터 혜택) 다음 예정 가격: $189 예정 소매 가격: $299 개발자 안내: 구매 후 저에게 연락하시면 최신 권장 설정 파일(Set File) , 사용 팁, 그리고 다른 M1 Quantum 사용자들과 소통할 수 있는 VIP 지원 그룹 초대장을 받으실 수 있습니다. 자주 묻는 질문 - 설정 파일 - 설치 가이드 M1 Quantum 은 M1 전용 전문 트레이딩 시스템으로, 손절(Stop Loss), 익절(Take Profit), 그리고 스마트 자금 관리 기능이 내장된 빠르고 정확한 거래 신호를 제공합니다. M1 Quantum 은 연속 수익 거래 에 집중하여 계좌를 빠르게 성장시키도록 설계된 전문 자금 관리 시스템을 포함하고 있습니다. M1 Quantum
UZFX {SSS} 스캘핑 스마트 시그널 v4.0 MT5는 급변하는 시장에서 정확한 실시간 시그널을 필요로 하는 스캘퍼, 데이 트레이더, 스윙 트레이더를 위해 설계된 리페인팅이 없는 고성능 트레이딩 지표입니다. (UZFX-LABS)에서 개발한 이 지표는 가격 움직임 분석, 추세 확인 및 스마트 필터링을 결합하여 모든 통화 쌍과 시간대에서 높은 확률의 매수 및 매도 신호, 경고 신호, 추세 지속 기회를 생성합니다. 거래에 대한 의구심을 떨쳐버리고, 명확성, 정밀성, 그리고 규율 있는 시장 실행을 원하는 트레이더를 위해 설계된 체계적인 신호 시스템을 따르기 시작하세요. 제 추천* 최적의 시간대: 15분 이상. {H1}이 제가 가장 선호하는 시간대입니다. 그리고 그 결과는 정말 놀라울 정도입니다...!! 주요 기능 업데이트 • 자동 매수 및 매도 신호 감지 • 고급 반전 인식 로직 • 잠재적인 시장 반전 전 조기 경고 신호 • 추세 지속 확인 신호 • 진입, 손절, TP1, TP2,
ARIPoint
Temirlan Kdyrkhan
1 (1)
ARIPoint is a powerful trading companion designed to generate high-probability entry signals with dynamic TP/SL/DP levels based on volatility. Built-in performance tracking shows win/loss stats, PP1/PP2 hits, and success rates all updated live. Key Features: Buy/Sell signals with adaptive volatility bands Real-time TP/SL/DP levels based on ATR Built-in MA Filter with optional ATR/StdDev volatility Performance stats panel (Success, Profit/Loss, PP1/PP2) Alerts via popup, sound, push, or email Cu
Quant Direction MT5
Georgios Kalomoiropoulos
Quant Direction 은 3D 시장 분석 도구입니다. 다양한 매개변수에 걸쳐 정확한 백분율 편차를 계산하면서 완벽하게 객관적인 알고리즘 기반 시장 분석을 제공합니다. 첨단 AI 기반 모델링 도구와 엄격한 테스트를 거쳐 개발된 이 알고리즘은 타의 추종을 불허하는 정확도로 시장을 분석합니다. 플랫폼에서 모든 통화쌍 또는 금융 상품을 분석할 수 있습니다. 단기 거래, 데이 트레이딩, 스윙 트레이딩 등 어떤 유형의 거래를 하든 Quant Direction은 최적의 선택입니다. 운영자가 되는 것의 진정한 이점 퀀트 디렉션의 진정한 장점은 감정, 눈의 피로, 과도한 분석을 완전히 배제한다는 점입니다. 더 이상 수십 개의 차트를 일일이 살펴보며 방향을 찾거나 자신의 판단에 끊임없이 의문을 품을 필요가 없습니다. 이 시스템은 8개의 시간 간격(5개월에서 수개월까지)을 밀리초 단위로 처리합니다. 특정 시점의 주요 시장 참여자를 정확하게 식별하여 항상 성공 확률이 가장 높은 방향으로 거래할
The Oracle Pro
Ottaviano De Cicco
5 (1)
The Oracle Pro: Synthetic Multi-Timeframe Bias Engine for MT5 ️ Summer Launch Offer — Get The Oracle Pro for USD 199 (early buyers). Price rises with traction; final price USD 399. The Oracle Pro is a premium multi-timeframe bias engine for MetaTrader 5, built for demanding and professional traders. It answers one question with discipline: what is the directional bias on each timeframe right now, how strong is it, and how much do the timeframes agree? Everything is computed on closed bars only
Bill Williams Advanced
Siarhei Vashchylka
5 (11)
Bill Williams Advanced is designed for automatic chart analysis using Bill Williams' "Profitunity" system. The indicator analyzes four timeframes at once. Manual (Be sure to read before purchasing) Advantages 1. Analyzes the chart using Bill Williams' "Profitunity" system. Signals are displayed in a table in the corner of the screen and on the price chart. 2. Finds all known AO and AC signals, as well as zone signals. Equipped with a trend filter based on the Alligator. 3. Finds "Divergence Bar
CISD Levels Pro automatically draws CISD Buy and Sell levels directly on your chart. It highlights pending levels while they are forming, then marks confirmed levels after the confirmation candle closes. Optional confirmation arrows help you spot the signal quickly. This tool is designed for traders who want clean, simple CISD level visualization without extra indicators or clutter. Key Features Draws Bullish (BUY) CISD levels and Bearish (SELL) CISD levels Shows Pending levels (dashed) and
PrimeScalping
Temirlan Kdyrkhan
PrimeScalping is a powerful trading companion designed to generate high-probability entry signals with dynamic TP/SL/DP levels based on volatility. Built-in performance tracking shows win/loss stats, PP1/PP2 hits, and success rates — all updated live. Key Features: Buy/Sell signals with adaptive volatility bands Real-time TP/SL/DP levels based on ATR Built-in MA Filter with optional ATR/StdDev volatility Performance stats panel (Success, Profit/Loss, PP1/PP2) Alerts via popup, sound, push, or e
Transaction Speed MT5
Ivan Stefanov
5 (4)
이 지표는 시장에서 관심이 나타나는 영역 을 강조 표시한 후, 주문이 누적되는 영역 을 보여줍니다. 이는 **대규모 오더북(호가창)**처럼 작동합니다. 이것은 거대한 자금 을 위한 인디케이터입니다. 성능은 탁월하며, 시장에서 어떤 관심이 있든 반드시 포착할 수 있습니다 . (이것은 완전히 새로 작성되고 자동화된 버전 입니다 – 이제 수동 분석은 필요하지 않습니다.) **거래 속도(Transaction Speed)**는 새로운 개념의 인디케이터로, 시장에 대규모 주문이 언제, 어디에 쌓이는지를 보여주며 , 그 이점을 분석합니다. 매우 초기 단계에서 트렌드 전환 을 감지할 수 있습니다. FX 시장에서 흔히 사용하는 "거래량(volume)"은 오해입니다. 실제로는 시간당 가격 변화량 이므로, 올바른 용어는 거래 속도 입니다. 우리가 어떻게 사고하고, 행동하며, 분석하느냐 가 가장 중요합니다. 분석 패러다임의 전환 은 필수적입니다. 이 인디케이터는 외환 시장에서의 볼륨 개념을 논리적으로
Gem SIGNAL
Shengzu Zhong
5 (1)
GEM Signal Pro GEM Signal Pro는 MetaTrader 5용 추세추종형 지표로, 차트에서 더 명확한 신호, 더 구조적인 트레이드 설정, 그리고 더 실용적인 리스크 관리를 원하는 트레이더를 위해 설계되었습니다. 단순한 화살표만 표시하는 것이 아니라, GEM Signal Pro는 전체 트레이드 아이디어를 더 깔끔하고 읽기 쉬운 방식으로 보여줍니다. 조건이 확인되면 진입가, 손절가, 목표가를 차트에 표시하여 트레이더가 설정을 더 효율적으로 검토할 수 있도록 도와줍니다. 작동 방식 이 지표는 먼저 내부 로직에 따라 유효한 초기 신호를 식별합니다. 확인 조건이 충족되면, GEM Signal Pro는 차트에 전체 설정을 표시합니다. 이를 통해 트레이더는 거래 구조를 더 명확하게 보고, 수동 분석 작업을 줄일 수 있습니다. 차트에 표시되는 거래 레벨 확인된 신호에 대해, GEM Signal Pro는 다음을 표시할 수 있습니다. 진입가 손절가 목표가 1 목표가 2 목표가 3 손
KURAMA GOLD SIGNAL PRO (MT5) — 7중 필터 · 자동 TP/SL · 품질 점수 · 시그널 기록 저장 | XAUUSD 완전 트레이딩 시스템 실시간 리페인트 없음. 시그널이 나타나는 순간 화살표, 진입, TP, SL이 그 자리에 고정되어 이후 절대 움직이지 않습니다. 여러분이 거래하는 것은 바로 이 실시간 시그널입니다. 그리고 v7.20에서는 실제로 발신된 모든 시그널이 자동 저장되어 재시작 후에도 정확히 복원됩니다. 구매자 전용 보너스 평생 라이선스를 구매하시면 AI Zone Radar($59 상당) + 완전 PDF 매뉴얼을 무료로 드립니다. 제품 가격에 더해 $59 상당의 보너스가 따라옵니다. 구매 후 MQL5로 메시지를 보내주세요. AI Zone Radar: https://www.mql5.com/en/market/product/175834 골드 트레이더 커뮤니티에서 실제로 사용되며 정확성과
Azimuth Pro
Ottaviano De Cicco
5 (7)
Azimuth Pro V2: Synthetic Fractal Structure and Confirmed Entries for MT5 Overview Azimuth Pro is a multi-level swing structure indicator by Merkava Labs . Four nested swing layers, swing-anchored VWAP, ABC pattern detection, three-timeframe structural filtering, and closed-bar confirmed entries — one chart, one workflow from micro-swings to macro-cycles. This is not a blind signal product. It is a structure-first workflow for traders who care about location, context, and timing. ️ Summer Sale
Meravith Scanner
Ivan Stefanov
5 (2)
MERAVITH SCANNER는 MetaTrader 5용 전문 금융 시장 지표로, 여러 분석 도구를 하나의 통합 시스템으로 결합합니다. 독점적인 거래량 가중 평균 가격(VWAP) 방법론을 사용하여 모든 계산을 자동으로 수행하며, 주관적인 해석을 완전히 배제합니다. 이 지표는 모든 자산 클래스(Forex, 주식, 지수, 상품, 암호화폐)와 M1부터 월간 차트까지 모든 시간 프레임에서 작동합니다. 기본 원리는 “가격은 거래량을 따른다”입니다. MERAVITH는 기관 거래량이 집중되는 위치를 식별하고, 그 집중에서 수학적으로 정확한 가격 수준을 도출합니다. 예측이나 투기를 하지 않으며, 계산만 수행합니다. MERAVITH SCANNER를 사용하면 28개의 주요 Forex 통화쌍을 모든 시간 프레임에서 단 2~3분 만에 스캔할 수 있습니다. 또한 원하는 시장을 스캔할 수도 있으며, 예를 들어 약 100개의 주식을 약 10분 안에 스캔할 수 있습니다. 지표는 소진 레벨, 균형선, 편차, 통계
MT5 Indicator See What the Market Is Really Doing, See the 3 Market Phases Live in front of you (Contraction, Expansion, Trend Phases) and have Better Entries at the Early Stage in the Trend Phase. Stop guessing . Start reading the market like the institutions, Smart Money do. Apex Market Structure Pro Indicator for MT5 is a precision smart-money analysis tool that strips away the noise and shows you the true structure beneath every candle, liquidity, structure shifts, accumulat
OrderFlow Absorption – MT5용 전문 델타 & 흡수 신호 인디케이터 OrderFlow Absorption으로 진정한 오더플로우 분석의 힘을 경험하세요. MetaTrader 5를 위한 궁극의 델타 히스토그램 및 흡수 신호 인디케이터입니다. 가격 움직임의 이면에서 실제로 무슨 일이 일어나는지 알고 싶은 트레이더를 위해 설계된 이 도구는, 시장을 움직이는 숨겨진 매수/매도 압력과 흡수 이벤트를 드러냅니다. 주요 기능 델타 히스토그램 시각화:   매수와 매도 압력을 색상별 히스토그램으로 즉시 확인할 수 있습니다. 흡수 신호 감지:   고급 로직으로 강세 및 약세 흡수 이벤트를 식별하여 반전 신호를 미리 알려줍니다. 차트 마커:   흡수 신호가 차트에 직접 표시되어 시각적으로 쉽게 확인할 수 있습니다. 팝업 알림:   새로운 흡수 신호가 발생하면 실시간으로 알림을 받을 수 있습니다. 사용자 지정 임계값:   약한 신호는 필터링하고, 확률이 높은 기회에 집중할 수 있습니다.
KT Alpha Hunter Arrows MT5
KEENBASE SOFTWARE SOLUTIONS
대부분의 화살표 인디케이터는 신호만 보여주고, 나머지 판단은 모두 트레이더에게 맡깁니다. KT Alpha Hunter Arrows는 완성된 트레이딩 플랜을 제공합니다. 각 신호 화살표가 표시될 때마다 진입선, 손절선, 네 개의 익절 목표, 그리고 현재 심볼과 시간대가 지금 거래할 가치가 있는지 알려주는 실시간 엣지 판정이 함께 그려집니다. 포함된 Trade Manager EA는 사용자가 직접 진입한 뒤의 실행 관리를 맡아, 시장이 흔들리고 감정이 개입되기 쉬운 상황에서도 거래 원칙을 유지할 수 있도록 도와줍니다. 리페인트 없음. 종가 확정 후 신호만 표시. Forex, Gold, Indices 및 사용자가 거래하는 다양한 MT5 지원 상품에 맞게 설계되었습니다. 주요 기능 캔들이 마감된 후에만 표시되는 리페인트 없는 매수 및 매도 화살표. 각 신호마다 진입선, 구조적 손절선, 네 개의 익절 목표 표시. 현재 차트에서 매수와 매도 셋업을 별도로 평가하는 Edge Dashboard.
Spike detector Green V2
Odete Argelio Simbine
Spike DETECTOR Green V2 Spike Detection System - Version 2 Non-repainting indicator optimized for high-volatility markets such as Boom, Crash, and Volatility Indices. Detects strong momentum moves (spikes) with low latency. What Changed in V2: Algorithm 47% more accurate than the previous version Improved anti-false signal filtering system Faster detection (0.7 candles on average) Control panel with real-time metrics Key Features: Non-repainting signals with clear visual arrows Confidence-based
Beast Super Signal MT5
Florian Zuercher
2.71 (7)
수익성 있는 거래 기회를 쉽게 식별하는 데 도움이 되는 강력한 외환 거래 지표를 찾고 계십니까? Beast Super Signal보다 더 이상 보지 마십시오. 사용하기 쉬운 이 추세 기반 지표는 시장 상황을 지속적으로 모니터링하여 새로운 개발 추세를 찾거나 기존 추세에 뛰어들 수 있습니다. Beast Super Signal은 모든 내부 전략이 정렬되고 서로 100% 합류할 때 매수 또는 매도 신호를 제공하므로 추가 확인이 필요하지 않습니다. 신호 화살표 알림을 받으면 구매 또는 판매하기만 하면 됩니다. 구매 후 비공개 VIP 그룹에 추가되도록 저에게 메시지를 보내주세요! (전체 제품 구매만 해당). 최신 최적화된 세트 파일을 구입한 후 저에게 메시지를 보내주세요. MT4 버전은   여기에서 사용할 수 있습니다. 여기에서   Beast Super Signal EA를 받으세요. 최신 결과를 보려면 댓글 섹션을 확인하세요! Beast Super Signal은 1:1, 1:2
OmniSync Projection
Antonio-alin Teculescu
5 (1)
Chronos Fractal Engine is an innovative price projection indicator for MetaTrader 5, designed to transform your technical analysis by intelligently identifying and projecting historical price patterns. Built upon an advanced correlation algorithm and the fractal principles of the market, this powerful tool visualizes potential future price movements, giving you a unique edge in your trading decisions. What is Chronos Fractal Engine? At its core, the Chronos Fractal Engine employs a sophisticat
Ziva LSE System
Hassan Abdullah Hassan Al Balushi
ZIVA LSE System A Professional Liquidity & Structure Execution Framework Executive Overview ZIVA LSE System is a professionally engineered analytical framework designed to interpret market behavior through structural logic and liquidity dynamics. It is not positioned as a conventional indicator. Rather, it functions as a structured execution environment that organizes price action into a clear, disciplined decision-making model. The system is built to deliver consistency, clarity, and controlled
RelicusRoad Pro MT5
Relicus LLC
4.96 (24)
RelicusRoad Pro: 퀀트 시장 운영 체제 70% 할인 평생 이용권 (한정 시간) - 2,000명 이상의 트레이더와 함께하세요 왜 대부분의 트레이더는 "완벽한" 지표를 가지고도 실패할까요? 진공 상태에서 단일 개념 만으로 거래하기 때문입니다. 문맥 없는 신호는 도박입니다. 지속적인 승리를 위해서는 컨플루언스(중첩) 가 필요합니다. RelicusRoad Pro는 단순한 화살표 지표가 아닙니다. 완전한 퀀트 시장 생태계 입니다. 독점적인 변동성 모델링을 사용하여 가격이 이동하는 "공정 가치 로드"를 매핑하고, 단순 노이즈와 실제 구조적 돌파를 구분합니다. 추측은 그만두세요. 기관급 로드 로직으로 거래를 시작하세요. 핵심 엔진: "Road" 알고리즘 시스템의 중심에는 시장 상황에 실시간으로 적응하는 동적 변동성 채널인 Road Algo 가 있습니다. 세이프 라인(평형) 과 가격이 수학적으로 반전될 가능성이 높은 확장 레벨 을 투영합니다. Simple Road: 일반적인 시장을 위
TPA True Price Action indicator reveals the true price action of the market makers through 100% non-repainting signals strictly at the close of a candle! TPA shows entries and re-entries, every time the bulls are definitely stronger than the bears and vice versa. Not to confuse with red/green candles. The shift of power gets confirmed at the earliest stage and is ONE exit strategy of several. There are available now two free parts of the TPA User Guide for our customers. The first "The Basics"
Manipolatio regis
Simone Degl Innocenti
Manipulatio Regis — Scanner di Simmetria Istituzionale Manipulatio Regis rileva le manipolazioni dei Market Maker leggendo i Trading Ranges e i progetti obiettivi simmetrici da Price Action istituzionale. Non prevede il Future: legge una manipolazione già avvenuta e progetti in cui Il prezzo tende a tornare a ribilanciarsi. Come funziona: • Evento significativo (SI): rileva un impulso anomalo ad alta efficienza (rapporto ATR). • Gamba e Candela #1: isola la gamba di ritracciamento controdirezion
CGE Trading Suite
Carl Gustav Johan Ekstrom
5 (2)
Institutional-Grade Analytics for MT5 The full analytical edge of a professional trading desk, built into your MT5 chart. CGE Trading Suite is an indicator system of 17 integrated modules covering market structure, timing, momentum, and capital flow — combined into a single chart-based workspace. Why CGE Trading Suite? The suite empowers traders with structure, confidence, and consistent performance across all markets and time frames. Hover over any signal or tool on the chart to instantly see
SmartScalping
Temirlan Kdyrkhan
SmartScalping is a powerful trading companion designed to generate high-probability entry signals with dynamic TP/SL/DP levels based on volatility. Built-in performance tracking shows win/loss stats, PP1/PP2 hits, and success rates — all updated live. Key Features: Buy/Sell signals with adaptive volatility bands Real-time TP/SL/DP levels based on ATR Built-in MA Filter with optional ATR/StdDev volatility Performance stats panel (Success, Profit/Loss, PP1/PP2) Alerts via popup, sound, push, or e
ScalpPoint
Temirlan Kdyrkhan
ScalpPoint is a powerful trading companion designed to generate high-probability entry signals with dynamic TP/SL/DP levels based on volatility. Built-in performance tracking shows win/loss stats, PP1/PP2 hits, and success rates — all updated live. Key Features: Buy/Sell signals with adaptive volatility bands Real-time TP/SL/DP levels based on ATR Built-in MA Filter with optional ATR/StdDev volatility Performance stats panel (Success, Profit/Loss, PP1/PP2) Alerts via popup, sound, push, or emai
TrendProMaster
Temirlan Kdyrkhan
MasterTrend Indicator for MT5 A powerful trend-following and signal-evaluation tool MasterTrend   is a custom MT5 indicator that combines Moving Averages and ATR-based risk/reward logic to generate clear buy/sell signals. It visualizes dynamic SL/TP levels, evaluates past trade outcomes, and displays win/loss statistics in a clean on-chart panel. Key features include: Buy/Sell signals based on MA crossovers ATR-based SL/TP1/TP2/TP3 levels with visual lines and labels Signal outcome tracking wit
Berma Bands
Muhammad Elbermawi
5 (10)
Berma Bands(BBs) 지표는 시장 동향을 파악하고 이를 활용하려는 트레이더에게 귀중한 도구입니다. 가격과 BBs 간의 관계를 분석함으로써 트레이더는 시장이 추세 단계인지 범위 단계인지를 분별할 수 있습니다. 자세한 내용을 알아보려면 [ Berma Home Blog ]를 방문하세요. 버마 밴드는 세 개의 뚜렷한 선으로 구성되어 있습니다. 어퍼 버마 밴드, 미들 버마 밴드, 로어 버마 밴드입니다. 이 선들은 가격 주위에 그려져 전체 추세에 대한 가격 움직임을 시각적으로 표현합니다. 이 밴드들 사이의 거리는 변동성과 잠재적인 추세 반전에 대한 통찰력을 제공할 수 있습니다. 버마 밴드 라인이 각각에서 분리될 때, 그것은 종종 시장이 횡보 또는 범위 이동 기간에 접어들고 있음을 시사합니다. 이는 명확한 방향 편향이 없음을 나타냅니다. 트레이더는 이러한 기간 동안 추세를 파악하기 어려울 수 있으며 더 명확한 추세가 나타날 때까지 기다릴 수 있습니다. 버마 밴드 라인이 단일 라인으로
Smart Bubble Dominance Pro
Dioney De Jesus Batista Alves
실시간 기관 수급 흐름과 시장 공격성을 분석하는 최강의 도구, Smart Bubble Dominance Pro 를 소개합니다. 정밀한 타점을 원하는 트레이더를 위해 개발된 이 지표는 복잡한 거래량 데이터를 명확한 시각적 신호로 변환하여 '스마트 머니(Smart Money)'가 어디에 포진해 있는지 즉각적으로 식별해 줍니다. BTCUSD 전용 최적화 이 지표는 **BTCUSD(비트코인)**의 변동성과 특유의 움직임에 맞춰 정밀하게 튜닝되었습니다. 시장의 노이즈를 제거하고 실제 의미 있는 움직임만을 포착하여, 여러분이 항상 추세의 유리한 방향에 설 수 있도록 돕습니다. 도미넌스 비주얼 맵 (델타 컬러) 직관적인 컬러 코딩 시스템을 통해 단 몇 초 만에 시장 심리를 읽을 수 있습니다: 시안색 버블 (강력 매수): 매수세의 공격적인 지배를 나타냅니다. 가격이 강한 확신과 함께 상승하고 있다는 신호입니다. 마젠타색 버블 (강력 매도): 압도적인 매도 압력을 나타냅니다. 시장이 기관
제작자의 제품 더 보기
$10,000가 17개월 만에 $321,989가 되었습니다. 하나의 계좌, 다섯 개의 상품, 745건의 거래, 리얼 틱. 이 숫자는 여러분의 전략 테스터에서 체크박스 하나로 재현됩니다 — 구매 전에 직접 검증하세요. 절차는 이 설명 안에 있습니다. 저는 1999년부터 트레이딩을 해왔습니다. 사반세기 동안 시도한 모든 것 중 살아남은 모델은 단 하나, 조정이 끝난 뒤 추세에 진입하는 것입니다. 가격이 어디서 반전할지 추측하지 않습니다 — 짧은 스톱과 큰 잠재력으로 움직임의 연속에 올라탑니다. 심볼당 하나의 포지션, 모든 거래에 스톱로스, 그리드 없음, 마틴게일 없음, 물타기 없음. 스톱은 브로커 서버에 보관됩니다. VPS가 꺼져도 보호는 계속 작동합니다. 금, 은, 엔, 비트코인, DAX — 하나의 차트에서 한 상품만 또는 다섯 개 모두를 거래하세요. 10카피가 판매될 때마다 가격이 오릅니다 — 오늘의 가격이 앞으로의 모든 가격 중 가장 낮습니다. 트레이더가 이 로봇을 선택하는 이유
Market Pulse AI
Yury Orlov
5 (10)
Market Pulse AI ist ein vollautomatischer Expert Advisor für AUDCAD, NZDCHF, EURCHF, NZDCAD, CADCHF und AUDCHF mit verifiziertem Ergebnis und integriertem Einlagenschutz. 120 Stunden pro Woche hat er sekündlich den Finger am Puls des Marktes und nutzt jede Gelegenheit zur Gewinnerzielung mit den bewährten Methoden institutioneller Trader. Handeln Sie ein Paar oder alle gleichzeitig — Details weiter unten. Überwachung des Echtgeldkontos hier Profit: 155% | DD: 4.79% | Win rate: ~75% | Trades pro
HTTP ea
Yury Orlov
4.27 (11)
How To Trade Pro는 금(XAUUSD) 전용 추세추종 EA입니다. 리얼 틱 기반 3년 검증 에서 리스크 1%당 +76%, 최대 낙폭 6.6% 라는 결과를 냈습니다 — 게다가 이것을 결제하기 전에 전략 테스터에서 5분 만에 직접 확인할 수 있습니다 . 포지션은 항상 하나, 모든 주문에 진입 첫 순간부터 하드 스톱로스 가 들어갑니다. 그리드 없음, 마틴게일 없음, 물타기 없음. 리스크는 설정 하나뿐: 1%, 2%, 3% (3년 기준 각각 +76%, +224%, +482%, 낙폭은 비례해서 증가). 가격은 10카피 판매마다 오릅니다 — 오늘 가격이 이 EA의 역대 최저가입니다. 렌탈도 가능합니다. 구매 후에는 제작자 본인의 지원 , 가이드, 비공개 그룹을 제공합니다. 이것이 당신이 사는 마지막 EA 가 되기를 바랍니다. 이 페이지는 이미 찾는 데 지친 분들을 위한 것입니다 이런 페이지를 수십 개는 보셨을 겁니다. «월 +300%», 화살처럼 치솟는 곡선 — 그리고 한 분기 뒤에
Entry Points Pro
Yury Orlov
4.59 (174)
다시 색을 칠하지 않고 거래에 진입할 수 있는 정확한 신호를 제공하는 MT4용 지표입니다. 외환, 암호화폐, 금속, 주식, 지수 등 모든 금융 자산에 적용할 수 있습니다. 매우 정확한 추정값을 제공하고 매수와 매도의 가장 좋은 시점을 알려줍니다. 하나의 시그널로 수익을 내는 지표의 예와 함께 비디오 (6:22)시청하십시오! 대부분의 거래자는 Entry Points Pro 지표의 도움으로 첫 거래 주 동안 트레이딩 결과를 개선합니다. 저희의   Telegram Group 을 구독하세요! Entry Points Pro 지표의 좋은점. 재도색이 없는 진입 신호 신호가 나타나고 확인되면(시그널 캔들이 완성된 경우) 신호는 더 이상 사라지지 않습니다. 여타 보조지표의 경우 신호를 표시한 다음 제거되기 때문에 큰 재정적 손실로 이어집니다. 오류 없는 거래 게시 알고리즘을 통해 트레이드(진입 또는 청산)를 할 이상적인 순간을 찾을 수 있으며, 이를 통해 이를 사용하는 모든 거래자의 성공률이
필터:
Ravinder Kumar
62
Ravinder Kumar 2026.07.19 14:42 
 

⭐⭐⭐⭐⭐ (5/5) I've been using Entry Points Pro for a while now, and it's a solid tool for identifying potential trade entries. The signals are clean and easy to understand, making it useful for both beginners and experienced traders. It doesn't guarantee winning trades—which no indicator can—but when combined with proper price action, risk management, and market structure, it performs well.

Yury Orlov
21903
개발자의 답변 Yury Orlov 2026.07.19 15:03
⭐⭐⭐⭐⭐ (5/5) for you, my friend. Thank you! 😍
Sergey84
24
Sergey84 2026.07.16 09:06 
 

Отличный индикатор, если подходить с умом и не лезть во все сделки подряд.

Yury Orlov
21903
개발자의 답변 Yury Orlov 2026.07.16 18:39
Сергей, благодарю за отзыв! Рад быть полезным.
Longus1887
211
Longus1887 2026.07.16 05:48 
 

A must have indicator for manual trading. Very straightforward. Invest paid ou after one trading day!!

Yury Orlov
21903
개발자의 답변 Yury Orlov 2026.07.16 18:42
Thank you for review! 😍
Aaron Paul
56
Aaron Paul 2026.07.10 15:49 
 

This indicator is exactly what my trading experience has been missing and the developer support is brilliant. Thanks Yuri.

Yury Orlov
21903
개발자의 답변 Yury Orlov 2026.07.10 16:55
Thank you, mate! 😍 Your feedback makes me happy! 🥰🙏
Whoopty_FX
364
Whoopty_FX 2026.07.09 19:35 
 

Yuri is a thoughtful and detailed developer, and this indicator is nothing short of amazing. I'm very impressed with the usability and flexibility this indicator offers manual traders.

Yury Orlov
21903
개발자의 답변 Yury Orlov 2026.07.13 19:16
Thank you! 😍
fslum
38
fslum 2026.07.09 10:02 
 

Excellent indicator. I also like the support. But in future updates, I would like to see the following: 1. A clear exit signal. Currently, the indicator draws an "x," but only when the price moves further. 2. A clear average stop-loss/take-profit ratio. It would be great if the statistics panel displayed the average stop-loss/take-profit ratio.

Yury Orlov
21903
개발자의 답변 Yury Orlov 2026.07.09 10:20
😍💖 Thank you! You are awesome!
Binandgen
135
Binandgen 2026.05.24 11:17 
 

Здравствуйте! Купил индикатор уже очень давно) потерял инструкцию, не могли бы Вы направить мне её повторно, спасибо!

Yury Orlov
21903
개발자의 답변 Yury Orlov 2026.05.24 12:14
Здравствуйте! Проверьте личные сообщения.
JordiSoler23
29
JordiSoler23 2026.05.21 16:31 
 

"Hola Yury, he comprado el indicador. ¿Podrías enviarme el manual por favor? Muchas gracias."

Yury Orlov
21903
개발자의 답변 Yury Orlov 2026.05.21 18:04
Hi. check PM.
kirovsk
36
kirovsk 2026.01.28 20:52 
 

사용자가 평가에 대한 코멘트를 남기지 않았습니다

Yury Orlov
21903
개발자의 답변 Yury Orlov 2026.01.28 23:45
Благодарю за покупку и отзыв! 💖Проверьте личные сообщения 🙏
Andrey
132
Andrey 2026.01.13 15:38 
 

I recommend this indicator to everyone. I've been using it since 2022. It's the best one I've used in a while.

Yury Orlov
21903
개발자의 답변 Yury Orlov 2026.01.13 17:17
😍💖 Thank you! You are the best!
zain xpro
131
zain xpro 2026.01.04 02:38 
 

I bought the product. Please send manual to zipco929@gmail.com

Yury Orlov
21903
개발자의 답변 Yury Orlov 2026.01.04 11:15
Done!
dafi7
428
dafi7 2025.11.26 06:53 
 

I bought this indicator a long time ago. It's excellent. The signals are clear, easy to understand, and extremely effective when followed. Thank you for this incredible indicator!

Yury Orlov
21903
개발자의 답변 Yury Orlov 2025.11.26 07:02
Thank you for your incredible review! 😍
Thueringer8
19
Thueringer8 2025.11.02 15:14 
 

Very good indicator, clear and reliable signals. The guide is helpful, and Yury gives great support. Thank you!

Yury Orlov
21903
개발자의 답변 Yury Orlov 2025.11.26 07:05
I'm glad to read it 💖 Thank you 😊
Rodger Zhao
247
Rodger Zhao 2025.09.28 02:01 
 

사용자가 평가에 대한 코멘트를 남기지 않았습니다

Yury Orlov
21903
개발자의 답변 Yury Orlov 2025.09.28 08:01
Thank you very much for your review! 🙏
Muhammad Muhaizam Musa
88
Muhammad Muhaizam Musa 2025.08.28 10:28 
 

I am very happy using this indicator, having good support from seller and trading with confidence now. Follow the guide and making money. Hope everyone will look into this indicator and consider using it by understanding the guide by Yury. Happy trading everyone.

Yury Orlov
21903
개발자의 답변 Yury Orlov 2025.08.28 10:30
Thank you, Muhammad! 💖 I'm so happy to read your review! 🤩
Please let me know if you need something else.
鳥親父
47
鳥親父 2025.07.29 11:40 
 

I have been using the indicator for about 1 weeks. The best that can be and the price is very pleasant. I am very glad that I found it and it is definitely my favorite. Definitely the highest score.

Max_Peres
718
Max_Peres 2025.07.22 07:28 
 

I tried it, it's not good at all. Constant repainting and quality of those signals that didn't repaint are low - many false entries. Not reliable at all, just fluffy words in manual and in description.

Yury Orlov
21903
개발자의 답변 Yury Orlov 2026.07.13 19:15
Fair concern — and it is exactly why v10 was rebuilt. Confirmed arrows appear only on candle close and never move: verified by an automated invariant test — 2.4 million checks on EURUSD, XAUUSD and BTCUSD, zero repaints, and the method is reproducible in your own tester. Message me and I will send you the test recipe so you can verify it yourself. Cheers!
liyiii
211
liyiii 2025.07.21 07:27 
 

good indicator,recommanded to use it.

Yury Orlov
21903
개발자의 답변 Yury Orlov 2026.07.13 19:16
😍💖
Hwanghansu
652
Hwanghansu 2025.06.23 04:07 
 

I purchased your product and installed it on my MT5 platform. The problem is that it is not setting up additional accounts. Can I not use it on other futures accounts besides the one I use? Does it only work on one account?

Yury Orlov
21903
개발자의 답변 Yury Orlov 2026.07.13 19:18
Yes, of course you can. Let me know if I can help you with it 😍
@yuryo or PM me here.
Darek Pietraszewski
199
Darek Pietraszewski 2025.02.12 13:43 
 

Hi just bought your indicator. Can you send manuals please. Thank you!

Yury Orlov
21903
개발자의 답변 Yury Orlov 2026.07.13 19:16
Hi, done! Thank you! 😍💖
리뷰 답변