True Trading Cost Planner

True Trading Cost Planner for MetaTrader 5

Plan your trades with a clearer understanding of risk, reward, and actual trading costs.

True Trading Cost Planner is an interactive trade-planning indicator for MetaTrader 5. It helps traders calculate position size, estimate trading expenses, evaluate net risk-to-reward ratios, and visualize entry, stop-loss, and take-profit levels directly on the chart.

Unlike a basic risk/reward calculator, this indicator considers user-defined commissions, slippage assumptions, additional fees, and optional overnight swap estimates to provide a more realistic view of potential trade outcomes.

Key Features

  • Interactive Trade Planning: Choose BUY or SELL and adjust entry, stop-loss, and take-profit levels directly on the chart.
  • Risk-Based Position Sizing: Calculate lot sizes using a percentage of account equity or a fixed trading volume.
  • Net Risk-to-Reward Calculation: Compare gross risk/reward with estimated net results after modeled trading costs.
  • Commission and Fee Modeling: Include round-trip commissions, additional fees, and estimated slippage.
  • Break-Even Price: Estimate the price required to offset modeled trading costs.
  • Live Spread Display: Monitor the latest available bid/ask spread with warnings when market quotes may be stale.
  • Overnight Swap Estimation: Optionally estimate rollover costs using available broker specifications or manually entered values.
  • Spread Insights: View spread observations collected while the indicator is running, grouped by broker server hour.
  • Risk and Cost Warnings: Receive visual warnings for invalid trade levels, missing broker data, high costs, or insufficient position size.
  • Interactive Dashboard: Review important calculations in one organized chart panel.

How to Use

  1. Install the indicator and attach it to a MetaTrader 5 chart.
  2. Choose your preferred position-sizing method in the indicator settings.
  3. Enter your broker's commission and any additional trading fees.
  4. Select BUY or SELL on the dashboard.
  5. Drag the entry, stop-loss, and take-profit lines to your preferred price levels.
  6. Review the calculated position size, gross and net risk/reward, and estimated break-even price.
  7. Adjust your trade plan until the estimated risk and costs match your trading requirements.
  8. Click RESET whenever you want to initialize a new plan.

Understanding the Dashboard

Entry: The planned entry price for a BUY or SELL position.

Stop Loss: The planned exit level if the trade moves against the position.

Take Profit: The planned target price if the trade moves favorably.

Position Size: Estimated trade volume based on the selected sizing method and available symbol specifications.

Gross Risk and Reward: Potential loss and profit before additional modeled trading costs.

Net Risk and Reward: Estimated potential loss and profit after applicable modeled costs.

Net R:R: The ratio of estimated net reward to estimated net risk.

Break-Even: The estimated price needed to offset modeled expenses.

Indicator Settings

Position Sizing

  • InpSizing: Select percentage-based risk sizing or fixed-lot sizing.
  • InpRiskPercent: Percentage of account equity allocated to the planned risk.
  • InpFixedLots: Fixed position volume when fixed-lot mode is selected.

Trading Costs

  • InpCommissionRoundTurnPerLot: Round-trip commission per lot in account currency.
  • InpCommissionVerified: Confirm that the commission assumption has been checked.
  • InpExtraFeesRoundTurnPerLot: Additional known round-trip fees per lot.
  • InpSlippageRoundTurnPoints: Assumed total round-trip slippage in points.
  • InpWarnCostTargetPercent: Warning threshold when modeled costs become high relative to the gross target.

Initial Trade Levels

  • InpInitialStopATRMultiplier: ATR multiplier used to initialize the stop distance.
  • InpInitialTargetRR: Initial target distance relative to the stop distance.
  • InpFallbackStopPoints: Alternative stop distance if ATR data is unavailable.

Swap and Rollover

  • InpSwapSource: Disable swap, use available broker data, or enter a manual estimate.
  • InpRolloverDays: Number of future server-calendar days used for the swap projection.
  • InpManualSwapPerLotNight: Manual swap estimate per lot and standard night.
  • InpTripleSwapWeekday: Weekday used for triple-swap assumptions.
  • InpSwapStartWeekdayOverride: Optional weekday override for manual simulation.
  • InpSwapCalendarVerified: Confirm that rollover assumptions have been checked.
  • InpIncludeSwapInNetRR: Include verified swap estimates in net calculations.

Manual Symbol Specifications

  • InpUseManualSymbolSpecs: Enable manual symbol-specification simulation.
  • InpManualTickSizePrice: Manually specified price increment per tick.
  • InpManualTickValueProfit: Tick value used for profitable price movement.
  • InpManualTickValueLoss: Tick value used for adverse price movement.
  • InpManualMinLot: Simulated minimum trading volume.
  • InpManualMaxLot: Simulated maximum trading volume.
  • InpManualLotStep: Simulated trading volume increment.
  • InpManualAccountCurrency: Currency label used when broker currency information is unavailable.

Display and Monitoring

  • InpPanelX and InpPanelY: Dashboard position on the chart.
  • InpShowBreakEvenLine: Show or hide the estimated break-even line.
  • InpUpdateSeconds: Dashboard refresh interval.
  • InpCollectSpreadStats: Enable spread observations collected during the current session.
  • InpShowInsightsPanel: Show or hide the additional swap and spread information panel.

Important Calculation Notes

The indicator uses available broker symbol specifications and tick values when calculating monetary risk and reward. Actual results can vary according to account currency, contract specifications, liquidity, execution conditions, and trading fees.

The displayed spread is informational and is not charged twice when bid/ask execution prices are already reflected in the plan.

Swap projections are estimates. Swap is included in the net calculation only when the required verification and inclusion settings are enabled.

Manual symbol specifications are intended for simulation and checking calculations, not as a substitute for verified live broker data.

Important Information

True Trading Cost Planner is designed for trade planning, risk assessment, and educational analysis.

It does not execute trades, manage open positions, generate trading signals, or predict market direction.

All figures are estimates. Actual trading results may differ due to changing spreads, execution prices, commissions, swaps, and slippage. Traders should verify the relevant broker specifications before making trading decisions.

Support

For questions, feature suggestions, or bug reports, please use the MQL5 product Comments section or contact the developer through MQL5 messages.

Plan your risk. Understand your costs. Evaluate your net reward.

Recommended products
Weis Waves RSJ
JETINVEST
4.64 (11)
Weis Waves RSJ adds up the volume of each price wave and plots it as a histogram of cumulative volume for the alternating up and down waves. This lets you compare the effort (volume) of each wave with its result (price progress) and see when a move is supported by volume or is losing strength. How to read it Each bar of the histogram is the total volume traded during one price wave. When a trend is healthy, the waves in the direction of the trend usually show more volume than the corrections. Wh
FREE
Structure & Volatility-Based Precision Execution Signal Indicator B2U Market State System  Part of the B2U Market State System B2U EX is a professional indicator designed to analyze market structure, trend state, and volatility in an integrated and objective way. 시장 구조 , 추세 상태 , 모멘텀을 입체적으로 분석하기 위한 전문 인디케이터 시스템입니다 . 이 인디케이터는 무작위 신호 생성이 아닌 ,  시장 구조 · 변동성 · 추세 방향이 동시에 정렬된 구간에서만  실행 신호를 제공합니다. 추세상태 분석을 위한 B2U Ultimate HARSI 또는 모멘텀 상태 판단을 위한 B2U Ultimate Percent R Edition 과 함께 사용하면 시장 구조와 상태를 보다 입체적
FREE
B2U Market State System Part of the B2U Market State System A professional indicator suite designed to analyze market structure, trend state, and momentum. B2U Market State System 의 구성 요소입니다. 시장 구조, 추세 상태, 모멘텀을 입체적으로 분석하기 위한 전문 인디케이터 시스템입니다. Highlights structurally validated reaction zones after FVG inversion. The New Generation of Inversion Fair Value Gaps B2U IFVG BOX & Zone visually analyzes market reaction zones formed after Fair Value Gap (FVG) inversion. 차세대 Inversion Fair Value Gaps FVG 반
FREE
No Wick On Close
Flavio Javier Jarabeck
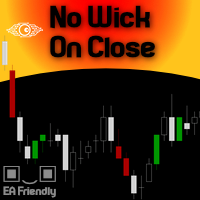
We at Minions Labs love to study, challenge and discover new facts about Price Behavior in current markets. We would NOT call it Price Action because today this is a word totally overused and means, thanks to the False Prophets out there, absolutely NOTHING. The study hypothesis we propose is this: Some Assets, in certain Timeframes, present a behavior of Price continuity when the candlesticks close without a Wick on them... So the purpose of this indicator is to "color" those candlesticks who
FREE
Reversal Oscillator — Advanced Momentum Shift Detector Reversal Oscillator is a free indicator designed to highlight price zones that are statistically outside their normal movement patterns, helping traders anticipate potential turning points before they occur. Unlike traditional oscillators that react mainly to overbought/oversold conditions, this indicator applies third derivative analysis (the "acceleration of the acceleration" of price) calculated using two independent methods within a n
FREE
VWAP + Volume Profile Combined Indicator FREE Launch Offer OVERVIEW Professional combination of VWAP (Volume Weighted Average Price)  and Volume Profile in a single MT5 indicator. This powerful tool  combines two of the most respected institutional trading tools  into one seamless display. KEY FEATURES 1. VWAP with 6 calculation modes 2. Volume Profile with Value Area analysis 3. Point of Control identification 4. Standard deviation bands 5. Dynamic color changing 6. Separate buy/sell vol
FREE
This indicator automatically detects harmonic price patterns on your chart, both bullish and bearish, and shows them as soon as they form, including potential patterns that are still developing. For every pattern it draws the Potential Reversal Zone (PRZ), and for completed patterns it also draws two take-profit and two stop-loss levels. Supported Patterns: Gartley, Bat, Butterfly, Crab, Deep Crab, Shark and Cypher. Each pattern can be switched on or off individually. Key Features: Completed
FREE
1. Overview — TrendFusion Pro TrendFusion Pro is a free, open-source MetaTrader 5 indicator that generates buy and sell signals only when all seven independent filters simultaneously agree. By requiring SuperTrend direction change, Triple EMA alignment, EMA proximity, RSI momentum direction, MACD divergence, wick ratio, and over-extension filters to pass at once, it delivers high-precision confluence signals with minimal false positives — suitable for both trend-following and scalping strategie
FREE
Stochastic RSI-RVI Fusion Dashboard (MTF) Unlock the full "Matrix" view of the market. The   Stochastic RSI-RVI Fusion Dashboard   is the advanced companion to the   Stochastic RSI-RVI Fusion   oscillator. While the standard indicator analyzes the current chart, this Dashboard monitors the entire spectrum of timeframes simultaneously—from the 1-minute scalping noise to the monthly macro trends. Trading with a single timeframe often leads to "tunnel vision." You might buy on the H1 timeframe beca
FREE
Pause Manager Indicator
David Enrique Barrera Moncayo
5 (1)
Pause Manager Indicator (for EA Pause Manager) What It Is: This is a lightweight chart indicator that works together with the EA Pause Manager utility. It displays the current status of your EAs and sends that information to the EA Pause Manager so it can pause/resume them correctly.  Required for proper functioning of EA Pause Manager . Features: Shows real-time status (ACTIVE / PAUSED) of the EA on the chart Displays EA ID (EA1–EA4), customizable via settings Minimal resource usage No input s
FREE
Season Timed Range Breakout (STRB) STRB marks the price range of a time window you choose, such as the New York open, and tracks how price breaks out of it. It draws the range, targets and stop levels for every session. It also records how past breakouts played out, so you can judge a setup on your own chart’s history instead of guessing. How it works You set a range window (for example 09:30–09:45 New York time) and a trading session (for example 09:30–16:00). STRB boxes the high and low of the
FREE
Peak Trough Analysis is the great tool to detect peaks and troughs in your chart. Peak Trough Analysis tool can use three different peaks and troughs detection algorithm. The three algorithm include the orignal Fractals Indicator by Bill Williams, the Modified Fractals indicator and ZigZag indicator. You can use this peak and trough analysis tool to detect the price pattern made up from Equilibrium Fractal-Wave process. For further usage, there are good guide line on how to use this peak trough
FREE
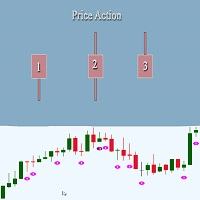
This indicator looks for 3 rather strong patterns: Spinning Top pattern Hammer or Hanging Man Inverted Hammer or Shooting Star These patterns may indicate a trend continuation or its reversal, depending on the location of the patterns. Input parameters Distance - distance between the signal and the formed signal Note: the higher the timeframe, the greater the value should be used in Distance to display the signal correctly Indicator Features Suitable for any currency pair Operating timeframe:
FREE
Simple Weis Wave
Jean Jacques Huve Ribeiro
3.67 (3)
One of the best tools for analyzing volume, Weis Wave was idelized by David Weis, to facilitate the reading of directional flow. For the VSA method disciples it is an evolution of the practices created by Richard Wycoff, facilitating a predictive reading of the market, always seeking an accumulation and distribution of the negotiated contracts. Cumulative wave volume  Range of wave ( removed) Average Wave volume Ref "Tim Ord lectures" ( removed)
FREE
AMD Pro Sessions is a trading session analysis indicator designed to identify and analyze market behavior across the Asian, London, and New York trading sessions. The indicator visualizes session ranges, tracks key session highs and lows, and evaluates price relationships between sessions. Main Features 1. Trading Session Visualization Asian session range. London session range. New York session range. Separate visual boxes for each session. Session highs and lows. Inside Day conditions. Outside
FREE
======================================================== XAUUSD ELLIOTT WAVE + REAL YIELD (MTF LEVELS/TARGETS) - MQL5/MT5 MARKET DESCRIPTION (formatting: **bold** = Bold button; lines with • = bullet list; UPPERCASE = heading) ======================================================== OVERVIEW ------------------------------------------------------- **XAUUSD Elliott Wave + Real Yield** maps Elliott structure with ZigZag pivots and motive/corrective checks, then filters signals with a **real-yield
FREE
White Weis Volume Ticks
Ricardo Almeida Branco
5 (4)
White Weis Volume This indicator shows the sum of the volume in each wave, bulish or bearish, as idealized by David Weis , but it brings an important addition , which is the marking of the bar with the highest volume of the wave (White Bar)! In coding the indicator, it was sought to optimize the code to require minimal processing during use and not to overload mt5. The indicator can be used for pre-trading analysis and study, where the trader analyzes possible points of support and resistance
PriceAlert
Ryoma Iwayama
Here's how to use the BTC_PriceAlert.mq5 indicator in MetaTrader 5: What it does It's a custom indicator (not an EA) for BTCJPY that draws horizontal alert lines on your chart and fires a notification when price touches your specified upper or lower target. It checks the high/low of each bar (wick touches count, not just closes). Install the indicator Copy BTC_PriceAlert.mq5 into your MT5 data folder under MQL5/Indicators (File > Open Data Folder in MetaEditor or MT5). Compile it in MetaEditor
FREE
Weis Waves is a technical indicator developed by David Weis, inspired by Richard Wyckoff’s principles. Unlike traditional volume, which is shown bar by bar, Weis Waves accumulates volume into bullish or bearish “waves,” restarting the count whenever price changes direction. This method allows traders to clearly see the true strength of market moves , as each wave reflects the intensity of the volume behind a sequence of candles. Key features: Groups volume into buying and selling waves. Highl
FREE
VFI Quantum
Nikita Berdnikov
5 (1)
Introducing VFI (Volume Flow Indicator) – a trading indicator that analyzes the relationship between volume and price movement to identify key trading opportunities. The indicator displays the strength and direction of volume flow, providing clear signals about potential entry and exit points. Signals are formed based on zero line crossovers, crossovers between the VFI line and its exponential moving average (EMA), and when the indicator exits overbought and oversold zones. Attention! This stra
FREE
FREE — ZigZag swing pivots plus a moving-average trend filter, drawn together. It shows the pivot levels and trend context that a pivot-breakout system trades on. Tuned for gold (XAUUSD). 100% free, no limitations. If it earns a place on your charts, a short review is the one thing that helps us most — it takes 30 seconds and it is what lets other traders find this tool. Platform: MetaTrader 5 (this page). A pivot break only means something in the direction of the larger trend. This indicator
FREE
SMC with BB
Haradhan Sharma
================================================================================ SHORT TAGLINE ================================================================================ Institutional Smart Money Concepts: Real-time Market Structure (BOS/CHoCH), Order Blocks, Flipped Breaker Blocks, Fair Value Gaps (FVG), Premium/Discount Zones, and Live Volume Spike HUD. ================================================================================ FULL MQL5 MARKET PRODUCT DESCRIPTION ================
FREE
Swing BOS Structure is a market structure indicator for MetaTrader 5. The indicator automatically detects: • Swing High (SH) • Swing Low (SL) • Break of Structure (BOS) • Change of Character (CHoCH) Swings are confirmed only after a defined number of candles, ensuring no repainting. BOS signals indicate trend continuation. CHoCH signals indicate a potential change in market structure and may appear less frequently depending on market conditions and timeframe. The indicator is lightweight, fa
FREE
Volume Doji
Ricardo Almeida Branco
Hey guys. This indicator will show you, in the volume histogram, if the candle was a Doji, a bullish candle, or a bearish candle. The construction of this indicator was requested by a trader who uses other indicators from my catalog, and I decided to release it free to help traders who think that the indicator can contribute to their operations. The parameters are: Volume Type: Real Volume or Tick Volume. Color if the candle is bearish: select the color. Color if the candle is high: select
FREE
MBL Daily Candle Digital Timer
Botsalo Martin Letlhoagoje
MBL Daily Candle Digital Timer MBL Daily Candle Digital Timer is a clean and precise countdown tool designed to help traders monitor candle time and daily price movement directly on the chart. It provides a real-time candle countdown, timeframe label, and daily percentage change in a clear digital-style display. Key Features • Live Candle Countdown Displays the remaining time for the current candle with flexible format options: HH:MM:SS MM:SS Total Seconds • 3-Level Color System The timer
FREE
LT Weis Waves
Thiago Duarte
5 (11)
The Weis Wave first takes the market volume and then organizes it with the price into Wave charts. It is the only software that will present the true picture of the market before you. If anyone of you, has watched an intraday price movement then you must know that it unfolds in a series of selling as well as buying waves-a procedures tearing down and building up. Wave analysis is an integral part of the trading method. The indicator helps to deal with today’s volatile market. Moreover, it works
FREE
Why Most RSI Divergence Indicators Are Either Delayed or Repainting   If you have tested enough divergence indicators, you ’ ve probably seen one of these two problems:   Either the divergence appears very late, or the divergence suddenly disappears.   This is not because an indicator is “ poorly coded ” . It comes from a fundamental trade-off in how divergence itself is calculated.   If you want divergence signals to appear immediately, you usually have to accept repainting. If you want absolu
FREE
PROMETHEUS TECHNICAN VERSION Free | By THE SONS A gift from The Sons — no strings, no trial, no expiry. Every trader deserves access to professional-grade market intelligence. That belief is why Prometheus Technical Version exists, and why it costs nothing. Consider it our handshake to the trading community. What You're Getting This is not a simplified tool dressed up as a gift. Prometheus Technican Version is a fully built, institutional-quality technical analysis indicator running a dual-model
FREE
AI Range Compression Scanner
Fadi Hassan Khaled Ghanem
AI Range Compression Scanner automatically finds periods of tightening volatility - price squeezes - and highlights them as a shaded zone on the chart, then marks the breakout the moment price escapes the squeeze. Volatility contraction almost always precedes an expansion move, and this indicator lets you see it building in real time. The indicator continuously compares a short-term price range against a longer-term baseline range. When the short-term range compresses below your chosen percentag
FREE
Apex Point
Marco Engstermann
Apex Point is a trend-following indicator for MetaTrader 5, transforming complex market data into signals for traders. It displays blue dots for uptrends, red dots for downtrends, and yellow crosses at potential reversals, helping users identify momentum shifts quickly. Key features include a confirmation system requiring multiple bars (default: 3) to validate changes, reducing false signals; dynamic ATR-based offsets for adaptive trailing, with instant ratcheting in the trend direction and smo
FREE
Buyers of this product also purchase
Trend Sniper X
Sarvarbek Abduvoxobov
4.87 (46)
Trend Sniper X is a multi-timeframe trend-following indicator for MetaTrader 5 that helps traders identify trend direction and potential reversal points with clarity and precision. for MT4: https://www.mql5.com/en/market/product/193245 Price Information: The current price is promotional and is subject to change as upcoming updates and new features are released. Bonus Offer: To get the FREE Auto-Trade Assistant EA for this indicator, please message the author after purchasing. Code2Profit Channe
Smart Trend Trading System — MetaTrader 5 Message me on MQL5 after purchase to receive Smart Universal Expert Advisor for FREE, plus the online course, PDF manual, and private group access. STTS brings trend direction, entry and exit signals, reversal zones, and important price levels together on your chart. Follow the system manually, or connect a separate compatible EA for automated execution using your chosen settings. ONE SYSTEM. FOUR TRADING APPROACHES. STTS organizes its trading approaches
A new King in town - Indicator + Order management indications(tp1+tp2+tp3) + Optional Telegram Signal sender   INCLUDED (FREE) + Bonus EA Robot ( FULL TRADING  and SIGNAL SYSTEM ) Our best EA for Gold: Gold Slayer TRY > Reversion Queen  Expert advisor >JOIN Community Channel < NEW Free Automation EA link < click here ( disclaimer: this is new and still on testing and phase , use at your risk on demo) Free Telegram Bridge < click here  This indicator includes an advanced Strategy, a trading sys
Entry Points Pro shows you where to enter, where to put the stop and what lot to trade — before you place the order. PRICE Now 199 USD: 4 copies at this price, then 249 USD. The final price is 349 USD. I make my money trading the markets, and I show it, so I don't need to sell this indicator to everyone. It is a tool for traders who think for themselves, not a magic button. No breakout, no trade. A gray arrow is a cancelled signal: price did not break the signal candle, so there was no entry
SuperScalp Pro
Van Minh Nguyen
4.54 (37)
SuperScalp Pro - Professional Multi-Layer Confluence Scalping System SuperScalp Pro is an advanced scalping indicator that upgrades the classic Supertrend with multiple intelligent confirmation filters. It helps you identify higher-probability Buy/Sell opportunities while significantly reducing false signals. Clear Buy and Sell arrows appear directly on the chart, along with automatic ATR-based Stop Loss and Take Profit levels calculated in real time. After purchase, please message me on MQL5 to
Gann Made Easy   is a professional and easy to use Forex trading system which is based on the best principles of trading using the theory of W.D. Gann. The indicator provides accurate BUY and SELL signals including Stop Loss and Take Profit levels. You can trade even on the go using PUSH notifications. PLEASE CONTACT ME AFTER PURCHASE TO GET TRADING  INSTRUCTIONS   AND GREAT EXTRA INDICATORS  FOR FREE! Probably you already heard about the Gann trading methods before. Usually the Gann theory is a
M5 Sniper
MeanFX
5 (4)
Get your trading edge in the line of sight M5 Sniper   is a new indicator by MeanFX. It combines   precise trading signals   with   adaptive TP/SL levels   - creating best possible statistical trades as a result! The price increases every 5 purchases, the next price is 79$ Message me after purchase to receive tips/guide and bonus EA plus trading methodology Auto Optimisation only works on LIVE chart , needs data feed >JOIN Community Channel < What makes it stand out?   Proven statistical per
SMC Intraday Formula
VividMind Digital Solutions
5 (26)
Secure the Lowest Price Today. After purchase, contact via   MQL5 inbox   to receive your buyer kit and bonus. Let's be honest first. No indicator will make you profitable on its own. If someone tells you otherwise, they're selling you a dream. Every indicator that shows perfect buy/sell arrows can be made to look flawless — just zoom into the right window of history and screenshot the winners. We won't do that. SMC Intraday Formula is a tool. It reads the market structure for you, maps the hig
Zoryk Gold
Reda El Koutbane
4.68 (22)
discount ends SOON next price 69 $ ZORYK — Advanced XAUUSD Signal System for MetaTrader 5 You know the feeling. You spend time analyzing gold. You wait for the entry. You finally open the trade, and price immediately moves against you. You close too early, move the Stop Loss or hesitate for a few seconds. Then the market reaches the exact destination you originally expected without you. The direction was not always the problem. The real problem was uncertainty. You did not know exactly where th
Ultra Indicator
Ihor Otkydach
5 (1)
ULTRA is a technical indicator that operates on an “all-in-one” basis—it independently analyzes the market, generates trading signals, displays levels for setting stop-loss orders, and suggests when to close trades to lock in profits or minimize losses. In other words, it doesn't matter if you don't know how to analyze the market, determine levels—where to set your stop-loss—or struggle with money management. ULTRA will do all of that for you! BUYER BONUS: After purchasing the ULTRA indicator, s
GoldenX Entry MT5
VividMind Digital Solutions
5 (17)
Price will increase by $20 every 10 buyers to maintain premium value. After purchase, contact via   MQL5 inbox   to receive your buyer kit and bonus. You have probably tested dozens of indicators before. But we are not here to be “just another signals indicator.” Behind GoldenX Entry is intensive research & development focused on building sophisticated algorithms designed to adapt to the real behavior of every instrument — not generic signals recycled everywhere else. From advanced Auto Optim
Currency Strength Wizard   is a very powerful indicator that provides you with all-in-one solution for successful trading. The indicator calculates the power of this or that forex pair using the data of all currencies on multiple time frames. This data is represented in a form of easy to use currency index and currency power lines which you can use to see the power of this or that currency. All you need is attach the indicator to the chart you want to trade and the indicator will show you real s
Gold Trend Coach MT5
Cristhian Alexander Gaibor Cuasquer
4.27 (11)
Non-repainting buy and sell signals for gold (XAUUSD) on MetaTrader 5. Every signal comes with a stop loss and three take profits. A Smart Money Concepts filter with BOS and CHoCH, so you trade with the structure, not against it. A live Mentor on your panel that guides every step from the entry to TP3. And alerts straight to your phone and your own Telegram channel. That is Gold Trend Coach. Never trade alone again. FREE BUYER KIT with your purchase: 1. Telegram Alert Bridge: your signals go to
Auto Optimized SpeedAngle is an institutional-grade momentum vectoring system that eliminates curve-fitting through continuous Walk-Forward Optimization (WFO). Rather than relying on static inputs that degrade when market regimes shift, the indicator dynamically recalibrates its parameters using Out-of-Sample (OOS) validation, ensuring the displayed signals represent genuine statistical edges rather than historical anomalies. By shifting the focus from subjective visual angles to normalized, qua
Boba Analysis Suite
Trade Ready Solutions LLC
5 (2)
Boba Analysis Suite Boba Analysis Suite is an analytical indicator for MetaTrader 5. It brings market structure, relevant price zones and broader market context together in a single chart view. Developed through practical experience as a trader and trading coach, it supports a structured analysis process: assessing market direction, identifying important levels and considering multiple timeframes together. Analysis in Context Individual signals gain meaning through context. Boba Analysis Suite h
FX Power MT5 NG
Daniel Stein
5 (33)
FX Power: Analyze Currency Strength for Smarter Trading Decisions Overview FX Power is your go-to tool for understanding the real strength of currencies and Gold in any market condition. By identifying strong currencies to buy and weak ones to sell, FX Power simplifies trading decisions and uncovers high-probability opportunities. Whether you’re looking to follow trends or anticipate reversals using extreme delta values, this tool adapts seamlessly to your trading style. Don’t just trade—trade
BLACK FRIDAY – 20% OFF Multi Currency Strength and Momentum Indicator MT5 Dynamic Forex28 Navigator is the evolution of our long-time, popular indicators, combining the power of five in one: Advanced Currency Strength28 Indicator (700 reviews) Advanced Currency IMPULSE with ALERT (530 reviews) Currency Strength EXOTICS GOLD Impulse with Alert CS28 Combo Signals (recent Bonus) No need to buy four indicators and stack them on your charts. All of it is merged into one powerful indicator: the streng
M1 Sniper MT5
Oleg Rodin
5 (7)
M1 SNIPER  is an easy to use trading indicator system. It is an arrow indicator which is designed for M1 time frame. The indicator can be used as a standalone system for scalping on M1 time frame and it can be used as a part of your existing trading system. Though this trading system was designed specifically for short-term trading, it still can be helpful for all traders. This trading system can be used with any forex pair and time frame, though lower time frames are recommended from M1 up to M
Atomic Analyst MT5
Issam Kassas
4.51 (65)
Atomic Analyst — MetaTrader 5 Message me on MQL5 after purchase to receive Smart Universal Expert Advisor for FREE, plus the online course, PDF manual, and private group access. Atomic Analyst brings price action, trend direction, entry and exit signals, Stop Loss and multiple Take Profit levels together on your chart. SEE THE SIGNAL. UNDERSTAND THE SETUP. Atomic Analyst organizes its analysis into clear visual information: • Buy and sell arrows to identify potential entries. • Stop Loss and mul
Unix Scalper
Issam Kassas
4 (4)
Unix Scalper — MetaTrader 5 Message me on MQL5 after purchase to receive Smart Universal Expert Advisor for FREE, plus the online course, PDF manual, and private group access. Find the setup. See the plan. Choose how to trade it. UNIX Scalper brings market analysis, BUY/SELL/WAIT decisions and Entry, Stop Loss, TP1 and TP2 levels into one organized panel. SEE THE SIGNAL AND THE PLAN • Clear decisions: BUY, SELL or WAIT. • Defined levels: Entry, Stop Loss, TP1 and TP2. • Multi-timeframe overvie
Smc Pro ToolKit
Talal N Z Aljarusha
5 (13)
SMC PRO TOOLKIT — SMART MONEY ANALYSIS & STRUCTURED TRADE PLANNING SMC Pro ToolKit is a professional Smart Money Concepts analysis workspace for MetaTrader 5. It combines market structure, multi-timeframe analysis, institutional price zones, setup evaluation, confirmation tools, volume context, alerts, and risk planning inside one organized chart environment. One workspace. Multiple layers of confirmation. One structured trading plan. OPEN COMPLETE USER GUIDE MULTI-CONDITION SETUP ENGINE At
Azimuth Pro
Ottaviano De Cicco
5 (7)
Azimuth Pro V2: Synthetic Fractal Structure and Confirmed Entries for MT5 Overview Azimuth Pro is a multi-level swing structure indicator by Merkava Labs . Four nested swing layers, swing-anchored VWAP, ABC pattern detection, three-timeframe structural filtering, and closed-bar confirmed entries — one chart, one workflow from micro-swings to macro-cycles. This is not a blind signal product. It is a structure-first workflow for traders who care about location, context, and timing. 1. What Change
Apex Patterns PRO Buy Indicator - Get Expert Advisor Based on it for FREE. Self-Optimizing Chart Pattern & Breakout Intelligence Traditional pattern scanners rely on fixed inputs, often underperforming when market volatility and structures shift. Apex Patterns PRO is designed to adapt to changing market conditions by combining structural chart pattern recognition, momentum filtering, and statistical self-optimization into one analytical framework. Adaptive Scanning Engine Self-Optimizing Patter
Welcome to Entry In The Zone & SMC Multi Timeframe Entry In The Zone & SMC Multi Timeframe An indicator designed for market analysis based on Smart Money Concepts (SMC), displaying Market Structure, Key Zones (Order Blocks, Supply & Demand Zones, and Fair Value Gaps), Liquidity, and real-time BUY / SELL signals. It supports both Single-Timeframe and Multi-Timeframe analysis, along with the Confluence at Zone feature, which helps you evaluate supporting factors when price enters a key zone. Real-
Divergence Bomber
Ihor Otkydach
4.89 (94)
Each buyer of this indicator also receives the following for free: The custom utility "Bomber Utility", which automatically manages every trade, sets Stop Loss and Take Profit levels, and closes trades according to the rules of this strategy Set files for configuring the indicator for various assets Set files for configuring Bomber Utility in the following modes: "Minimum Risk", "Balanced Risk", and "Wait-and-See Strategy" A step-by-step video manual to help you quickly install, configure, and
Power Candles MT5
Daniel Stein
4.58 (12)
Power Candles - Self-Optimizing Strength Indicator Strength usually lives in a sub-window. The line runs below, the candle above, and your eye keeps connecting the two. Power Candles puts the strength into the candle itself, colored from dark red to dark green, so the chart reads at a glance and the sub-window stays closed. The indicator also finds its own settings for the symbol and timeframe in front of you. One click on [ Apply Best ] draws entry, Stop Loss and Take Profit at the exact prices
Gold Entry Sniper
Tahir Mehmood
5 (23)
Gold Entry Sniper – Professional Multi-Timeframe ATR Dashboard for Gold Scalping & Swing Trading Gold Entry Sniper is a cutting-edge MetaTrader 5 indicator designed to give traders precise buy/sell signals for XAUUSD and other symbols, powered by ATR Trailing Stop logic and a multi-timeframe analysis dashboard . Built for both scalpers and swing traders, it combines real-time market direction , dynamic stop levels , and professional visual dashboards to help you identify high-probability gold en
Gold Sniper Scalper Pro
Ich Khiem Nguyen
3.9 (10)
Gold Sniper Scalper Pro is a MetaTrader 5 indicator built specifically for detecting false breakout patterns on XAUUSD. It identifies the 4-bar trap structure where price breaks a range boundary, draws in breakout traders, then reverses back inside — confirming the move was a false breakout. The indicator scores each setup across 17 quality factors, evaluates it through a 4-layer confluence pipeline, verifies it against a 7-timeframe trend consensus engine, and checks it against a gold volatili
Naked Forex Tweezer Pro Indicator Tweezer Pro Indicator is a pattern recognition indicator for Forex, Stocks, Indices, Futures, Commodities and Cryptos. The standard Tweezer is a two bar pattern. Our enhanced version is a multi-bar pattern. We filter the patterns for you so that you only get the     best and most effective patterns   and ignore the noise. The Tweezer pattern is a simple and effective pattern to trade. The strategy that comes with the Tweezer is based on price action. The Twe
Adaptive Price Action Engine Buy Indicator- Get EA Based on it for FREE. Self-Optimizing Multi-Timeframe Trend & Candlestick Intelligence Markets do not behave the same way all the time—and not every price-action pattern has the same value in every market regime. Adaptive Price Action Engine is designed to adapt to changing market conditions by combining trend structure, multi-timeframe analysis, candlestick patterns, and statistical optimization into one analytical framework. Two Adaptive Mode
More from author
Smart Liquidity Hunter
Sondang Willborn Soeraja Manik
Smart Liquidity Hunter - Confirmed Swing Sweeps Identify qualifying price sweeps around previously confirmed swing highs and lows. Smart Liquidity Hunter is a chart indicator for MetaTrader 5. It evaluates historical and newly closed candles using price data, rejection characteristics and configurable volatility filters. The indicator displays bullish and bearish sweep markers, eligible swing reference levels and an optional information dashboard. The term liquidity is used here as a price-actio
FREE
Filter:
No reviews
Reply to review