TravaRisco Signal Checker Pro
- Indicators
- Version: 1.0
- Activations: 5

Your indicator shows 81% winners on history. Could you really have taken those trades?
TravaRisco Signal Checker Pro tests any MT5 arrow indicator honestly. It is the full version of the free TravaRisco Signal Checker, with the tools that separate a real edge from a pretty chart.
What the Pro version adds
- Signal delay correction. Many indicators (Fractals, pivots, swing arrows) draw their arrow a few bars after the move. The live repaint check measures this delay and tells you the value to use. With the delay set, every trade is entered at the price you could really have taken.
- SL/TP optimizer with out-of-sample check. 25 combinations of stop loss and take profit are tested on the older part of history. The best one is then tested on the newer part it has never seen. If it fails there, the panel says so: the "best" setting was luck.
- Multi-timeframe scan. The same settings on M5, M15, M30, H1 and H4 in one table. A result that works on a single timeframe is fragile.
- Equity curve in R after costs, drawn in the panel.
- CSV export of every simulated trade (entry, exit, R before and after costs, equity), ready for Excel.
Also included (as in the free version): entry at the next bar open, SL by points or ATR, TP by risk:reward, exit on opposite signal, results before and after spread, commission and slippage, win rate, profit factor, max losing streak, max drawdown, results by session (Asia, London, New York), and a live repaint check that counts signals that vanish or appear late.
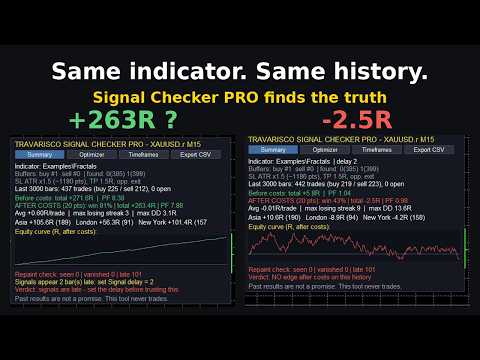
Real example (screenshots): standard Fractals on XAUUSD M15. With delay 0 the history shows +263R, 81% win rate, profit factor 7.9. The tool detects that every signal appears 2 bars late. With delay 2 the same signals give -2.5R and 43% win rate. That is the truth a trader would have lived.
How to use
- Indicator name exactly as in the Navigator (e.g. Examples\Fractals). Empty = built-in demo (EMA 20/50).
- Choose the buy and sell buffer numbers (the panel shows how many values each buffer has), or read arrow objects from the chart.
- Use the buttons Summary, Optimizer, Timeframes and Export CSV.
- For the repaint check and delay measurement, run it on a live chart or in the Strategy Tester in visual mode.
Honest notes: this is a simulation on bar data, not a guarantee. If SL and TP are hit in the same bar it counts as a loss. Past results are not a promise of future results. The tool never opens trades.
Try the free TravaRisco Signal Checker first. Other TravaRisco tools: Real Cost Monitor (free), Daily Loss Lock, Trade Manager, Lot Calculator (free).