Session Flow Map MT4
- Indicators
-
Evgeniy Zhdan
 ➖➖➖➖➖➖➖➖➖➖➖➖➖➖➖➖➖➖➖➖➖➖
Products: https://www.mql5.com/en/users/trendhunter/seller
➖➖➖➖➖➖➖➖➖➖➖➖➖➖➖➖➖➖➖➖➖➖ - Version: 2.20
- Activations: 5
SessionFlowMap — Multi-Session Volume & Delta Profile with POC Levels
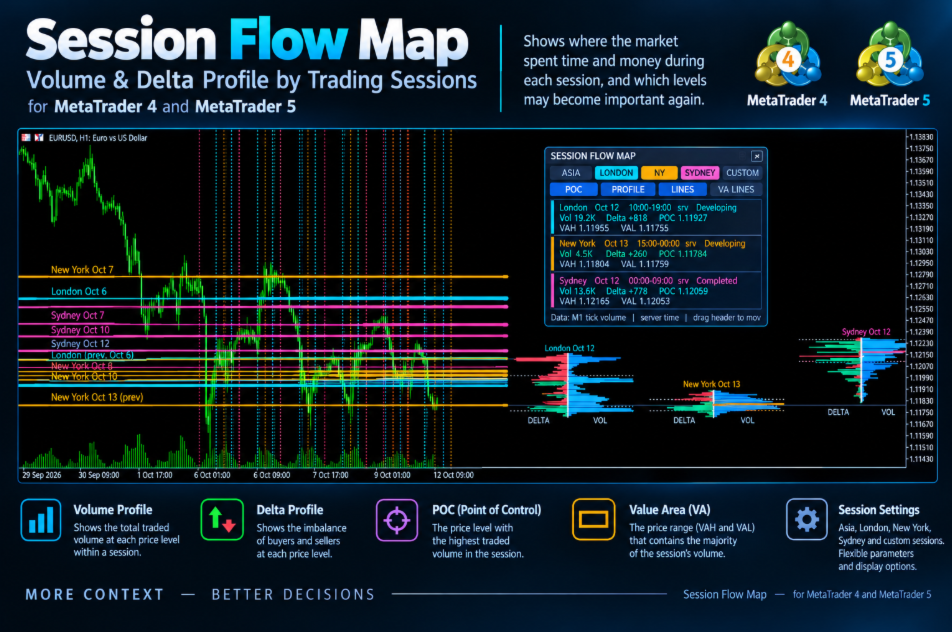
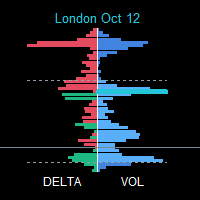
SessionFlowMap builds a volume profile and a delta profile (buy/sell imbalance) for the sessions of the forex day: Asia, London, New York, plus an optional Sydney and a custom session. For every session it finds the POC (Point of Control — the price with the highest traded volume) and the Value Area (VAH and VAL — the range that holds most of the volume) and projects these levels forward as horizontal lines. You can see at a glance where the market spent time and money in each session and which levels may matter again.
MT5-version: https://www.mql5.com/en/market/product/200942
How it works
- Each session is cut out of the M1 history using its own hours. Asia, London, New York and Sydney hours are set in GMT and automatically converted to your broker's server time. The custom session uses server time directly.
- The session's price range is divided into price rows (you set the target number). Volume is distributed across the rows. Forex has no centralized volume, so tick volume is used.
- The volume profile is the total volume in each row. The delta profile is buy volume minus sell volume in each row (green — buyers dominate, red — sellers).
- In "M1 bars" mode the buy/sell split is estimated from where each candle closes inside its range. In "Real ticks" mode it comes from the direction of each tick (or from BUY/SELL flags when the broker provides them).
- The POC is the row with the largest volume. The Value Area expands from the POC until it covers the chosen percentage of volume (70% by default), which gives VAH and VAL.
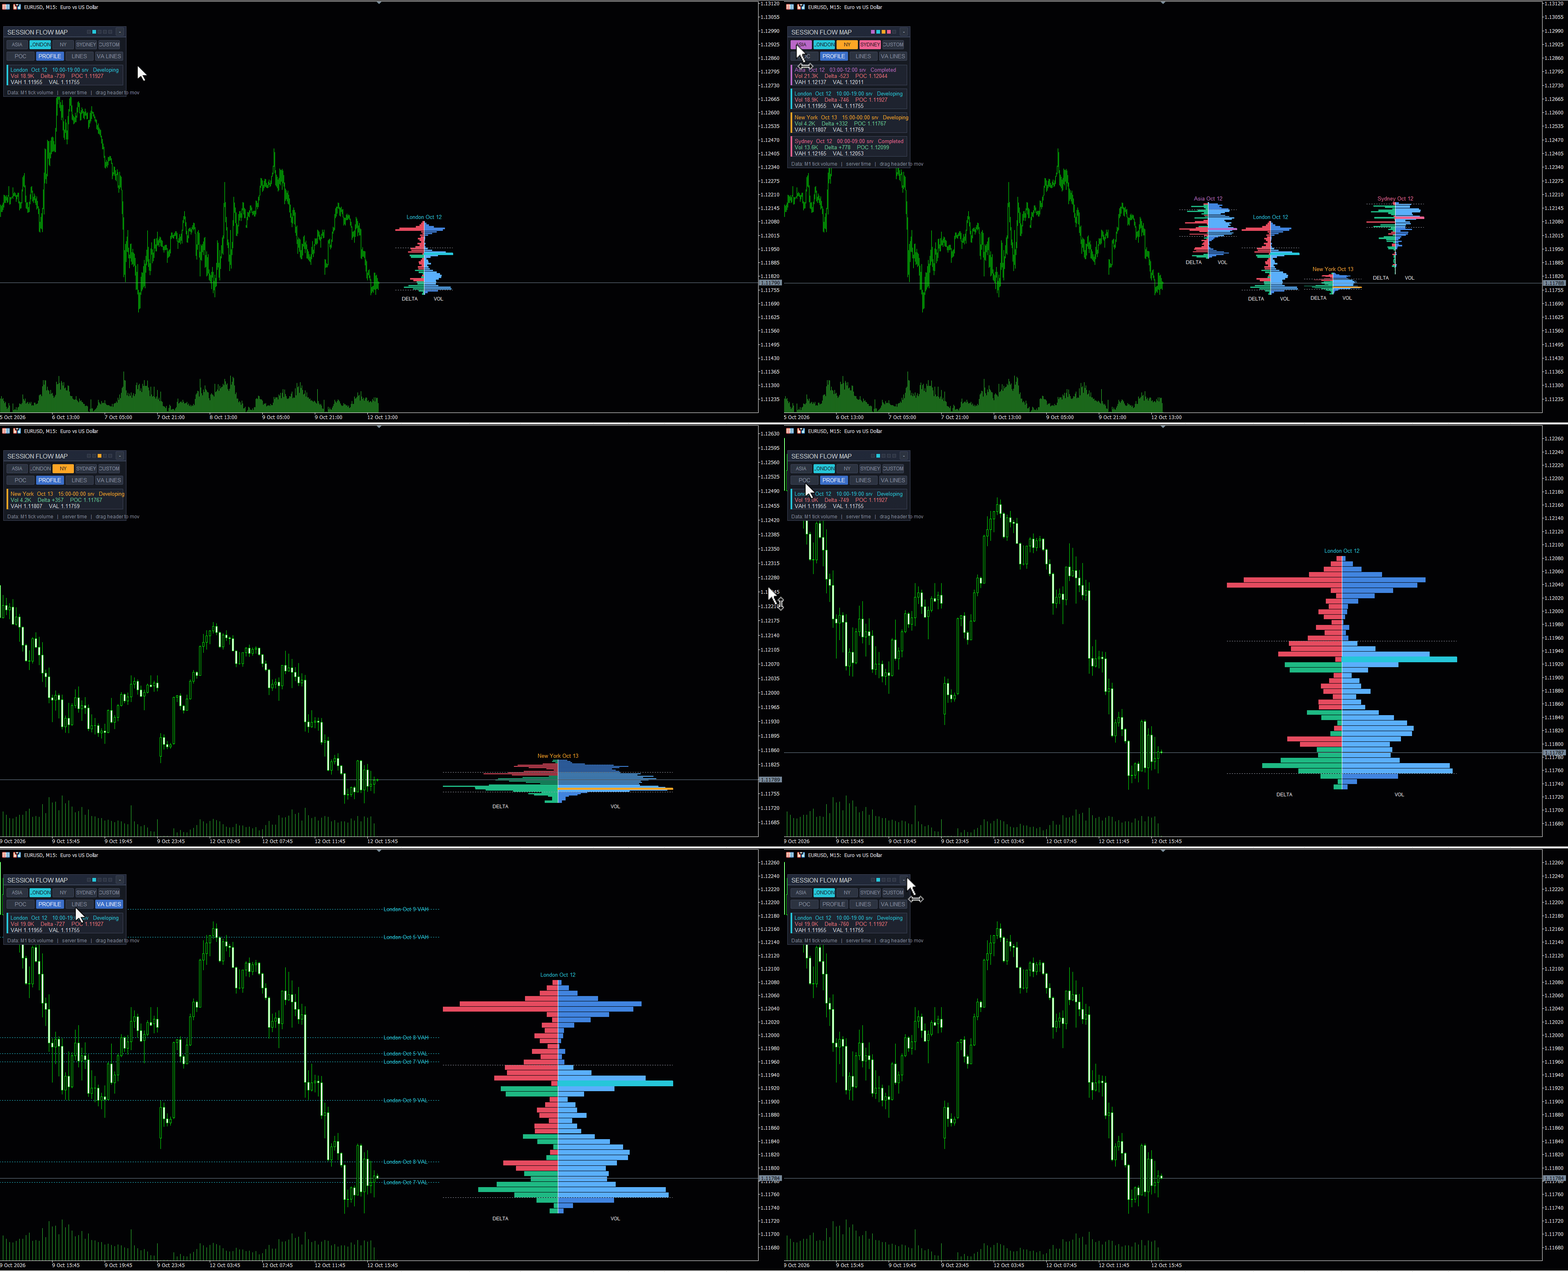
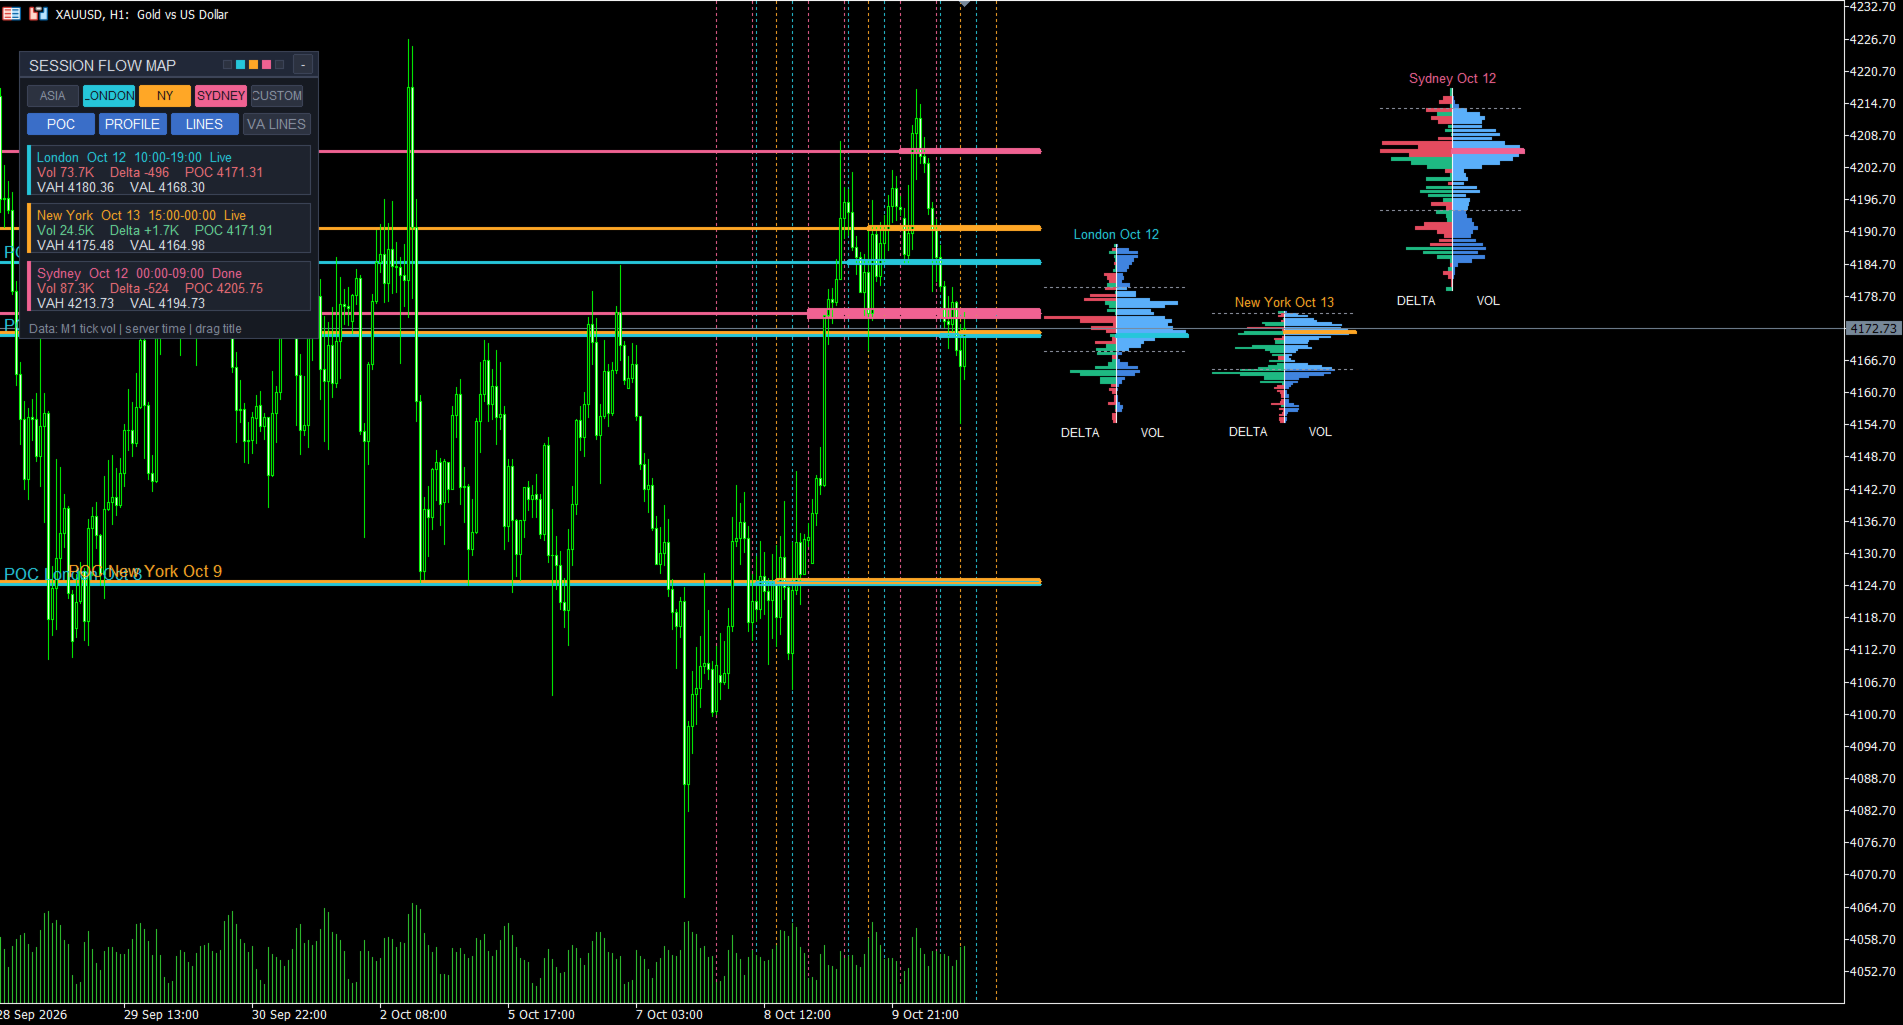
- The latest profile of each session is drawn as a cluster to the right of the last candle (volume and delta back to back around a divider), or inside the session itself on the chart. The POC is drawn as a zone and/or a line; a long line runs across the whole chart with a label above it on the left. POCs of previous sessions remain on the chart as reference levels.
- Vertical lines mark the start and end of every session. Each session has its own color.
How a trader can use it
- The previous session's POC as support or resistance, and as a "magnet" for price: watch how price reacts when it returns to the level.
- Naked POC mode: levels that price has not revisited stay extended; after the first touch the line stops.
- VAH and VAL as the edges of fair value: acceptance inside the area, rejection outside it, breakouts beyond the Value Area.
- The delta profile shows at which prices buyers or sellers dominated; compare the delta at the POC with neighboring rows.
- Session context: the Asian range, where London and New York POCs sit relative to it, the London/New York overlap.
- Confluence: when POCs of different sessions and days sit close together, they form a more significant zone.
- Alerts tell you when price returns to the extended levels.
- Works on any symbol and timeframe (profiles are built from M1); M5–H1 is the most common choice.
Panel and buttons
- Drag the panel by its header and collapse it with the "-" button. Colored dots in the header show which sessions are enabled.
- The ASIA, LONDON, NY, SYDNEY and CUSTOM buttons turn sessions on and off right on the chart.
- The POC, PROFILE, LINES and VA LINES buttons toggle layers: POC levels, profiles, vertical session lines and extended VAH/VAL.
- Each session has a card: name, date, hours in server time, status (Completed or Developing), volume, delta, POC, VAH and VAL. The bottom line shows the data source.
- Panel position, collapsed state and button states are remembered separately for each chart.
Requirements
M1 history must be loaded for the required period. Enable chart shift and leave free space on the right for the profile clusters.
Settings
1. Sessions
- "Show Asian session" — enables the Asian session (the ASIA button on the panel does the same).
- "Asian session hours (GMT, HH:MM-HH:MM)" — start and end of the Asian session in GMT, default 00:00-09:00. Overnight sessions are supported.
- "Show London session" / "London session hours (GMT, HH:MM-HH:MM)" — the London session, default 07:00-16:00.
- "Show New York session" / "New York session hours (GMT, HH:MM-HH:MM)" — the New York session, default 12:00-21:00.
- "Show Sydney session" / "Sydney session hours (GMT, HH:MM-HH:MM)" — the Sydney session, off by default, hours 21:00-06:00.
- "Show custom session (broker day by default)" / "Custom session hours (SERVER time, HH:MM-HH:MM)" — your own session in server time; the default 00:00-24:00 is the whole broker day.
- "Auto-detect broker GMT offset" — the server's offset from GMT is detected automatically, including the broker's daylight saving changes.
- "Manual broker GMT offset, hours (if auto is off)" — a fixed offset in hours when auto-detection is off.
- "Skip sessions starting on Saturday/Sunday" — skips sessions that begin on a weekend. Tip: London and New York hours are set in GMT; when those centers switch to daylight saving time, shift the hours by one hour.
2. Data
- "Data source" — "M1 bars (tick volume, fast)": quick calculation from one-minute bars; "Real ticks (precise, slower)": precise calculation from ticks, but slower.
- "Refresh interval (seconds)" — how often the current session is recalculated and redrawn. A new candle triggers a recalculation immediately.
3. Volume and delta profiles
- "Show volume profile" — show the volume profile.
- "Show delta profile" — show the delta profile.
- "Volume profile side (delta is opposite)" — which side of the divider the volume is drawn on; delta goes to the opposite side.
- "Target price rows per session (10-70)" — profile detail. If there are too many objects, rows are merged for drawing only; the POC and Value Area stay exact.
- "Profile placement" — "Shared divider at right": the latest profiles of all sessions stand side by side to the right of the last candle; "Session edges": the profile is drawn inside the session's time span.
- "Previous sessions: edge" — at which edge of the session (left or right) previous profiles are drawn.
- "Profiles to display" — "Latest session of each type only": only the most recent session of each type; "Latest + previous sessions": plus earlier ones.
- "Previous sessions with full profiles (1-10)" — how many previous sessions of each type are shown as full profiles.
- "Profile width (% of session, edges mode)" — maximum width of each half of the profile as a percentage of the session duration.
- "Shared divider: width per side (bars)" — width of each half of the profile in bars in shared-divider mode.
- "Shared divider: gap after last bar (bars)" — distance from the last candle to the cluster; increase it if profiles get in the way of price.
- "Show value area high / low lines" — dotted VAH and VAL lines on every profile.
- "Value area (%)" — share of volume inside the Value Area, 70 by default.
- "Show volume / delta numbers in rows" — volume and delta numbers inside the rows.
- "Drawing budget (max histogram boxes)" — limit on histogram objects to keep the terminal fast.
4. POC
- "Show POC" — show the POC.
- "POC display" — "Zone": a filled zone on the POC row; "Line": a line.
- "Zone width basis" — "POC row": the zone equals the POC row; "Custom points": a zone of a set width around the center.
- "Custom zone total width (points)" — total zone width in points for the "Custom points" mode.
- "Extend developing session POC right" — extend the POC of a session that is still forming.
- "Zone transparency (0-100)" — transparency of the zone fill.
- "Zone border width" — thickness of the zone border.
- "Show POC center line inside zone" — a dashed line through the center of the zone.
- "POC line across the whole chart (extended POCs)" — the POC line runs from the start of the history to the cluster, with a label above it on the left.
- "POC line width" — thickness of the POC line.
5. Previous sessions levels
- "Extend previous sessions' POC right" — extend the POCs of completed sessions to the right.
- "Previous sessions to extend per session type (1-30)" — how many of the latest completed sessions of each type to extend.
- "Allow incomplete sessions in history" — allows extending levels of sessions with incomplete data (marked with an asterisk *).
- "Show dated level labels" — level labels with the session name and date.
- "Naked POC mode: stop extension at first revisit" — the line stops at the moment price first returns to the POC.
- "Also extend previous VAH / VAL right" — extend VAH and VAL of previous sessions.
- "Extension length to the right (bars)" — length of the extension to the right in bars when the cluster does not limit the lines.
- "Stop extended lines before the profile cluster (shared divider mode)" — lines end before the profile cluster so that it stays clean.
6. Colors
- "Asian session color", "London session color", "New York session color", "Sydney session color", "Custom session color" — session colors: POC, lines, labels and panel cards.
- "Volume" — color of the volume histogram.
- "Volume inside value area" — color of volume inside the Value Area.
- "Positive delta" / "Negative delta" — colors of positive and negative delta.
- "Value area lines" — color of the VAH and VAL lines.
- "Profile transparency (0-100)" — transparency of the histograms.
- "Show profile titles" — titles above the profiles (session name and date) and below them (VOL and DELTA).
7. Alerts
- "Alert when price touches extended POC / VAH / VAL" — enables alerts when price touches extended levels (VAH and VAL if their extension is on).
- "Popup alert" — a popup window.
- "Push notification" — a push notification to the mobile app.
- "Sound alert" — a sound signal.
- "Touch tolerance (points)" — touch tolerance in points.
8. Panel
- "Show interactive panel (drag header, buttons)" — show the panel with buttons.
- "Panel start X (drag header to move)" / "Panel start Y (drag header to move)" — the panel's initial position; afterwards you can drag it with the mouse.
9. Session lines
- "Show vertical lines at session start / end" — vertical lines at the start and end of sessions.
- "Session lines style" — the style of those lines.