Session Flow Map MT4

SessionFlowMap — Perfil multissessão de volume e delta com níveis POC

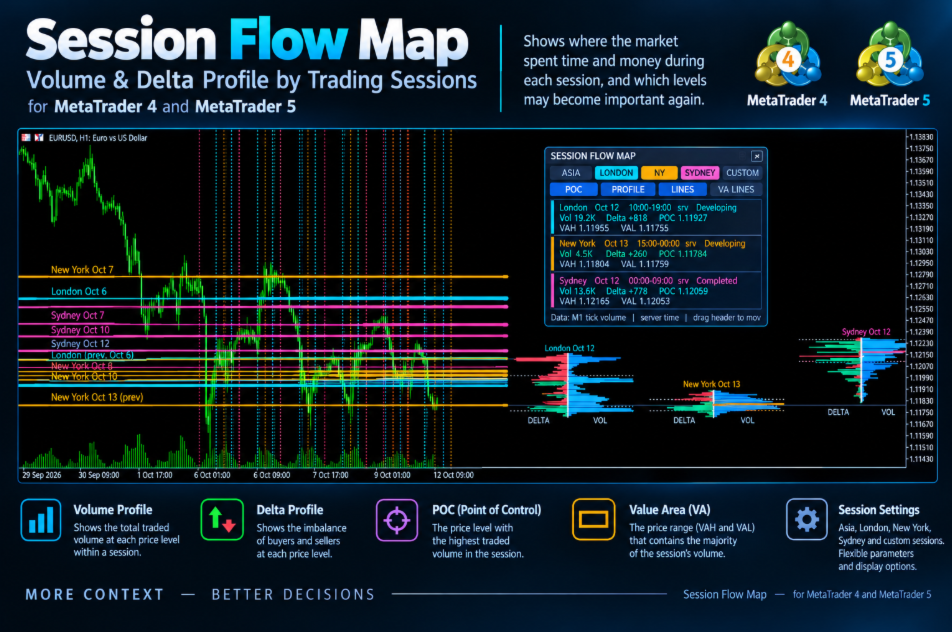
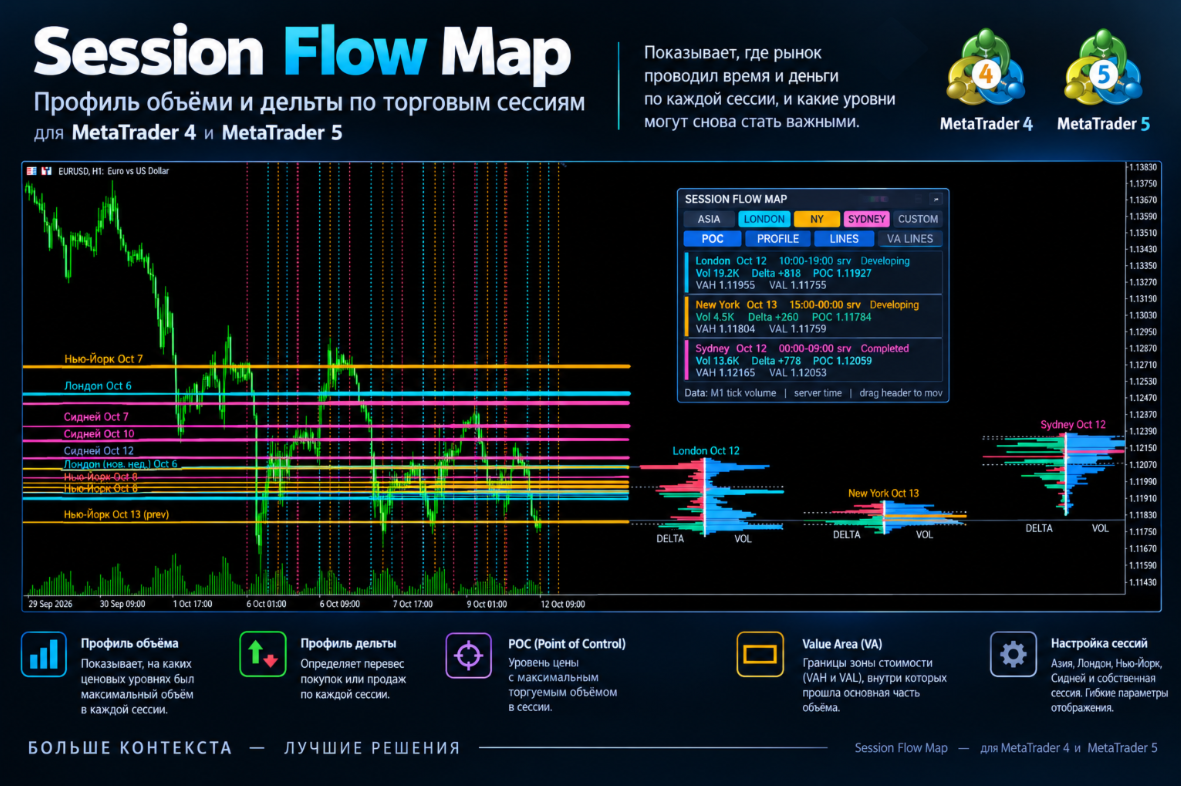
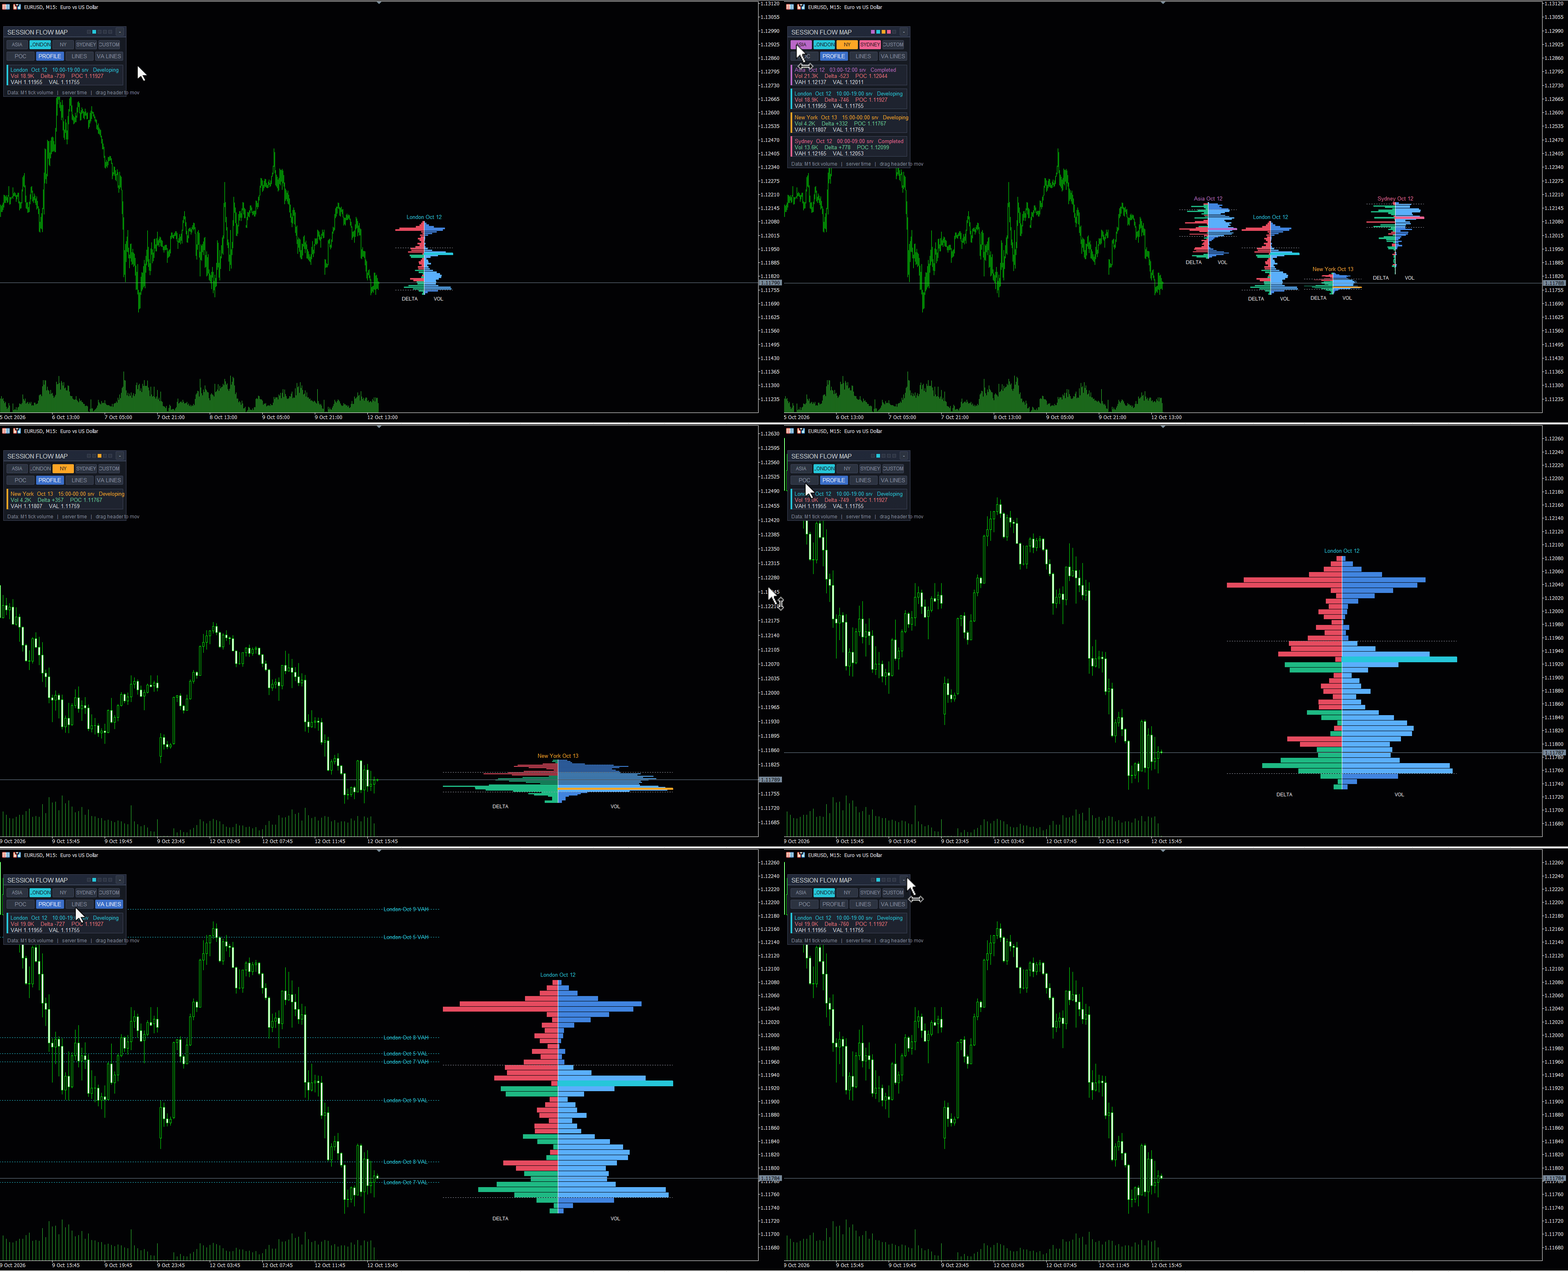
O SessionFlowMap constrói um perfil de volume e um perfil de delta (desequilíbrio entre compras e vendas) para as sessões do dia no forex: Ásia, Londres, Nova York e, opcionalmente, Sydney e uma sessão personalizada. Para cada sessão, encontra o POC (Point of Control: o preço com maior volume negociado) e a Value Area (VAH e VAL: a faixa que concentra a maior parte do volume), e projeta esses níveis para a frente como linhas horizontais. Você vê de relance onde o mercado gastou tempo e dinheiro em cada sessão e quais níveis podem voltar a ser relevantes.

MT5-version: https://www.mql5.com/en/market/product/200942

Como funciona

  • Cada sessão é recortada do histórico M1 de acordo com os seus próprios horários. Os horários de Ásia, Londres, Nova York e Sydney são definidos em GMT e convertidos automaticamente para o horário do servidor da sua corretora. A sessão personalizada usa diretamente o horário do servidor.
  • A faixa de preços da sessão é dividida em linhas de preço (você define o número desejado) e o volume é distribuído entre elas. O forex não tem volume centralizado, por isso é usado o volume de ticks.
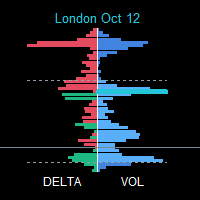
  • O perfil de volume é o volume total em cada linha. O perfil de delta é o volume de compras menos o de vendas em cada linha (verde: dominam os compradores; vermelho: dominam os vendedores).
  • No modo «M1 bars», a divisão entre compras e vendas é estimada pela posição do fechamento de cada vela dentro do seu intervalo. No modo «Real ticks», vem da direção de cada tick (ou das marcações BUY/SELL, quando a corretora as fornece).
  • O POC é a linha com maior volume. A Value Area expande-se a partir do POC até cobrir a porcentagem de volume escolhida (70 % por padrão), o que dá o VAH e o VAL.
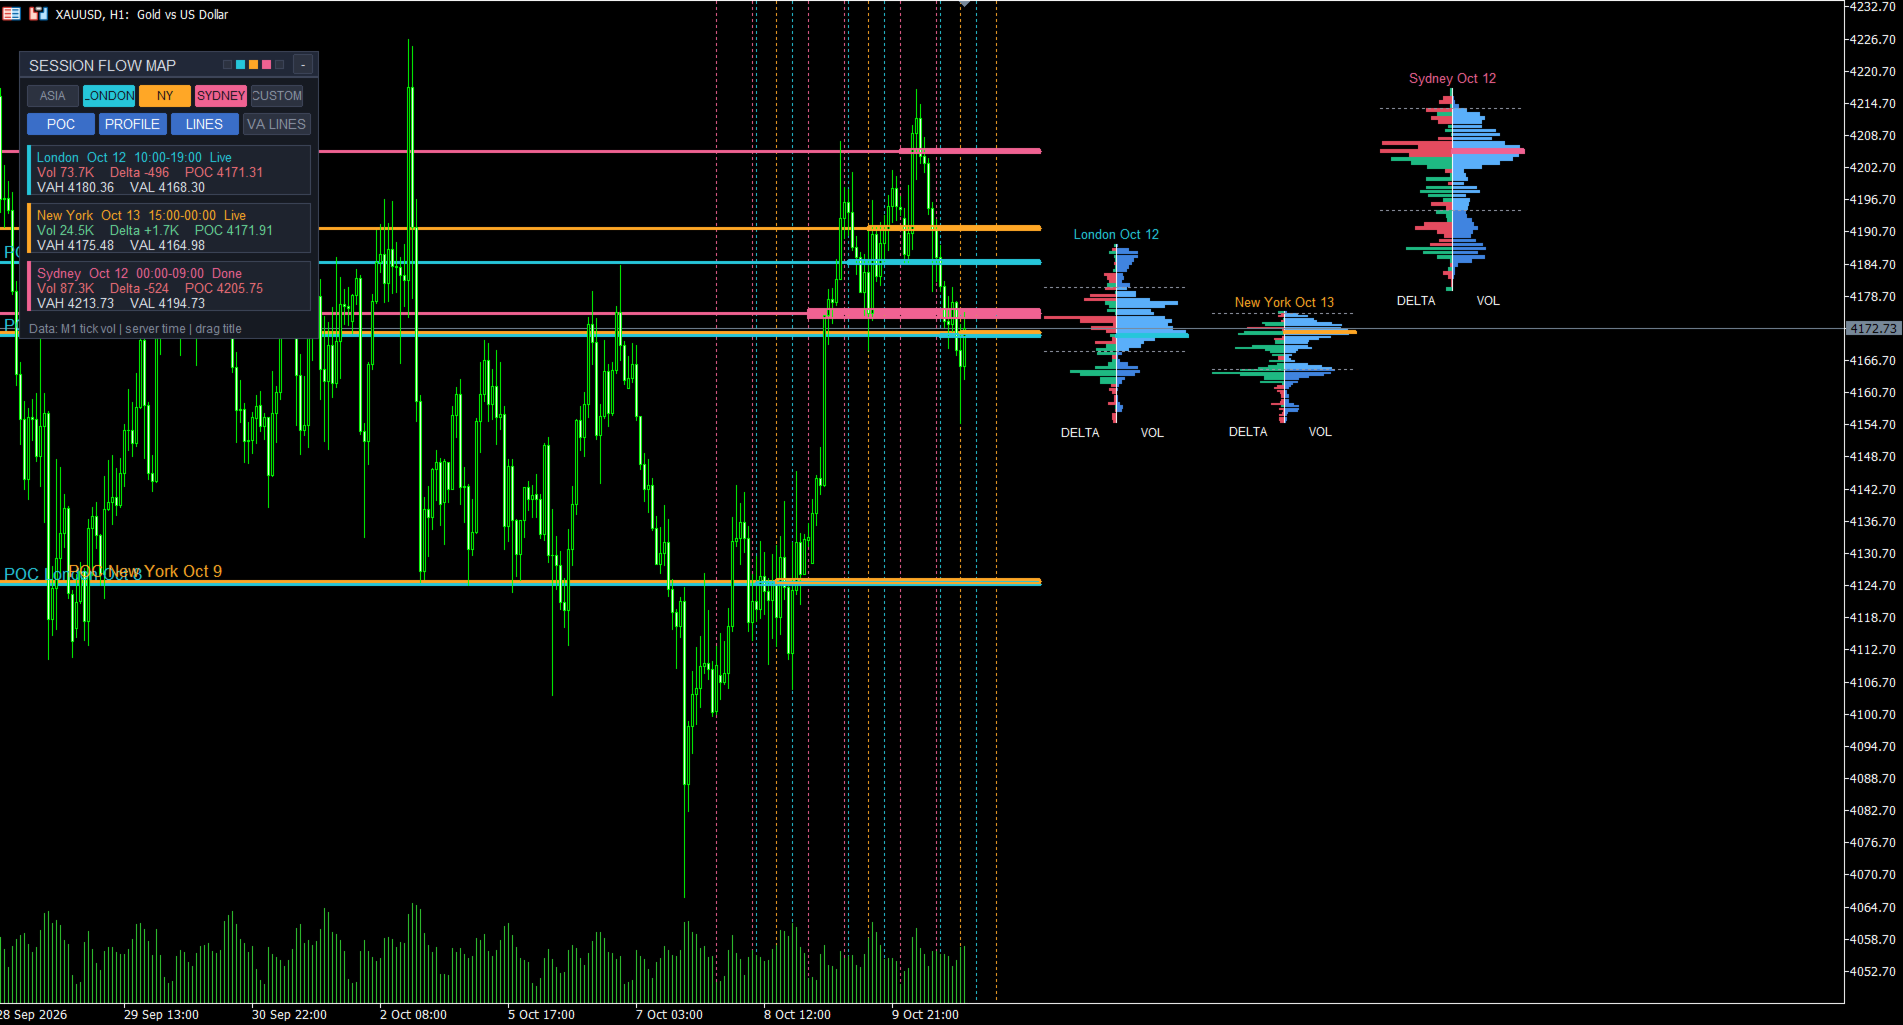
  • O último perfil de cada sessão é desenhado como um cluster à direita da última vela (volume e delta costas com costas em torno de um divisor) ou dentro da própria sessão no gráfico. O POC é desenhado como zona e/ou linha; uma linha longa atravessa todo o gráfico com um rótulo acima, à esquerda. Os POCs de sessões anteriores permanecem no gráfico como níveis de referência.
  • Linhas verticais marcam o início e o fim de cada sessão. Cada sessão tem a sua própria cor.

Como um trader pode usar

  • O POC da sessão anterior como suporte ou resistência e como «ímã» para o preço: observe como o preço reage ao voltar ao nível.
  • Modo POC «nu» (naked POC): níveis que o preço ainda não revisitou permanecem estendidos; após o primeiro toque, a linha para.
  • VAH e VAL como limites do valor justo: aceitação dentro da área, rejeição fora dela e rompimentos da Value Area.
  • O perfil de delta mostra em quais preços dominaram os compradores ou os vendedores; compare a delta no POC com as linhas vizinhas.
  • Contexto das sessões: a faixa asiática, a posição dos POCs de Londres e Nova York em relação a ela e a sobreposição entre Londres e Nova York.
  • Confluência: quando POCs de sessões e dias diferentes ficam próximos, formam uma zona mais significativa.
  • Os alertas avisam quando o preço volta aos níveis estendidos.
  • Funciona em qualquer símbolo e período gráfico (os perfis são construídos a partir do M1); M5–H1 é o uso mais comum.

Painel e botões

  • Arraste o painel pelo cabeçalho e recolha-o com o botão «-». Os pontos coloridos no cabeçalho mostram quais sessões estão ativas.
  • Os botões ASIA, LONDON, NY, SYDNEY e CUSTOM ligam e desligam sessões diretamente no gráfico.
  • Os botões POC, PROFILE, LINES e VA LINES alternam camadas: níveis POC, perfis, linhas verticais das sessões e VAH/VAL estendidos.
  • Cada sessão tem um cartão: nome, data, horário em hora do servidor, estado (Completed ou Developing), volume, delta, POC, VAH e VAL. A linha inferior indica a fonte de dados.
  • A posição do painel, o estado recolhido e o estado dos botões são lembrados separadamente para cada gráfico.

Requisitos

O histórico M1 do período necessário deve estar carregado. Ative o deslocamento do gráfico (Chart shift) e deixe espaço livre à direita para os clusters de perfis.

Configurações

1. Sessions

  • «Show Asian session» — ativa a sessão asiática (o botão ASIA no painel faz o mesmo).
  • «Asian session hours (GMT, HH:MM-HH:MM)» — início e fim da sessão asiática em GMT, padrão 00:00-09:00. Sessões que atravessam a meia-noite são suportadas.
  • «Show London session» / «London session hours (GMT, HH:MM-HH:MM)» — a sessão de Londres, padrão 07:00-16:00.
  • «Show New York session» / «New York session hours (GMT, HH:MM-HH:MM)» — a sessão de Nova York, padrão 12:00-21:00.
  • «Show Sydney session» / «Sydney session hours (GMT, HH:MM-HH:MM)» — a sessão de Sydney, desligada por padrão, horário 21:00-06:00.
  • «Show custom session (broker day by default)» / «Custom session hours (SERVER time, HH:MM-HH:MM)» — a sua própria sessão em hora do servidor; o padrão 00:00-24:00 é o dia inteiro da corretora.
  • «Auto-detect broker GMT offset» — o deslocamento do servidor em relação ao GMT é detectado automaticamente, incluindo as mudanças de horário de verão da corretora.
  • «Manual broker GMT offset, hours (if auto is off)» — deslocamento fixo em horas quando a detecção automática está desligada.
  • «Skip sessions starting on Saturday/Sunday» — ignora sessões que começam no fim de semana. Dica: os horários de Londres e Nova York estão definidos em GMT; quando esses centros mudarem para o horário de verão, desloque as horas em uma hora.

2. Data

  • «Data source» — «M1 bars (tick volume, fast)»: cálculo rápido a partir de barras de um minuto; «Real ticks (precise, slower)»: cálculo preciso a partir de ticks, porém mais lento.
  • «Refresh interval (seconds)» — com que frequência a sessão atual é recalculada e redesenhada. Uma nova vela provoca o recálculo imediatamente.

3. Volume and delta profiles

  • «Show volume profile» — mostrar o perfil de volume.
  • «Show delta profile» — mostrar o perfil de delta.
  • «Volume profile side (delta is opposite)» — em que lado do divisor o volume é desenhado; a delta vai para o lado oposto.
  • «Target price rows per session (10-70)» — nível de detalhe do perfil. Se houver objetos demais, as linhas são agrupadas apenas no desenho; o POC e a Value Area continuam exatos.
  • «Profile placement» — «Shared divider at right»: os últimos perfis de todas as sessões ficam lado a lado à direita da última vela; «Session edges»: o perfil é desenhado dentro do intervalo de tempo da sessão.
  • «Previous sessions: edge» — em qual borda da sessão (esquerda ou direita) os perfis anteriores são desenhados.
  • «Profiles to display» — «Latest session of each type only»: apenas a sessão mais recente de cada tipo; «Latest + previous sessions»: mais as anteriores.
  • «Previous sessions with full profiles (1-10)» — quantas sessões anteriores de cada tipo são mostradas com perfil completo.
  • «Profile width (% of session, edges mode)» — largura máxima de cada metade do perfil como porcentagem da duração da sessão.
  • «Shared divider: width per side (bars)» — largura de cada metade do perfil em velas no modo de divisor compartilhado.
  • «Shared divider: gap after last bar (bars)» — distância da última vela até o cluster; aumente se os perfis atrapalharem o preço.
  • «Show value area high / low lines» — linhas pontilhadas de VAH e VAL em cada perfil.
  • «Value area (%)» — proporção do volume dentro da Value Area, 70 por padrão.
  • «Show volume / delta numbers in rows» — números de volume e delta dentro das linhas.
  • «Drawing budget (max histogram boxes)» — limite de objetos do histograma para manter o terminal rápido.

4. POC

  • «Show POC» — mostrar o POC.
  • «POC display» — «Zone»: uma zona preenchida sobre a linha do POC; «Line»: uma linha.
  • «Zone width basis» — «POC row»: a zona equivale à linha do POC; «Custom points»: uma zona de largura definida em torno do centro.
  • «Custom zone total width (points)» — largura total da zona em pontos para o modo «Custom points».
  • «Extend developing session POC right» — estende para a direita o POC de uma sessão ainda em formação.
  • «Zone transparency (0-100)» — transparência do preenchimento da zona.
  • «Zone border width» — espessura da borda da zona.
  • «Show POC center line inside zone» — uma linha tracejada pelo centro da zona.
  • «POC line across the whole chart (extended POCs)» — a linha do POC vai do início do histórico até o cluster, com um rótulo acima, à esquerda.
  • «POC line width» — espessura da linha do POC.

5. Previous sessions levels

  • «Extend previous sessions' POC right» — estende para a direita os POCs das sessões concluídas.
  • «Previous sessions to extend per session type (1-30)» — quantas das últimas sessões concluídas de cada tipo são estendidas.
  • «Allow incomplete sessions in history» — permite estender níveis de sessões com dados incompletos (marcados com um asterisco *).
  • «Show dated level labels» — rótulos de nível com o nome da sessão e a data.
  • «Naked POC mode: stop extension at first revisit» — a linha para no momento em que o preço volta pela primeira vez ao POC.
  • «Also extend previous VAH / VAL right» — estende também o VAH e o VAL das sessões anteriores.
  • «Extension length to the right (bars)» — comprimento da extensão para a direita em velas quando o cluster não limita as linhas.
  • «Stop extended lines before the profile cluster (shared divider mode)» — as linhas terminam antes do cluster de perfis, para que ele fique limpo.

6. Colors

  • «Asian session color», «London session color», «New York session color», «Sydney session color», «Custom session color» — cores das sessões: POC, linhas, rótulos e cartões do painel.
  • «Volume» — cor do histograma de volume.
  • «Volume inside value area» — cor do volume dentro da Value Area.
  • «Positive delta» / «Negative delta» — cores da delta positiva e negativa.
  • «Value area lines» — cor das linhas VAH e VAL.
  • «Profile transparency (0-100)» — transparência dos histogramas.
  • «Show profile titles» — títulos acima dos perfis (nome da sessão e data) e abaixo deles (VOL e DELTA).

7. Alerts

  • «Alert when price touches extended POC / VAH / VAL» — ativa alertas quando o preço toca níveis estendidos (VAH e VAL se a sua extensão estiver ativada).
  • «Popup alert» — janela pop-up.
  • «Push notification» — notificação push para o aplicativo móvel.
  • «Sound alert» — sinal sonoro.
  • «Touch tolerance (points)» — tolerância de toque em pontos.

8. Panel

  • «Show interactive panel (drag header, buttons)» — mostrar o painel com botões.
  • «Panel start X (drag header to move)» / «Panel start Y (drag header to move)» — posição inicial do painel; depois você pode arrastá-lo com o mouse.

9. Session lines

  • «Show vertical lines at session start / end» — linhas verticais no início e no fim das sessões.
  • «Session lines style» — estilo dessas linhas.
Produtos recomendados
Simple QM Pattern
Suvashish Halder
3.33 (3)
Simple QM Pattern is a powerful and intuitive trading indicator designed to simplify the identification of the Quasimodo (QM) trading pattern. The QM pattern is widely recognized among traders for effectively signaling potential reversals by highlighting key market structures and price action formations. This indicator helps traders easily visualize the QM pattern directly on their charts, making it straightforward even for those who are new to pattern trading. Simple QM Pattern includes dynamic
FREE
Market Profile 3
Hussien Abdeltwab Hussien Ryad
3 (2)
Market Profile 3 MetaTrader 4 indicator  — is a classic Market Profile implementation that can show the price density over time, outlining the most important price levels, value area, and control value of a given trading session. This indicator can be attached to timeframes between M1 and D1 and will show the Market Profile for daily, weekly, monthly, or even intraday sessions. Lower timeframes offer higher precision. Higher timeframes are recommended for better visibility. It is also possible t
FREE
Enhanced Volume Profile: The Ultimate Order Flow & Liquidity Analysis Tool Overview Enhanced Volume Profile   is an indicator for MetaTrader 5 that displays the traded volume at specific price levels over a defined period. It separates the total volume into buy and sell components, presenting them as a side-by-side histogram on the chart. This allows users to observe the volume distribution and the proportion of buy and sell volumes at each price level. Graphics Rendering The indicator uses t
FREE
SX Supply Demand Zones accurately identifies and draws high-probability Supply and Demand zones using a sophisticated algorithm. Unlike traditional indicators that clutter your chart, this indicator is designed with a focus on performance and a clean user experience. New Unique Feature: Interactive Legend System What truly sets this indicator apart from everything else is the Interactive Control Legend. You have a professional dashboard directly on your chart that allows you to: Show/Hide: Ins
FREE
The   Visual Volatility Clustering   indicator clusters the market based on volatility. The indicator does not redraw and gives accurate data, does not use closing prices. Uses the opening prices or the highs or lows of the previous completed bar. Therefore, all information will be clear and unambiguous. The essence of the indicator is to divide the price market into certain areas according to a similar type of volatility. This can be done in any way. In this example, the indicator is configure
Here   our more valuable tools SMC Trend Trading   ,  Easy SMC Trading  ,  Institutional SMC Architect Volume Analysis Tools  ,  Volume flow Profile  ,  Market volume profile  , FVG with Volume  , Liquidity Heatmap Profile  ,  Volume Spread Analysis The Market Profile & Volume Profile Indicator is a powerful technical analysis tool designed to visualize market activity and price distribution over specific timeframes. Unlike standard technical indicators that focus solely on price over time, th
Blahtech VWAP
Blahtech Limited
5 (3)
Blahtech VWAP - Volume Weighted Average Price (VWAP) is the ratio of price to total volume. It provides an average price over a specified time interval.  Links [  Install  |  Update  |  Documentation   ] Feature Highlights Configurable VWAP Line Sessions, intervals, anchored or continuous Previous day settlement line Standard Deviation bands Alerts at bar close or real time Automatic Broker or Tick volumes Significantly reduced CPU usage Input Parameters Expert Advisor Mode  - Reserved for iC
FREE
The indicator allows you to trade binary options. The recommended time frame is М1 and the expiration time is 1,2,3 minutes. The indicator suitable for auto and manual trading. A possible signal is specified as a arrows above/under a candle. You should wait until the candle closes! Arrows are not re-painted Trade sessions: TOKYO section (Half-end) Currency pairs: USD/JPY Working time frame: M1 Expiration time: 1,2,3 minutes. The indicator also shows good results when using the martingale strateg
FREE
Blahtech Supply Demand
Blahtech Limited
4.58 (36)
Was: $299  Now: $99   Supply Demand uses previous price action to identify potential imbalances between buyers and sellers. The key is to identify the better odds zones, not just the untouched ones. Blahtech Supply Demand indicator delivers functionality previously unavailable on any trading platform. This 4-in-1 indicator not only highlights the higher probability zones using a multi-criteria strength engine, but also combines it with multi-timeframe trend analysis, previously confirmed swings
BoxProfile MT4
Evgeny Shevtsov
4.92 (12)
The indicator displays volume profiles based on the nesting principle. Profiles periods are pre-set so that each subsequent profile has a length twice as long as the length of the previous profile. In addition to profiles, the indicator displays volume clusters sorted by color, depending on the volume they contain. Indicator operation features The indicator works on typical timeframes from M5 to MN, but for calculations uses historical data from smaller timeframes: M1 - for timeframes from M5
FREE
Volume indicator Effect Volume , in the Forex market volumes are unique (tick). This volume indicator demonstrates the level of financial and emotional involvement. When the indicator forms a new top, it indicates that buyers are stronger than sellers over a certain period of time. If the indicator decreases, this indicates that the bears are stronger. Why is it impossible to track normal volumes in Forex? The fact is that this is an over-the-counter market. Consequently, it is practically imp
Money Flow Profile MT5 HERE   Here   our more valuable tools SMC Trend Trading   ,  Easy SMC Trading  ,  Institutional SMC Architect Volume Analysis Tools  ,  Volume flow Profile  ,  Market volume profile  , FVG with Volume  , Liquidity Heatmap Profile  ,  Volume Spread Analysis This Master Edition is engineered for clarity and speed, featuring a unique Auto-Theme Sync system that instantly beautifies your chart layout upon loading. Key Features: True Money Flow Calculation: Goes beyond stand
Forex Market Profile and Vwap
Lorentzos Roussos
4.86 (7)
Perfil do mercado Forex (FMP para breve) O que isso não é: O FMP não é a exibição TPO clássica codificada por letras, não exibe o cálculo geral do perfil de dados do gráfico e não segmenta o gráfico em períodos e os calcula. O que faz : Mais importante ainda, o indicador FMP processará dados que residem entre a borda esquerda do espectro definido pelo usuário e a borda direita do espectro definido pelo usuário. O usuário pode definir o espectro apenas puxando cada extremidade do indicador co
FREE
BoxInside MT4
Evgeny Shevtsov
4.83 (6)
This indicator calculates the volume profile and places labels that correspond to the VAH, VAL and POC levels, for each candle individually. Indicator operation features The indicator works on the timeframes from M5 to MN, but it uses the history data of smaller periods: M1 - for periods from M5 to H1, M5 - for the H4 period, M30 - for the D1 period, H4 - for the W1 period, D1 - for the MN period. The color and location of the VAL, VAH and POC labels on the current candle are considered to be c
FREE
O indicador cria cotações atuais, que podem ser comparadas com as históricas e, com base nisso, fazer uma previsão do movimento dos preços. O indicador possui um campo de texto para navegação rápida até a data desejada. Opções: Símbolo - seleção do símbolo que o indicador exibirá; SymbolPeriod - seleção do período do qual o indicador coletará dados; IndicatorColor - cor do indicador; HorisontalShift - deslocamento das cotações desenhadas pelo indicador pelo número especificado de barras; I
Cumulative Delta MT4
Evgeny Shevtsov
4.86 (29)
The indicator analyzes the volume scale and splits it into two components - seller volumes and buyer volumes, and also calculates the delta and cumulative delta. The indicator does not flicker or redraw, its calculation and plotting are performed fairly quickly, while using the data from the smaller (relative to the current) periods. The indicator operation modes can be switched using the Mode input variable: Buy - display only the buyer volumes. Sell - display only the seller volumes. BuySell -
FREE
Este indicador é baseado na transformada discreta de Hartley. O uso dessa transformação permite aplicar diferentes abordagens ao processar séries temporais financeiras. Uma característica distintiva deste indicador é que suas leituras não se referem a um ponto no gráfico, mas a todos os pontos do período do indicador. Ao processar uma série temporal, o indicador permite selecionar vários elementos da série temporal. A primeira possibilidade de filtragem baseia-se nesta abordagem - todos os comp

Zig Zag 123
Stephen Reynolds
Zig Zag 123 tells us when a reversal or continuation is more likely by looking at the shift in supply and demand. When this happens a signature pattern appears known as 123 (also known ABC) will often break out in direction of higher low or lower high. Stop loss and take profit levels have been added. There is a panel that shows the overall performance of your trades for if you was to use these stop loss and take profit levels.  We get alerted if a pattern 123 appears and also if the price re

FREE
Trend Scan Friend
Israr Hussain Shah
Here   our more valuable tools SMC Trend Trading   ,  Easy SMC Trading  ,  Institutional SMC Architect Volume Analysis Tools  ,  Volume flow Profile  ,  Market volume profile  , FVG with Volume  , Liquidity Heatmap Profile  ,  Volume Spread Analysis Trend Identification: Look for the color change. When candles turn Green , look for Buy opportunities. When they turn Red , look for Sell opportunities. Entry: Enter on the break of the trend line or on the pullback to the line. Stop Loss: Use the
The Visual Volatility Clustering indicator clusters the market based on volatility. The indicator does not redraw and gives accurate data, does not use closing prices. Uses the opening prices or the highs or lows of the previous completed bar. Therefore, all information will be clear and unambiguous. The essence of the indicator is to divide the price market into certain areas according to a similar type of volatility. This can be done in any way. In this example, the indicator is configured fo
SWING VOLUME PROFILE Swing-Based Volume Profile + Fibonacci + RSI -------------------------------------------------- Auto-detected swings. Volume profile. Fibonacci. RSI. All-in-one. -------------------------------------------------- WHAT THIS INDICATOR DOES Swing Volume Profile (SVP) automatically detects structural swings and displays a volume profile for the most recent completed swing — with Fibonacci retracement and RSI overlay. No manual range selection needed. The indicator finds
Volume Profile Sniper v11. 1 - ferramenta abrangente de análise de mercado Abordagem profissional ao comércio O Volume Profile Sniper v11.1 combina mais de 15 filtros-chave em um único indicador, fornecendo sinais claros com base em uma avaliação abrangente da situação do mercado. Principais recursos Análise do desequilíbrio volumétrico-o algoritmo calcula a proporção de compradores e vendedores em cada vela, sinalizando a predominância de uma das partes (limite ajustável de 50% a 90%). Filtr
MarketProfile EForex
Veridiana Adorno Kendrick
O Perfil de Mercado Mostra onde o preço passou mais tempo, destacando níveis importantes que podem ser usados na negociação. É uma ferramenta poderosa que se destina a reunir os componentes fundamentais que compõem cada mercado; preço / volume / tempo, e exibir visualmente sua relação em tempo real à medida que o mercado se desenvolve por um período de tempo pré-determinado. Ferramenta muito poderosa!
TMA AI Bands
Monique Ellen Miranda Dos Santos
O indicador TMA AI Bands é baseado na Média Móvel Triangular (TMA) com bandas superior e inferior dinâmicas e setas claras de compra/venda plotadas diretamente no gráfico. Ele possui IA integrada para otimização adaptativa e garante sem repintura, fornecendo sinais precisos de reversão quando o preço toca as bandas. * Pares: funciona com todos os pares de moedas * Timeframes recomendados: D1 / W1 / MN * Variáveis externas configuráveis:   * TimeFrame – período de cálculo   * HalfLength – s
High/Low Daily Levels is a robust, lightweight, and precision-engineered technical indicator designed for MetaTrader 4. It plots the High and Low prices of the trading session as clean, horizontal dashed lines directly on your active chart. Whether you trade breakouts, trend continuations, or mean-reversion strategies around key session boundaries, this indicator ensures you always have precise visual references without cluttering your workspace. Key Features: * Dual Mode Operation: Choose be
FREE
Liquidity Grab X — Liquidity Sweep & Grab Detector (MT4 & MT5) Liquidity Grab X automatically detects buyside and sellside liquidity sweeps (stop-hunts) at swing pivots and classifies each grab by strength — helping you spot exhaustion moves and potential reversal zones in real time, with instant push notifications to your phone. Full Description Liquidity Grab X is a free rule-based indicator for MetaTrader 4 and MetaTrader 5 that identifies liquidity grabs — moments where price sweeps above a
FREE
The "MR Volume Profile 4" indicator is a charting tool that displays trading volume at different price levels rather than time intervals. A key concept in volume profile is the point of control (POC)—the price level with the highest volume traded during the session or time range. While tools like VWAP or OBV provide volume trends, the "MR Volume Profile 4" indicator offers granular detail about where the most market activity occurs at specific price levels. This makes it a more precise tool for
High Low Open Close MT4
Alexandre Borela
4.81 (21)
Se você gosta deste projeto, deixe uma revisão de 5 estrelas. Este indicador desenha os preços abertos, altos, baixos e finais para o especificado período e pode ser ajustado para um fuso horário específico. Estes são níveis importantes olhados por muitos institucional e profissional comerciantes e pode ser útil para você saber os lugares onde eles podem ser mais activa. Os períodos disponíveis são: Dia anterior. Semana anterior. Mês anterior. Quarto anterior. Ano anterior. Ou: Dia atual. Seman
FREE
Highlights trading sessions on the chart The demo version only works on the AUDNZD chart!!! The full version of the product is available at: (*** to be added ***) Trading Session Indicator displays the starts and ends of four trading sessions: Pacific, Asian, European and American. the ability to customize the start/end of sessions; the ability to display only selected sessions; works on M1-H2 timeframes; The following parameters can be configured in the indicator: TIME_CORRECTION = Correct
FREE
Adjustable Consecutive Fractals  looks for 2 or more fractals in one direction and sends out a on screen alert, sound alert and push notification, for strong reversal points . Adjustable Consecutive Fractals, shows the fractals on chart along with a color changing text for buy and sell signals when one or more fractals appear on one side of price. Adjustable Consecutive Fractals is based Bill Williams Fractals . The standard Bill Williams fractals are set at a non adjustable 5 bars, BUT withe th
Os compradores deste produto também adquirem
Trend SniperX MT4
Sarvarbek Abduvoxobov
5 (5)
Trend Sniper X é um indicador de tendência multitemporal para MetaTrader 5 que ajuda os traders a identificar a direção da tendência e potenciais pontos de reversão com clareza e precisão. Para MT5: https://www.mql5.com/en/market/product/181101 Informação de preço: O preço atual é promocional e está sujeito a alterações à medida que novas atualizações e recursos forem lançados. Canal Code2Profit Domine o Mercado com Análise Multitemporal! Como Maximizar sua Taxa de Acerto com o Trend Sniper X: R
SR Liquidity
Oleg Rodin
5 (2)
O SR Liquidity é um indicador de trading projetado para revelar as zonas ocultas onde a liquidez do mercado se concentra e o preço reage com maior intensidade. Essas áreas específicas de liquidez funcionam como níveis poderosos de suporte e resistência, oferecendo um mapa claro de onde é mais provável que o mercado reverta. Em vez de traçar linhas comuns de Suporte e Resistência, o SR Liquidity analisa o comportamento real dos preços para detectar as zonas onde se acumulam pressões de compra e v
O sistema PRO Renko é um sistema de negociação altamente preciso especialmente concebido para a negociação de gráficos RENKO. Trata-se de um sistema universal que pode ser aplicado a vários instrumentos de negociação. O sistema neutraliza eficazmente o chamado ruído de mercado, dando-lhe acesso a sinais de inversão precisos. O indicador é muito fácil de usar e tem apenas um parâmetro responsável pela geração de sinal. Você pode facilmente adaptar a ferramenta a qualquer instrumento de negocia
Sinal de tendência GoldRush Arrow O indicador Sinal de tendência GoldRush Arrow fornece uma análise precisa e em tempo real das tendências, adaptada para scalpers de alta velocidade e curto prazo em XAU/USD. Criada especificamente para o intervalo de tempo de 1 minuto, esta ferramenta exibe setas direcionais para pontos de entrada claros, permitindo que os scalpers naveguem em condições de mercado voláteis com confiança. O indicador consiste em setas de alerta PRIMÁRIAS e SECUNDÁRIAS. Os sin
M1 Sniper
Oleg Rodin
4.97 (30)
O M1 SNIPER é um sistema indicador de negociação fácil de usar. É um indicador de seta projetado para o período M1. O indicador pode ser usado como um sistema independente para scalping no período M1 e pode ser usado como parte do seu sistema de negociação existente. Embora este sistema de negociação tenha sido projetado especificamente para negociação no M1, ele também pode ser usado em outros períodos. Originalmente, desenvolvi este método para negociar XAUUSD e BTCUSD. Mas considero-o útil ta
Atomic Analyst
Issam Kassas
5 (13)
Atomic Analyst — MetaTrader 4 Para dúvidas sobre o produto, orientação de configuração ou suporte técnico, envie-me uma mensagem diretamente aqui no MQL5. O indicador transforma cálculos complexos do mercado em sinais visuais simples, candles coloridos, leituras de tendência, níveis de stop loss e várias zonas de take profit que os traders podem entender rapidamente e usar em condições reais de mercado. Principais usos de trading: Scalping e day trade: Desenvolvido para tomada de decisão rápida
Smart Trend Trading System é um indicador para MetaTrader 4 que reúne informações de tendência, sinais de entrada e saída e níveis de preço em um único gráfico. Ele combina mais de 10 ferramentas de trading em um único sistema, incluindo detecção de tendência, zonas de reversão, Smart Cloud, lógica de trailing stop, suporte e resistência, coloração de candles, alertas e análise multi-timeframe. O sistema foi desenvolvido para ajudar você a operar diferentes condições de mercado: Mercados em tend
Miraculous Indicator Binary & Forex v3 StrategySafe Miraculous Indicator Binary & Forex v3 StrategySafe é um indicador profissional criado para traders que desejam sinais claros, confirmações avançadas e uma forma estruturada de operar nos mercados Binary e Forex. A versão v3 traz MIR Dashboard, Miraculous Confirmation Dashboard, GANN Law, níveis Square of 9, ângulos GANN e um modo Forex mais completo para analisar o mercado com mais precisão. Principais recursos Modo Binary e modo Forex em um ú
Gann Made Easy
Oleg Rodin
4.84 (172)
Gann Made Easy é um sistema de negociação Forex profissional e fácil de usar, baseado nos melhores princípios de negociação usando a teoria do sr. W. D. Gann. O indicador fornece sinais precisos de COMPRA e VENDA, incluindo níveis de Stop Loss e Take Profit. Você pode negociar mesmo em movimento usando notificações PUSH. Entre em contato comigo após a compra para receber instruções de negociação e ótimos indicadores extras gratuitamente! Provavelmente você já ouviu muitas vezes sobre os métodos
Elliott Wave Trend was designed for the scientific wave counting. This tool focuses to get rid of the vagueness of the classic Elliott Wave Counting using the guideline from the template and pattern approach. In doing so, firstly Elliott Wave Trend offers the template for your wave counting. Secondly, it offers Wave Structural Score to assist to identify accurate wave formation. It offers both impulse wave Structural Score and corrective wave Structure Score. Structural Score is the rating to sh
Scalper Vault
Oleg Rodin
5 (39)
Scalper Vault é um sistema profissional de escalpelamento que fornece tudo o que você precisa para um escalpelamento bem-sucedido. Este indicador é um sistema de negociação completo que pode ser usado por comerciantes de forex e opções binárias. O período de tempo recomendado é M5. O sistema fornece sinais de seta precisos na direção da tendência. Ele também fornece sinais superiores e inferiores e níveis de mercado Gann. Os indicadores fornecem todos os tipos de alertas, incluindo notificações
Introduction to Fractal Pattern Scanner Fractal Indicator refers to the technical indicator that makes use of the fractal geometry found in the financial market. Fractal Pattern Scanner is the advanced Fractal Indicator that brings the latest trading technology after the extensive research and development work in the fractal geometry in the financial market. The most important feature in Fractal Pattern Scanner is the ability to measure the turning point probability as well as the trend probabi
Difícil de encontrar e com pouca frequência, as divergências são um dos cenários de negociação mais confiáveis. Este indicador localiza e verifica automaticamente divergências ocultas e regulares usando seu oscilador favorito. [ Guia de instalação | Guia de atualização | Solução de problemas | FAQ | Todos os produtos ] Fácil de trocar Encontra divergências regulares e ocultas Suporta muitos osciladores conhecidos Implementa sinais de negociação baseados em fugas Exibe níveis adequados de sto
Advanced Supply Demand
Bernhard Schweigert
4.91 (302)
Atualmente com 30% de desconto! A melhor solução para qualquer Trader Novato ou especialista! Este indicador é uma ferramenta de negociação exclusiva, de alta qualidade e acessível porque incorporamos uma série de recursos proprietários e uma nova fórmula. Com esta atualização, você poderá mostrar fusos horários duplos. Você não só será capaz de mostrar um TF mais alto, mas também mostrar ambos, o TF do gráfico, MAIS o TF mais alto: MOSTRANDO ZONAS ANINHADAS. Todos os traders de Oferta e Demanda
KURAMA GOLD SIGNAL PRO (MT4) — Filtro de 7 camadas · TP/SL automático · Pontuação de qualidade · Salvamento do histórico de sinais | Sistema completo de trading para XAUUSD Sem repintura em tempo real. No instante em que um sinal aparece, a seta, a entrada, o TP e o SL ficam travados no lugar e nunca mais se movem. O que você opera é esse sinal em tempo real. E na v7.20, cada sinal realmente enviado é salvo automaticamente e restaurado com exatidão após reiniciar. BÔNUS PARA
Quantum Naked SMC Prime is a streamlined Smart Money Concepts indicator designed for traders who prefer a clean chart, structured market analysis and clear visual trade setups without unnecessary complexity. The indicator combines market structure, liquidity behavior, institutional zones and confirmation logic into a compact analytical framework. Instead of flooding the chart with technical indicators, Quantum Naked SMC Prime focuses on the core elements of price action and Smart Money Concepts
Scalping Points Pro is an indicator that shows possible price reversal points on the chart and does not redraw its signals. Also, the indicator sends signals to the trader via Email and Push. The accuracy of the signals of this indicator is approximately 92-94% on the M5 timeframe and more than 95% on the H1 timeframe. Thus, this indicator allows the trader to accurately open trades and predict further price movement. The indicator does not redraw its signals.  The indicator works on timeframe
Currency Strength Matrix
Raymond Gilmour
4.5 (26)
THE ONLY CURRENCY STRENGTH INDICATOR BUILT ON PRICE ACTION Most currency strength meters average an oscillator, or measure how far price has travelled. But these are not accurate measures of trend, Currency Strength Matrix measures trend strength, not just if a currency price has gone up or down. Currency Strength Matrix reads market structure . For each of the 28 major pairs it finds the confirmed cycle highs and lows, and decides whether that pair is in an uptrend, a downtrend, or neither. A
Introduction Harmonic Patterns are best used to predict potential turning point. Traditionally, Harmonic Pattern was identified manually connecting peaks and troughs points in the chart. Manual harmonic pattern detection is painfully tedious and not suitable for everyone. You are often exposed under subjective pattern identification with manual pattern detection. To avoid these limitations, Harmonic Pattern Plus was designed to automate your harmonic pattern detection process. The functionality
Scalper Inside PRO
Alexey Minkov
4.74 (69)
Scalper Inside PRO helps you read the intraday trend and plan a trade before you enter the market. It is built around three exclusive strategies for a sharper read of the market. The moment a signal appears, the indicator evaluates market direction and calculates the key levels, so you see the potential entry, the expected stop-loss and several profit-taking levels in advance. Detailed performance statistics show how different instruments and strategies performed in history and help you pick ass
Quantum Breakout Indicator PRO
Bogdan Ion Puscasu
4.96 (26)
Apresentando       Quantum Breakout PRO   , o inovador Indicador MQL5 que está transformando a maneira como você negocia Breakout Zones! Desenvolvido por uma equipe de traders experientes com experiência em negociação de mais de 13 anos,   o Quantum Breakout PRO   foi projetado para impulsionar sua jornada comercial a novos patamares com sua estratégia inovadora e dinâmica de zona de rompimento. O Quantum Breakout Indicator lhe dará setas de sinal em zonas de breakout com 5 zonas-alvo de lucro
Titan Z-Score Pro Titan Z-Score Pro, MetaTrader 4 için tasarlanmış profesyonel düzeyde bir istatistiksel göstergedir. Bu, mevcut fiyatın tarihsel ortalama değerinden kaç standart sapma uzaklaştığını kesin olarak hesaplar. İstatistiksel varyans kullanarak, gösterge yatırımcıların duygusal önyargıdan ziyade matematiksel olasılıklara dayalı aşırı yayılmış piyasa koşullarını ve yüksek olasılıklı ortalama geri dönüş bölgelerini belirlemesine yardımcı olur. Temel Özellikler: Akıllı V-Reversal Mantığı
Currency Strength Wizard é um indicador muito poderoso que fornece uma solução completa para uma negociação bem-sucedida. O indicador calcula o poder deste ou daquele par forex usando os dados de todas as moedas em vários intervalos de tempo. Esses dados são representados em uma forma de índice de moeda fácil de usar e linhas de energia de moeda que você pode usar para ver o poder desta ou daquela moeda. Tudo o que você precisa é anexar o indicador ao gráfico que deseja negociar e o indicador mo
PTS Precision Index Oscillator V2
PrecisionTradingSystems
5 (1)
O Oscilador de Índice de Precisão (Pi-Osc) de Roger Medcalf da Precision Trading Systems A Versão 2 foi cuidadosamente reconfigurada para carregar rapidamente em seu gráfico, e algumas outras melhorias técnicas foram incorporadas para aprimorar a experiência. O Pi-Osc foi criado para fornecer sinais precisos de temporização de negociações projetados para encontrar pontos de exaustão extremos, os pontos para os quais os mercados são forçados a ir apenas para tirar as ordens de todos. Este pro
Super Signal – Skyblade Edition Sistema profissional de sinais de tendência sem repintar / sem atraso com taxa de acerto excepcional | Para MT4 / MT5 Funciona melhor em timeframes mais curtos, como 1 minuto, 5 minutos e 15 minutos. Principais características: Super Signal – Skyblade Edition é um sistema inteligente de sinais desenvolvido especificamente para operações com tendência. Utiliza uma lógica de filtragem em múltiplas camadas para detectar apenas movimentos direcionais fortes sustenta
Entry Points Pro
Yury Orlov
4.59 (175)
Este é um indicador para MT4 que fornece sinais precisos para entrar em uma negociação sem redesenhar. Ele pode ser aplicado a qualquer ativo financeiro: forex, criptomoedas, metais, ações, índices. Ele fornecerá estimativas bastante precisas e informará quando é melhor abrir e fechar um negócio. Assista o vídeo (6:22) com um exemplo de processamento de apenas um sinal que compensou o indicador! A maioria dos traders melhora seus resultados de negociação durante a primeira semana de negociação c
Dynamic Forex28 Navigator
Bernhard Schweigert
4.43 (7)
Dynamic Forex28 Navigator - A ferramenta de negociação Forex de última geração. ATUALMENTE 49% DE DESCONTO. Dynamic Forex28 Navigator é a evolução dos nossos indicadores populares de longa data, combinando o poder de três em um: Indicador Advanced Currency Strength28 (695 avaliações) + Advanced Currency IMPULSE com ALERTA (520 avaliações) + Sinais CS28 Combo (Bônus). Detalhes sobre o indicador https://www.mql5.com/en/blogs/post/758844 O que o Next-Generation Strength Indicator oferece?  Tudo
PZ Swing Trading
PZ TRADING SLU
5 (4)
Swing Trading é o primeiro indicador projetado para detectar oscilações na direção da tendência e possíveis oscilações de reversão. Ele usa a abordagem de negociação de linha de base, amplamente descrita na literatura de negociação. O indicador estuda vários vetores de preço e tempo para rastrear a direção da tendência agregada e detecta situações nas quais o mercado está sobrevendido ou sobrecomprado em excesso e pronto para corrigir. [ Guia de instalação | Guia de atualização | Solução de prob
TPA True Price Action indicator reveals the true price action of the market makers through 100% non-repainting signals (except early signals mode) strictly at the close of a candle! TPA shows entries and re-entries, every time the bulls are definitely stronger than the bears and vice versa. Not to confuse with red/green candles. The shift of power gets confirmed at the earliest stage and is ONE exit strategy of several. There are available now two free parts of the TPA User Guide for our custom
For MetaTrader5 you can download it from the link https://www.mql5.com/en/market/product/187668 True Signal FX is a multi-timeframe trading indicator for MetaTrader 4 designed to provide a complete trading setup directly on the chart. Instead of displaying a single directional signal, the indicator combines market analysis, signal confirmation and trade level calculation in one workspace. When a setup is detected, the trader can see the direction, Entry, Stop Loss and Take Profit levels toget
Mais do autor
O indicador calcula as áreas de parada / reversão de tendência mais prováveis, áreas de movimento de tendência confiantes. O cálculo considera: a taxa de variação de preço; o ângulo de desvio relativo do gráfico; a amplitude média dos movimentos de preços; o preço saindo de sua "zona de conforto"; os valores do indicador ATR. O indicador pode gerar um Alerta quando o preço entrar em uma área de parada / reversão. Definições Desenhe todo o comprimento? - desenhar as áreas até o final do gráf
Buy and sell zones
Evgeniy Zhdan
5 (2)
Indicador para determinar o plano e a tendência. Se o preço estiver abaixo de qualquer um dos dois histogramas e duas linhas (vermelha e azul), esta é uma zona de venda. Ao adquirir esta versão do indicador, versão MT4 para uma conta real e uma demo - como um presente (para receber, escreva-me uma mensagem privada)! Se o preço estiver acima de qualquer um dos dois histogramas e duas linhas (vermelha e azul), esta é uma zona de compra. Versão MT4:   https://www.mql5.com/en/market/product/3793 S
SuperTrend
Evgeniy Zhdan
2.5 (2)
The Supertrend Expert Advisor The Supertrend Expert Advisor with averaging elements. It has been developed during three months until I finally got good results. It is not a scalper. The minimum balance to start trading - 100 $. Is automatically adjusted to the 4 and 5-digit prices. Has an efficient risk management system. The lot and limit on the maximum lot is automatically calculated based on the settings specified in the EA. As a result, you have a complete automated trading system. Download
Stardust
Evgeniy Zhdan
StarDust searches for divergences in the values of several indicators considering them as signs of flat and enters the market if a relatively steady trend is detected. The Expert Advisor trades "basic" symbols with a low spread. The best results are achieved on М15. The EA automatically adjusts to 4 and 5-digit quote flows. Settings Comment_to_orders – comment to a placed order. The field can be left blank if no comment is required. MM – enable money management with automatic setting of a worki
Top Floor
Evgeniy Zhdan
The EA catches the price when it moves against the trend in an effort to open an order in an opposite direction (direction of the main trend). Screenshots illustrate examples of entries and the strategy gist. The EA uses stop losses depending on values of ATR. Settings: Lot_ - if Risk_ = 0, the EA will trade this lot; Risk_ - risk per one trade. Stop loss is taken into account; koeff_ATR - coefficient multiplied by the ATR value to calculate stop loss (the bigger the value, the bigger stop loss
FastBoom
Evgeniy Zhdan
The FastBoom EA finds the most probable points of price pullback/reverse and places an order. It places averaging orders if the price moves further against take profit. Settings of the EA: Lots - initial lot; LotExponent - multiplier for following orders (Martingale). 1 - no multiplier. TakeProfit - take profit in points; Stochastic Settings InpKPeriod - K Period of Stochastic InpDPeriod - D Period of Stochastic InpSlowing - Stochastic Slowing LevHigh - level for sell positions of Stochastic L
The Expert Advisor calculates the double/triple divergence of volumes, and starts trading. It uses a unique formula of lot calculation, which greatly improves stability of trading. Recommended TF - 1h. Currency pair - EURUSD , but the EA can be used on any trading instruments which are not subject to high volatility. Settings mode - trading direction can be set manually; close - order close level (details on the screenshot); Step between orders - step between orders in points; Maximum orders -
OrderOnLine
Evgeniy Zhdan
The Expert Advisor opens orders from the horizontal line, the a trader can set on any level by dragging using the mouse or by changing the line properties. For example, when a horizontal line is above the current price, the EA will open a Buy order once the horizontal line is reached. And vice versa: If the line is below the current price, the EA will open a sell order once the line is crossed. A buy crossover of the line is: opening of the current candlestick below the horizontal line; the curr
SellerATR
Evgeniy Zhdan
5 (1)
The Expert Advisor only sells. Recommended currency pairs : EURUSD; GBPUSD; USDCHF; USDJPY; USDCAD; AUDUSD; EURGBP; EURAUD; EURCHF; EURJPY; GBPCHF; CADJPY; GBPJPY; AUDNZD; AUDCAD; AUDCHF; AUDJPY; CHFJPY; EURNZD; EURCAD; CADCHF; NZDJPY; NZDUSD. Timeframe: H1. Percent% manages closing both loss-making and profitable deals based on the account overall status. Using the EA on 23 symbols mentioned above allows the robot to cope with the drawdown in case of a long trend. While positions on some pairs
Illusion
Evgeniy Zhdan
3 (2)
The Illusion EA uses the probability theory - after a series of consecutive virtual losses - i.e. right during a flat the EA already starts trading in the trend. In addition, the EA considers the ratio of bullish/bearish candles on the higher timeframes to determine the greatest probability of the price movement direction. Only 1 order can be opened at a time. In case of a loss the following order will be placed with an increased lot (the multiplication coefficient is set in the parameters). The
The indicator plots a trend line and determines the levels for opening trades, in case the price goes "too far" away from the trend level. More detailed information is available in the screenshots. Settings Away from the trend line - distance from the trend line to the trades level; Arrow Signal for deals - enable displaying an arrow when the price reaches the trades level; Size of Arrow - size of the arrow; Alert Signal for deals - enable generating alerts when the price reaches the trades lev
Turbina
Evgeniy Zhdan
5 (4)
The axiom of the Forex market is that any trend will be broken. The Expert Advisor determines trend direction (the pink line), and calculates levels for opening opposite orders depending on the settings. The value of Away from the trend line for Deal will be different for each pair and timeframe, depending on the volatility of the trading instrument. Next orders can be opened with an increased lot (a static lot is used by default). See the screenshots to understand the idea of the Expert Advisor
Odysseus
Evgeniy Zhdan
The Expert Advisor determines the moments of strong movements and opens a position in the direction of the most probable price movement. The strategy always uses stop loss and take profit. Several independent orders can be in the market (the maximum number is set in parameters). The goal of the EA's underlying trading system is the quantitative excess of the number of profitable deals over the number of losing ones. Recommended: EURUSD 5m; GBPUSD 5m; USDJPY 5m. The Expert Advisor is able to work
Vise
Evgeniy Zhdan
Vise is a trend indicator. The upper and lower lines follow the price showing the prevailing price direction. Frequent breakthroughs of the upper line indicate a bullish trend, while frequent breakthroughs of the lower line indicate a bearish one. Parameters Points for UpLine - initial number of points for the upper line; Points for DownLine - initial number of points for the lower line. During the breakthrough of the upper level (line), this level shifts upwards by Points for UpLine. If the up
Twinkle
Evgeniy Zhdan
Twinkle is a trend-based scalper using stop loss and take profit invisible to the broker. The EA does not look for trend reversals. The EA catches strong market movements and opens orders in the direction of the trend. Your broker will not see the order closing levels. The EA closes orders independently when reaching the take profit or stop loss levels specified in the settings. Recommended trading symbols: EURUSD M5, GBPUSD M5. ECN accounts with 5 digits quotes are recommended. Expert Advisor
Shine
Evgeniy Zhdan
4.75 (4)
This Expert Advisor implements elements of the Martingale system. Orders are opened at a specified distance from the moving average. The Parabolic SAR indicator and certain technical details are used to ensure the most accurate entries. The EA is highly customizable. It is recommended for simultaneous use on 4 currency pairs: EURUSD M15; GBPUSD M15; USDJPY M15; USDCAD M15. Despite good stability, it is advisable to disable the EA operation during the days rich in news releases. Configurations P
LuckyCase
Evgeniy Zhdan
LuckyCase is an Expert Advisor with martingale elements. The EA strategy is based on a significant "deviation" of the price from SAR inadicator and the Bands levels breakthrough point. The money management system is an essential part of the EA. It starts working after a trade is opened. Trades are closed after accumulating specified points of market orders, by deposit % or after an opposite side of the channel is broken through. The default EA settings are meant for: EURUSD M15; USDJPY M15. The
Elize
Evgeniy Zhdan
The Elize Expert Advisor has been designed to work with the EURCHF currency pair. It considers the peculiarities of this trading instrument, its behavior and dependence on the behavior of other currencies. In particular, when the currencies of the European countries (EURUSD, GBPUSD, EURNOK, EURCHF) move in the same direction, the EA starts its operation and opens a deal in the trend direction of the European currencies. In the event of price rollbacks, the EA uses a unique method for making the
AllTrendLines
Evgeniy Zhdan
4 (1)
Brief Description of the All Trend Lines Indicator The indicator analyzes the wave structure of the market. What it displays on the chart: First. Wave pivots (semaphores) • Red markers – wave highs • Yellow markers – wave lows • Yellow-green markers – additional local extremes Second. Trend lines • Purple/blue lines – trends based on highs (resistance/support) • Beige/green lines – trends based on lows • Lines are built automatically by connecting wave pivots of the same type Third. Main trend
FastTraffic
Evgeniy Zhdan
The Expert Advisor has been specifically developed for trading gold (Spot Gold). The strategy is based on Fibo levels calculated from the previous (first) candle High/Low and the width of the current and lower timeframes channel. If important Fibo levels of different orders are located in a single price channel (within a spread), the EA defines this channel as the target for price movement and starts operation. Martingale and averaging are not used. Each order is independent and is accompanied b
Jazz
Evgeniy Zhdan
The algorithm of this Expert Advisor determines the significant price levels, where the trend often turns into a flat or reverses. Stochastic Oscillator serves as an additional filter of overbought/oversold zones. The EA sets stop loss and take profit after opening an order. The underlying trailing strategy applies a trailing stop. The EA is recommended for simultaneously use on three trading instruments: EURUSD M5, GBPUSD M5, EURCHF M5. Settings: Comment to order - comment to orders. MaxRisk -
Panther
Evgeniy Zhdan
The Expert Advisor looks for technical analysis patterns formed on the higher (hourly) timeframe to start working on the 5-minute chart. Technical analysis patterns used: double top/double bottom, head/shoulders, flag, expanding/narrowing triangles. The Relative Vigor Index technical indicator is used as the filter for opening deals. It is based on the idea that on the bull market the closing price is, as a rule, higher, than the opening price. It is the other way round on the bear market. This
Spook
Evgeniy Zhdan
The Expert Advisor calculates the divergence on the current and higher timeframes. In case the divergences coincide, the EA starts its operation. Deals have strict take profit and stop loss levels. Each deal is managed by trailing stop. The strategy involves the use of a tight stop-loss. Therefore, losing deals and/or series of losing deals are not uncommon. This EA is not suitable for those who have difficulties coping with losing deals. The EA is recommended for simultaneous use on the followi
Grand
Evgeniy Zhdan
The Expert Advisor has been developed specifically for the features of the CHFJPY currency pair. The EA's algorithm determines the direction of the current trend and starts operation. In case of a price reversal within the current trend, the EA adds additional orders. If trend changes, the EA starts to work in the direction contrary to the initial grid of orders. If there were no conditions for closing orders and the trend direction changed again, the EA continues to work with the "first" grid o
Intensive
Evgeniy Zhdan
The Expert Advisor algorithm determines on daily charts those candlestick patterns, which set the intraday trading direction. The trading EA determines how long the price is moving in overbought/oversold zones and starts working in the direction of the expected trend movement. Each position is accompanied with a tight stop loss and take profit. Only one active position can be open in the market. The EA was developed and tested using 99% quality quotes. The Expert Advisor has a built-in news filt
Slender
Evgeniy Zhdan
The strategy of this Expert Advisor is based on a hedging system, which implies placing opposite orders. The EA algorithm determines trend beginning and opens a position in the trend direction. In case of a wrong entry, the EA tries to neutralize the drawdown through opposite (hedging) orders at a preset interval (Coefficient of counter orders). Orders are closed when one of the two values ​​is reached - profit in percent or profit in points. The EA does not use lot increase. The EA wast tested
Dreamer
Evgeniy Zhdan
Советник работает по принципу хеджирования с периодическими "перекосами" в сторону трендовых направлений. Направления тренда советник определяет на основании стандартного индикатора Parabolic Stop and Reverse system (SAR). Уникальная стратегия установки балансирующих позиций позволяет избегать больших просадок даже при самых не благоприятных рыночных условиях. Параметры по умолчанию рекомендуется использовать на торговом инструменте: GBPJPY 15m. Разработка и оптимизация параметров производились
Snoot
Evgeniy Zhdan
5 (1)
This Expert Advisor works using a grid in the direction of a trend movement with the step between opened positions defined in the settings. The positions are closed by the total take profit. The Parabolic SAR standard indicator is used to filter order opening, which comes in the MetaTrader 4 package. The EA has been developed and tested using 99,9% quality of quotes. Operation of the EA in real time can be viewed in the signals . The best trading results have been achieved on CHFJPY M15. Settin
Solipsism
Evgeniy Zhdan
The Expert Advisor builds channels based on the data obtained using ATR and MA indicators according to the equations: Upper channel border = MA + ATR * (FIBO); Lower channel border = MA - ATR * (FIBO), where FIBO has the following values: Style of Trade - Aggressive = 1.61852; Style of Trade - Average = 3.26704; Style of Trade - Calm = 4.85556. Trades are opened inside the channel with the intervals defined in the settings. Long and short positions are opened independently. Positions are closed
The trading statistics indicator notifies the trader of the aggregate income of the trading account for different time intervals. The indicator has wide display settings on the graph. There is a choice of one of the two display languages on the chart- English and Russian. Settings Indicator language (ENG, RUS) - Select the language to display on the chart; To control the magic (-1: any magic) - Entering the Magic for control (-1: any Magic); Angle of indicator tie - Selecting the angle of the c
Filtro:
Sem comentários
Responder ao comentário