SMC Scanner
- Indicators
- Version: 1.0
- Activations: 10

SMC Scanner – User Guide
Overview
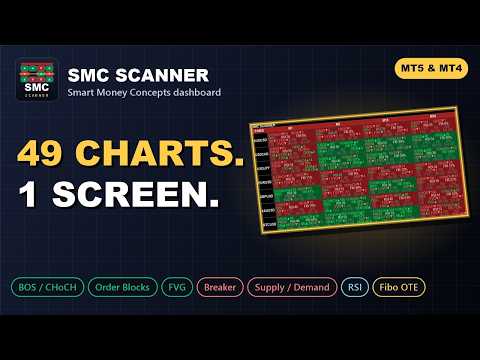
SMC Scanner is a multi-symbol, multi-timeframe dashboard for MetaTrader 5. Every cell shows the key Smart Money Concepts state of one symbol on one timeframe. You can scan the whole market at a glance instead of opening every chart.
The SMC engine inside the scanner uses the same calculation logic as the Smart Market Structure Concepts chart indicator. With the same settings, each cell shows what the chart indicator would show on that symbol and timeframe.
Installation
1. Install SMC_Scanner.ex5 from MQL5.
2. Restart MT5 or refresh the Navigator, then drag SMC_Scanner onto any chart.
3. Enter your symbols and timeframes in the inputs, then click OK.
Dashboard Layout
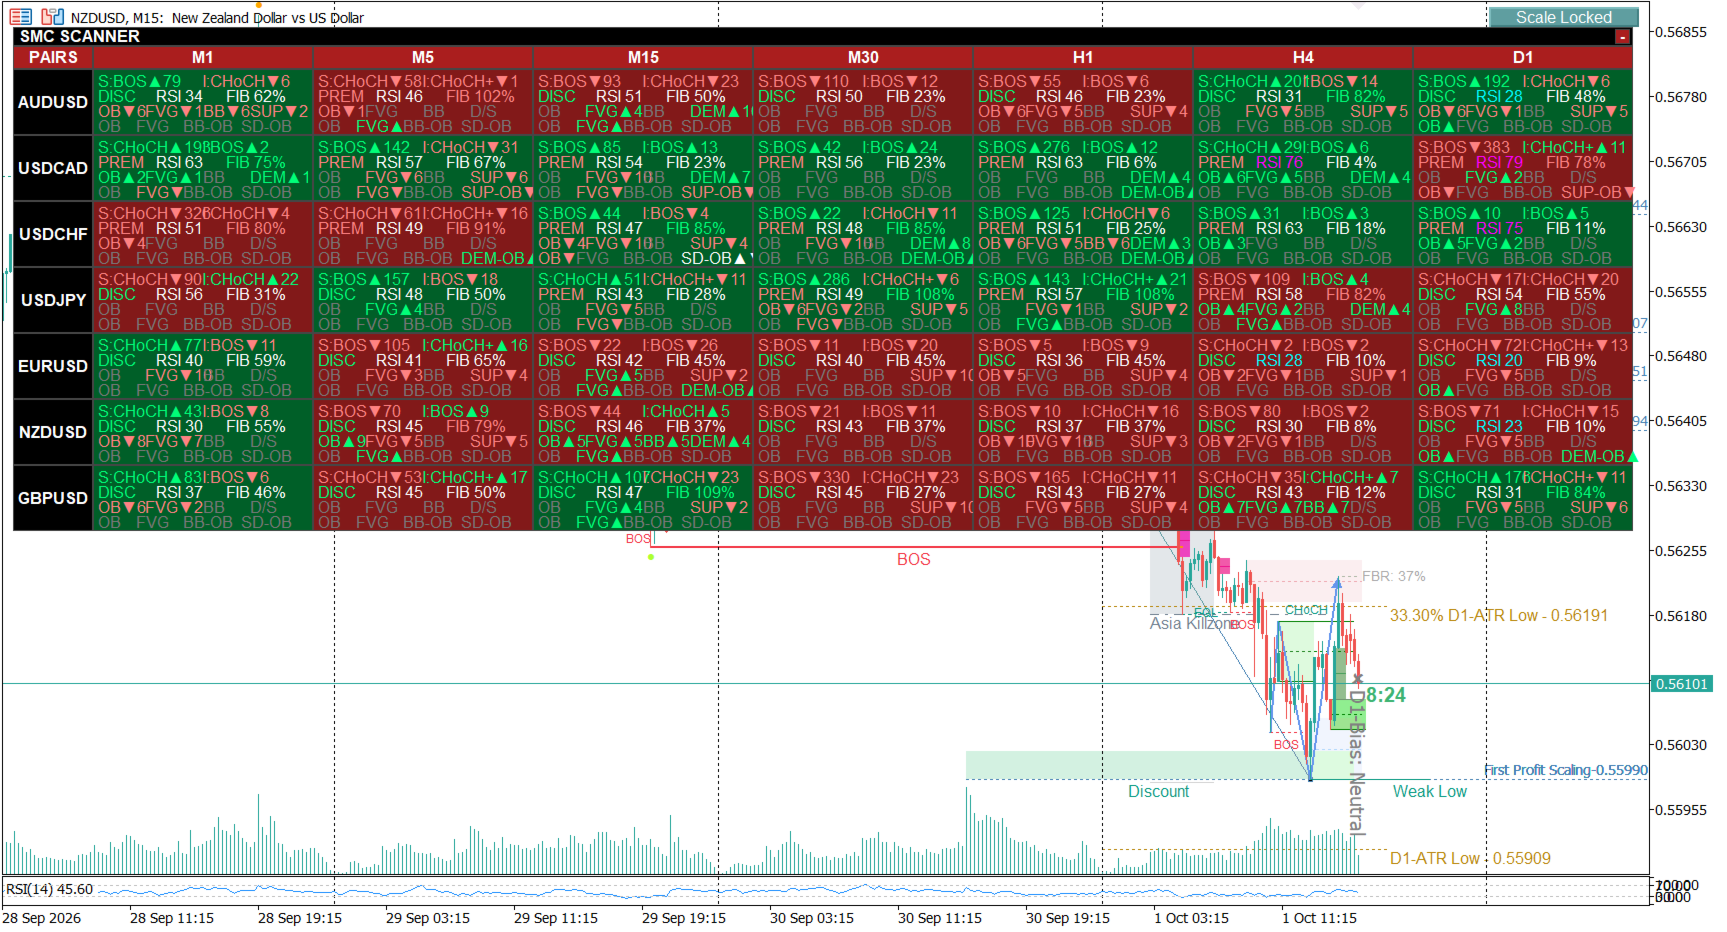
- Rows = symbols, Columns = timeframes.
- Cell background = market trend:
- 🟩 Green = bullish
- 🟥 Red = bearish
- ⬛ Black = neutral or mixed. With the default Swing structure source, black means no trend yet. With Both agree, black also means swing and internal structure disagree.
What Each Cell Shows
┌───────────────┬────────────────────────────────────────────────────────────────────────────┬────────────────────┐
│ Line │ Content │ Example │
├───────────────┼────────────────────────────────────────────────────────────────────────────┼────────────────────┤
│ 1 – Structure │ Last Swing (S) and Internal (I) break: BOS / CHoCH / CHoCH+, direction │ S:CHoCH+▲12 │
│ │ arrow, and bars since the break │ I:BOS▼3 │
├───────────────┼────────────────────────────────────────────────────────────────────────────┼────────────────────┤
│ 2 – Context │ Premium / Discount (PREM red, DISC green, EQ white) · RSI (period │ DISC RSI 65 │
│ │ adjustable, default 14) · Fibo-Re % retracement of the current leg │ FIB 72% │
├───────────────┼────────────────────────────────────────────────────────────────────────────┼────────────────────┤
│ 3 – Newly │ Order Block, FVG, Breaker Block and Demand/Supply OB formed within the │ OB▲3 FVG▼1 BB▲5 │
│ Formed │ last N bars, with arrow and bars ago │ DEM▲2 │
├───────────────┼────────────────────────────────────────────────────────────────────────────┼────────────────────┤
│ 4 – Price │ Price is currently inside an Order Block, FVG, Breaker Block OB or │ OB▲ FVG▼ BB-OB▲ │
│ Touched │ Demand/Supply OB. The token blinks while price is inside │ DEM-OB▲ │
└───────────────┴────────────────────────────────────────────────────────────────────────────┴────────────────────┘
Colors
- Bullish / long: green. Bearish / short: red. Inactive: grey.
- RSI: magenta = overbought, aqua = oversold.
- Fibo-Re: once the retracement reaches the OTE level (default 70.5%), it turns green for a long setup or red for a short setup and blinks.
Interaction
- Hover over a cell to see full details: trend, exact time of each signal, active zones, RSI and Fibo values.
- Click a cell to switch the current chart to that symbol and timeframe.
- Click a symbol name to switch the chart to that symbol and keep the current timeframe.
- – / + button (top-right of the title bar) collapses or expands the dashboard. The state is remembered for that chart.
Input Settings
Symbols & Timeframes
- Symbols Source: your own comma-separated list, or all symbols in Market Watch.
- Symbol Suffix: added to each list name for brokers that use suffixes (e.g. .m, pro).
- Timeframes: comma-separated, any of M1 … MN1 (e.g. M5,M15,H1,H4,D1).
- Bars To Calculate: history used per cell. Use the same value as Max bars back on the chart indicator.
SMC Settings / Fibonacci Retracement
Keep these identical to your chart indicator so both give the same results: structure lengths, algorithms, break types, OB break type, FVG threshold and fill type, BSL/SSL threshold, FBR type, OTE level.
Cell Content
Every item on lines 1–4 has its own on/off switch. A line disappears automatically when all of its items are off. You can also set:
- Trend source for the background: swing, internal, or both must agree.
- Order Blocks used: internal, swing, or both.
- Recent N bars window for "newly formed" items.
- Zone tolerance for "price touched", as a multiple of ATR200.
- Blinking: on or off.
- Optional second RSI, e.g. RSI(2).
Layout & Colors
Position, cell and column widths, font, and all colors. If a cell looks crowded, increase Cell Width or reduce Font Size.
Alerts
Each event has its own switch:
- Swing / Internal BOS & CHoCH
- Premium / Discount entry
- RSI overbought / oversold
- Fibo-Re reaching OTE
- OB / FVG / Breaker Block / Demand-Supply OB formed
- Price entering an OB / FVG / Breaker Block OB / Demand-Supply OB
Delivery: popup, push notification to MT5 mobile, and email.
- Alert Timeframes: limit alerts to selected timeframes, e.g. H1,H4.
- No alerts fire for history when the scanner loads. Each event alerts only once.
Notes
- Structure, OB, FVG and Breaker/S&D detection use closed bars. Zones, RSI and Fibo-Re update live every second.
- On first load, cells show loading... while MT5 downloads history for each symbol and timeframe. This normally takes a few seconds.
- N/A means the symbol name was not found. Check the spelling or the Symbol Suffix.
- Many symbols × many timeframes, especially including M1, increase CPU load. Use only the combinations you need.