GntRsiDvCator
- Indicators
- Version: 1.0

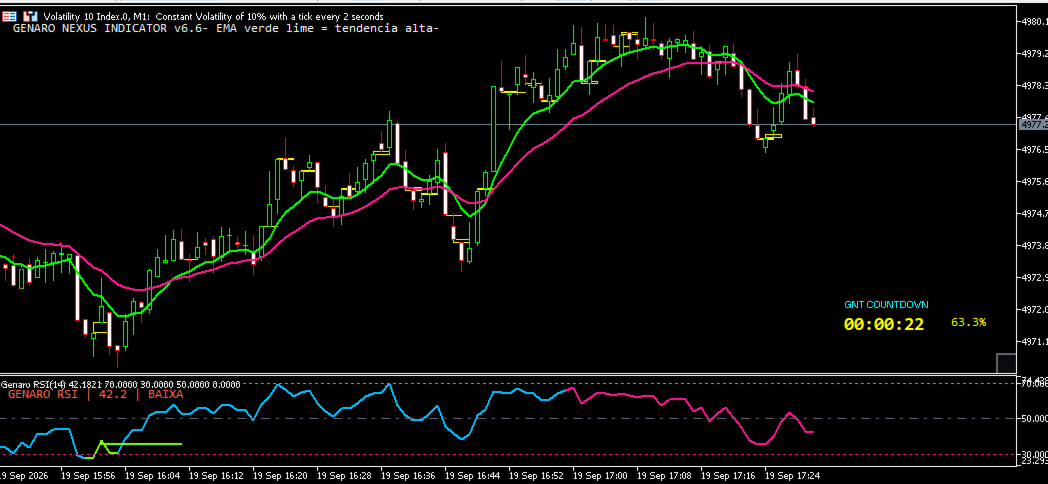
Genaro RSI is an advanced technical indicator that identifies divergences between price and RSI, automatically changing the oscillator line color for easy real-time chart reading. When a bullish divergence is detected (price makes a lower low, RSI makes a higher low), the RSI line turns green. When a bearish divergence is detected (price makes a higher high, RSI makes a lower high), the line turns pink. Under normal conditions, the line remains blue. The indicator performs a full historical scan on initialization, identifying all divergences from the start of the chart, and continues monitoring new divergences on each new bar.
Divergences are marked with lines connecting corresponding pivots, and arrows indicate the exact signal point. An information panel displays the current RSI status (UP, DOWN, OVERBOUGHT, OVERSOLD, BULLISH DIVERGENCE, BEARISH DIVERGENCE) with dynamic colors. Audio alerts, popup alerts, and push notifications can be enabled for both divergences and 70/30 level crosses. The indicator works on any symbol and timeframe available in MetaTrader 5.
HOW TO USE
-
Attach Genaro RSI to the chart of the desired symbol.
-
The RSI line will automatically change color according to detected divergences.
-
Green lines connect lows (bullish divergence / buy signal).
-
Pink lines connect highs (bearish divergence / sell signal).
-
Yellow arrows mark the signal point of the most recent divergence.
-
The panel in the upper left corner displays the current status.
-
Press the R key on the chart to clear all markings and force a new historical scan.
INPUT PARAMETERS
RSI Period: number of bars for RSI calculation (default 14).
Applied Price: price used in calculation (default Close).
Overbought: overbought level (default 70).
Oversold: oversold level (default 30).
Midline: middle line (default 50).
RSI Normal Color: line color without divergence (default pool blue).
RSI Div Bull Color: line color on bullish divergence (default neon green).
RSI Div Bear Color: line color on bearish divergence (default neon pink).
Overbought Color: overbought level color.
Oversold Color: oversold level color.
Midline Color: middle line color.
Show Divergences: enable or disable divergence detection.
Div Lookback: side bars to validate swing high/low (default 5).
Div Min Diff: minimum RSI difference between swings (default 2.0).
Div Max Bars: maximum bar distance between swings (default 50).
Draw Div Lines: draw lines connecting pivots (default true).
Alert on Divergence: audio alert on divergence detection (default true).
Push on Divergence: push notification on divergence detection (default false).
Alert on Cross: alert on 70/30 level cross (default false).
Show Info Panel: display info panel on chart (default true).
Font Size: panel font size (default 9).
MASTERING COLORS AND PARAMETERS
To customize the indicator to your style, adjust the parameters according to your strategy:
Colors: access the Colors tab in the indicator properties (or the RSI Normal Color, RSI Div Bull Color, RSI Div Bear Color inputs) and choose the colors that best stand out in your template. We recommend keeping the default green for bullish and pink for bearish, as it is the most intuitive visual standard in the market. If you prefer a white background, use dark colors such as navy blue, dark green, and wine.
Divergence sensitivity: the Div Lookback parameter defines how many side bars validate a swing high or low. Low values (2-3) generate more signals, ideal for scalping and lower timeframes (M1, M5). High values (5-10) generate fewer and more reliable signals, ideal for swing trading and higher timeframes (H1, H4, D1).
Noise filter: the Div Min Diff parameter defines the minimum RSI difference between two swings to validate the divergence. Low values (0.5-1.5) capture subtle divergences. High values (3.0-5.0) filter weak divergences and keep only the most relevant.
Detection range: the Div Max Bars parameter defines the maximum bar distance between the two swings forming the divergence. Low values (20-30) capture only recent and close divergences. High values (50-100) capture older and more distant divergences.
RSI period: adjust according to the symbol and timeframe. The default 14 is the most used, but smaller periods (7-9) react faster, and larger periods (21-28) are smoother and filter noise better.
Alerts: enable Alert on Divergence to receive audio and popup warnings when a divergence is detected. Enable Push on Divergence to receive mobile notifications via MetaTrader 5. Enable Alert on Cross to be notified when RSI crosses the 70 or 30 levels.
Panel: enable Show Info Panel to view the current RSI status in the upper left corner of the chart. Adjust Font Size according to your reading preference.
USAGE TIPS
Divergences are signals of possible reversal, but should not be used in isolation. Confirm with price action, support and resistance, candlestick patterns, or other indicators.
In strong trends, divergences may appear multiple times without immediate reversal. Use risk management and stops.
Combine Genaro RSI with moving averages, Bollinger Bands, or Fibonacci to increase the hit rate.
Test different parameter combinations in the Strategy Tester before trading on a live account.
COMPATIBILITY
Genaro RSI works on any symbol available in MetaTrader 5: forex, indices, stocks, cryptocurrencies, commodities, and futures. It works on all timeframes, from M1 to MN. It works on demo and live accounts, from any broker.
SUPPORT
For questions, suggestions, or issues, contact us through the Comments tab of the product on MQL5 Market. Our team responds within 24 business hours.
ABOUT THE GENARO TRADE TEAM
The Genaro Trade Team develops indicators and tools for traders seeking clarity, precision, and visual identity in their charts. Our products are created with a focus on usability, performance, and integration with the MetaTrader 5 platform. Genaro RSI is part of a line of products that combines technology, neon design, and professional functionality.
Good hunting, Commander.
Genaro Trade Team