Trend Detection Indicator

  • Indicatori
  • Elham Afsharpour
    Elham Afsharpour
    Sono uno sviluppatore esperto di software per il trading, con 8 anni di esperienza nella programmazione, in particolare in Python, C++ e MQL5. Negli ultimi 2 anni mi sono concentrato principalmente sullo sviluppo di Expert Advisor, indicatori personalizzati, strumenti di trading e sistemi di
  • Versione: 1.1
  • Aggiornato: 27 giugno 2026
  • Attivazioni: 5

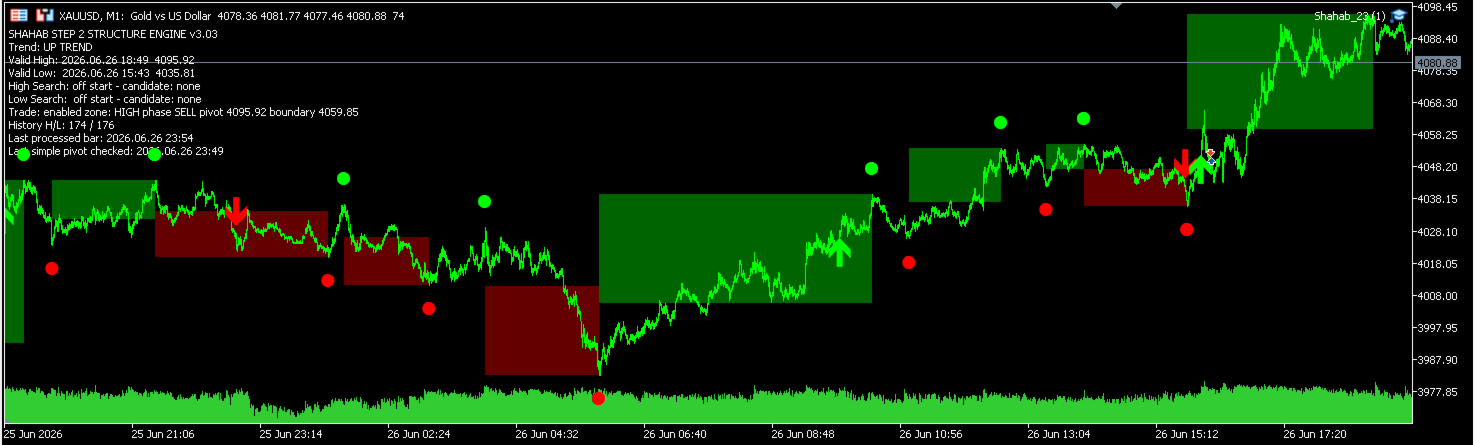
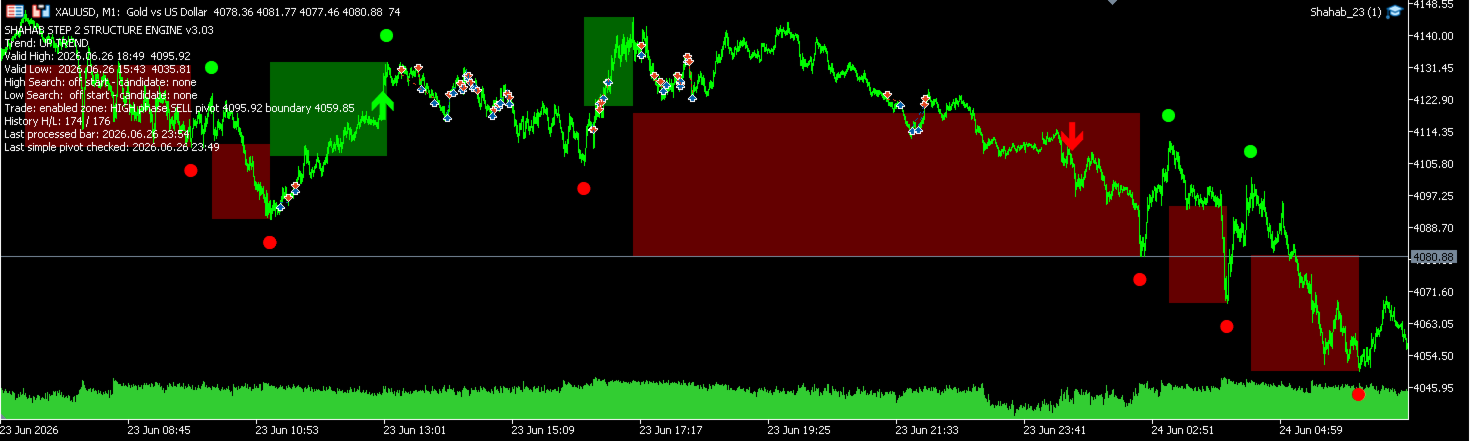
Un indicatore pulito per MT5 per il rilevamento della tendenza basato sulla struttura del mercato, con frecce visive di tendenza, marcatori di pivot validi e aree strutturali opzionali.

STS Structure Trend Detector è un indicatore pulito per MetaTrader 5, progettato per rilevare la direzione della tendenza del mercato in base alla struttura del prezzo.

STS Structure Trend Detector è pensato per i trader che desiderano uno strumento visivo semplice per seguire la struttura attuale del mercato direttamente sul grafico. L’indicatore analizza massimi e minimi validi, rileva cambiamenti strutturali della tendenza e mostra il risultato tramite frecce chiare, marcatori di pivot e zone strutturali opzionali.

Questo non è un Expert Advisor e non apre, chiude né gestisce operazioni. È solo un indicatore visivo della struttura del mercato. Può essere utilizzato come strumento aggiuntivo di conferma per il trading discrezionale, l’analisi manuale o come parte della strategia personale del trader.

Caratteristiche principali

Rilevamento della tendenza basato sulla struttura del mercato

Frecce visive per tendenza rialzista e ribassista

Marcatori di massimo valido e minimo valido sul grafico

Aree opzionali di struttura del prezzo tra pivot validi

Visualizzazione opzionale dei pivot semplici per un’analisi più approfondita

Visualizzazione pulita nella finestra principale del grafico

Nessuna logica di trading

Nessun ordine, nessuna gestione delle posizioni, nessuna gestione del capitale

Adatto all’analisi manuale del mercato

Come può aiutare

L’indicatore aiuta i trader a identificare la direzione attuale del mercato in base al comportamento della struttura del prezzo. Invece di mostrare molti segnali inutili, si concentra sui punti importanti di svolta del mercato e sui cambiamenti di tendenza. Questo rende il grafico più pulito e più facile da leggere.

Può essere utilizzato per:

Confermare la direzione della tendenza

Analizzare la struttura del mercato

Filtrare gli ingressi manuali

Controllare la direzione su timeframe superiori

Analizzare la struttura di supporto e resistenza

Studiare visivamente massimi e minimi validi

Requisiti

Questo indicatore è stato creato per MetaTrader 5.

Prima di utilizzare l’indicatore, l’utente deve impostare correttamente i punti strutturali iniziali. L’indicatore richiede l’orario della candela del massimo valido iniziale e l’orario della candela del minimo valido iniziale. Questi due punti vengono utilizzati come riferimento strutturale iniziale sul grafico.

Per ottenere i migliori risultati:

Utilizzare l’indicatore su un grafico con uno storico sufficiente caricato

Impostare con attenzione l’orario della candela del massimo e del minimo iniziale

Scegliere correttamente la direzione iniziale della tendenza

Utilizzare un simbolo e un timeframe adatti al proprio metodo di trading

Testare le impostazioni su un grafico demo prima di usarlo nell’analisi reale

Struttura dell’indicatore

L’indicatore è organizzato in diverse sezioni pulite di parametri di input:

Struttura iniziale

Questa sezione definisce i primi punti strutturali validi utilizzati dall’indicatore.

Parametri principali:

Orario della candela del massimo valido iniziale

Orario della candela del minimo valido iniziale

Direzione iniziale della tendenza

Opzione di aggancio alla barra più vicina

Distanza massima di aggancio in minuti

Logica della struttura

Questa sezione controlla il comportamento generale della conferma della struttura.

Parametri principali:

Barre laterali per pivot semplice

Tolleranza per massimi e minimi uguali

Modalità di conferma della rottura

Buffer di rottura

Elaborazione dello storico all’avvio

Reimpostazione della ricerca opposta dopo la conferma di un pivot valido

Frecce di tendenza

Questa sezione controlla come vengono mostrate sul grafico le frecce di cambio tendenza.

Parametri principali:

Mostrare o nascondere le frecce di tendenza

Distanza della freccia dalla candela

Stile della freccia di tendenza rialzista

Stile della freccia di tendenza ribassista

Dimensione della freccia

Colore della tendenza rialzista

Colore della tendenza ribassista

Marcatori di pivot validi

Questa sezione controlla la visualizzazione dei massimi e minimi validi confermati.

Parametro principale:

Mostrare o nascondere i marcatori di pivot validi

Visualizzazione dei pivot semplici

Questa sezione è destinata principalmente agli utenti che desiderano studiare visivamente la struttura interna dei pivot semplici.

Parametro principale:

Mostrare o nascondere i marcatori di pivot semplici

Aree di pivot validi

Questa sezione controlla le zone strutturali opzionali disegnate tra aree importanti di pivot.

Parametri principali:

Mostrare o nascondere le aree di pivot validi

Percentuale dell’area

Colore dell’area dei massimi

Colore dell’area dei minimi

Trasparenza del rettangolo

Disegnare i rettangoli sullo sfondo

Impostazioni generali

Questa sezione contiene le impostazioni generali di visualizzazione e degli oggetti del grafico.

Parametri principali:

Cancellare i vecchi oggetti all’inizializzazione

Eliminare gli oggetti alla deinizializzazione

Note importanti

STS Structure Trend Detector è uno strumento di analisi, non un robot di trading. Non garantisce risultati di trading e non sostituisce la gestione del rischio né il giudizio personale del trader. L’indicatore è pensato per aiutare i trader a leggere la struttura del mercato con maggiore chiarezza e a prendere decisioni manuali più consapevoli.

Testare sempre l’indicatore su un conto demo o su un grafico storico prima di utilizzarlo in condizioni di trading reali.


Prodotti consigliati
MetaHelper
Volodymyr Tseibei
This indicator automatically calculates and displays classic pivot points on your chart, helping identify key support and resistance levels for the current trading session. Features: · Plots Pivot (PP), Resistance 1-2 (R1, R2), and Support 1-2 (S1, S2) levels · Includes current close price line for reference · Color-coded lines: Blue for pivot, Red for resistances, Green for supports · Automatic calculation based on previous day's high, low, and close · Continuous lines across the chart for e
Dual Bollinger Session Channel
Danton Dos Santos Sardinha Junior
Dual Bollinger Session Channel Canali Bollinger a Sessione Fissa Professionali per MetaTrader 5 Progettato per l’analisi del price action, dei breakout e della struttura di mercato istituzionale utilizzando dati reali delle sessioni. Panoramica del Prodotto Il Dual Bollinger Session Channel è un indicatore tecnico professionale per MetaTrader 5 che costruisce canali statistici fissi basati su due calcoli indipendenti delle Bande di Bollinger derivati esclusivamente dalla precedente sessione re
CRT Candle Range Theory HTF MT5.   Ultimate CRT Indicator: Advanced ICT Concepts and Malaysian SnR Trading System Master the Market Maker's Footprints with the Most Advanced Candle Range Theory Indicator Discounted   Price $50  !!     Secure your lifetime access now before it switches to subscription-only ! Unlock the true power of Smart Money Concepts (SMC) and trade precisely like the institutions with the Ultimate CRT Indicator . Built exclusively for serious traders, this indicator automate
Gold Trader Pro is an advanced analytical tool specifically engineered for professional trading on XAUUSD (Gold). It provides an immediate comprehensive overview of market structure across 7 different timeframes, allowing traders to identify flow direction and signal strength through a modern, draggable, and interactive interface. Key Features Multi-Timeframe Analysis: Real-time monitoring of M1, M5, M15, M30, H1, H4, and D1. Two Operational Modes: MODE_SCALPING: Optimized for fast-paced analys
FREE
Heiken Ashi Supertrend Combine
Tri Yasin Satrio Adji Pranoto
Headline: Stop Guessing, Start Winning. Unleash the Power of the Heiken Ashi Supertrend Indicator. Body: Are you tired of market noise, confusing charts, and missed opportunities? The Heiken Ashi Supertrend Indicator is the ultimate tool designed to bring clarity and confidence to your trading, once and for all. We've combined two of the most powerful concepts in technical analysis into one seamless, easy-to-use indicator: Crystal-Clear Trends with Heiken Ashi: Say goodbye to choppy price action
Fractal Levels based on Higher Timeframe è un potente strumento progettato per costruire accurati livelli di supporto e resistenza basati sui frattali del timeframe superiore, che fornisce segnali di acquisto e vendita con comodi avvisi. Come funziona: l'indicatore analizza i livelli frattali sul timeframe superiore e li visualizza sul grafico corrente. È possibile regolare facilmente il timeframe superiore nelle proprietà dell'indicatore per ottenere la massima precisione e rilevanza per le p
Pivot Points MT5 is a universal color multicurrency/multisymbol indicator of the Pivot Points levels systems. You can select one of its three versions: Standard Old, Standard New and Fibo . It plots pivot levels for financial instruments in a separate window . The system will automatically calculate the Pivot Point on the basis of market data for the previous day ( PERIOD_D1 ) and the system of support and resistance levels, three in each. A user can choose colors for the indicator lines. The on
Market Structure Fractals The structure layer MetaTrader 5 was missing Most traders stare at candles and draw structure manually — imprecisely, inconsistently, and always too late. You know what a fractal high and low look like. The question is whether you can spot every one, mark it cleanly, and track it the moment price breaks through. You can't. Market Structure Fractals can. MetaTrader 5 shows you price. It doesn't show you structure. That gap — between a candle pattern and a confirmed bre
FREE
MySNR - Precision Support & Resistance Line Indicator Discounted   Price   $35  !!     Secure your lifetime access   now   before it switches to   subscription-only ! Tired of drawing levels manually or guessing where the price will react inside a thick, messy zone? Now you can save time and trade with absolute confidence using the MySNR Indicator . Unlike traditional tools that plot broad and ambiguous zones, MySNR is engineered to automatically plot exact, pinpoint Support and Resistance lines
Rilevatore intelligente multistrato di breakout e pullback per MetaTrader 5 "Intelligente. Semplice. Veloce!" Sei stanco di perdere entrate su breakout ad alta probabilità? Passi ore a scansionare più grafici, cercando di allineare i breakout con la direzione del trend e il momentum delle valute — solo per perdere il movimento? Break Pullback risolve tutto questo con un solo indicatore. Cos'è Break Pullback? Break Pullback è un indicatore MetaTrader 5 di livello professionale, progettato speci
Order Block Box
Usiola Oluwadamilol Olagundoye
5 (3)
Next Arrival : Flip or Die Trading Arena. Flip a trading account:  https://flipordie.com/chapter-1-thirteen-doublings-double-a-trading-account/ The Advanced Order Block Indicator for MetaTrader 5 is designed to enhance technical analysis by identifying significant order blocks that sweep liquidity and create Fair Value Gaps (FVG) when pushing away. This indicator is ideal for traders who focus on institutional trading concepts and wish to incorporate advanced order flow and price action strategi
FREE
PREngulfing
Slobodan Manovski
PR EA - Engulfing Pattern Trading System Automated Engulfing Pattern Detection with MA Confirmation The PR EA is a Meta Trader 5 expert advisor that identifies and trades bullish/bearish engulfing candlestick patterns when confirmed by a moving average filter. Designed for swing trading on 30-minute charts with compatibility for M15 and H1 time frames. Key Features: Pattern Recognition - Detects valid bullish/bearish engulfing candle formations Trend Confirmation - 238-period SMA filter
All Harmonics 26
Alexey Isavnin
3.5 (4)
Harmonic patterns are characteristic series of price movements with respect to Fibonacci levels, which statistically precede price reversals. This indicator searches for harmonic patterns. It is capable of recognising 26 classical and non-classical harmonic patterns : Classical Gartley Butterfly Alternate Butterfly Bat Alternate Bat Crab Deep Crab Three Drives Non-classical Shark Alternate Shark Cypher 5-0 Anti Gartley Anti Butterfly Anti Alternate Butterfly Anti Bat Anti Alternate Bat Anti Crab
Indicatore Balance of Power (BOP) con supporto multi-timeframe, segnali visivi personalizzabili e sistema di avvisi configurabile. I servizi di programmazione freelance, gli aggiornamenti e altri prodotti TrueTL sono disponibili nel mio profilo MQL5 . Feedback e recensioni sono molto apprezzati! Cos'è il BOP? Balance of Power (BOP) è un oscillatore che misura la forza degli acquirenti rispetto ai venditori confrontando la variazione del prezzo con il range della candela. L'indicatore viene ca
FREE
Zone Structure Scanner Panel for MT5 Find better setups faster — without scanning charts for hours. The Zone Structure Scanner Panel for MT5 helps you automatically scan multiple symbols, detect key weekly and daily support/resistance zones, read market structure, highlight confluence, and flag H4 rejection-confirmed setups from one powerful panel. Instead of jumping from chart to chart, you get ranked opportunities in one place so you can focus on the setups that matter most. Why it stands
Introduction to EFW Analytics EFW Analytics was designed to accomplish the statement "We trade because there are regularities in the financial market". EFW Analytics is a set of tools designed to maximize your trading performance by capturing the repeating fractal geometry, known as the fifth regularity in the financial market. The functionality of EFW Analytics consists of three parts. Firstly, Equilibrium Fractal Wave Index is an exploratory tool to support your trading logic to choose which r
Kst pro tools
Vincent Albert Feugier
KST Pro Tools: Advanced Momentum Indicator KST Pro Tools is an advanced implementation of the famous Know Sure Thing (KST) indicator by Martin Pring. Designed for traders seeking an objective reading of momentum, this tool filters out market noise to highlight only the phases of directional acceleration. Through an intelligent filtering logic, KST Pro Tools allows you to quickly identify dominant trends and distinguish strong momentum phases from periods of market neutrality. Key Features Optimi
The indicator is designed to work on any trading platform. The program is based on proprietary algorithms and W.D.Ganna's mathematics, allowing you to calculate target levels of price movement based on three points with the highest degree of certainty. It is a great tool for stock trading. The indicator has three buttons: NEW - call up a triangle for calculation. DEL - delete the selected triangle. DELS - completely remove all constructions. The probability of achieving the goals is more than 80
CRT Fibo OTE Scanner MT5 is a multi-symbol CRT scanning and chart-visualization tool for MetaTrader 5. It detects active CRT-style setups, draws CRTH/CRTL zones, supports OTE entry Fibonacci and custom target Fibonacci layers, and provides optional context filters such as pivot BOS, PDH/PDL, weekly high/low, Asian sweep, killzone timing, HTF bias, displacement and FVG confirmation. This product is a chart utility and scanner. It does not open, modify, or close trades automatically. Full Product
The Expert Advisor and the video are attached in the Discussion tab . The robot applies only one order and strictly follows the signals to evaluate the indicator efficiency. Pan PrizMA CD Phase is an option based on the Pan PrizMA indicator. Details (in Russian). Averaging by a quadric-quartic polynomial increases the smoothness of lines, adds momentum and rhythm. Extrapolation by the sinusoid function near a constant allows adjusting the delay or lead of signals. The value of the phase - wave s
Created by imjesstwoone and mickey1984, this trade model attempts to capture the expansion from the 10:00-14:00 EST 4h candle using just 3 simple steps. All of the information presented in this description has been outlined by its creators, all I did was translate it to MQL5. All core settings of the trade model may be edited so that users can test several variations, however this description will cover its default, intended behavior using NQ 5m as an example. Step 1 is to identify our Price Ra
Overview The Market Perspective Structure Indicator is a comprehensive MetaTrader indicator designed to provide traders with a detailed analysis of market structure across multiple timeframes. It identifies and visualizes key price action elements, including swing highs and lows, Break of Structure (BOS), Change of Character (CHOCH), internal structures, equal highs/lows, premium/discount levels, previous levels from higher timeframes, and trading session zones. With extensive customization opt
Smart Trendlines MT5
Suvashish Halder
5 (3)
Smart Trendlines – No.1 Trendlines Indicator Smart Trendlines is a precision tool that automatically draws trendlines based on every valid pivot point, helping traders identify key support and resistance zones. It continuously adjusts as new market pivots form, providing a live and accurate reflection of price structure. Whether you’re tracking trends, preparing for reversals, or anticipating breakouts — this indicator keeps you one step ahead. It works seamlessly across all assets including For
Based on the trading model/strategy/system of gold double-position hedging and arbitrage launched by Goodtrade Brokers, problems encountered in daily operations: 1. Account B immediately places an order immediately following account A. 2: After account A places an order, account B will automatically copy the stop loss and take profit. 3: Account A closes the position of Account B and closes the position at the same time. 4: When account B closes the position, account A also closes the position.
Support & Resistance Auto Plot Lines Indicator for MT5 – Perfect for Scalping! Make your trading easier with our Support & Resistance Auto Plot Lines indicator for MT5. This powerful tool automatically detects key support and resistance levels on your chart, helping you make better trading decisions with minimal effort. Why Choose This Indicator? Perfect for Scalping – Quickly identify strong price zones for fast, precise entries and exits. Automatic Level Detection – No need to manually dra
Pivot Math Support and Resistance Lines indicator — indicator showing pivot lines, which will definitely help every trader who knows how to trade with resistance, support and pivot lines. It shows 8 different lines (additional lines are also possible) on the main chart, helping you find the best points to buy, sell and exit positions.  Input parameters: P (default = 64) — period in bars or other periods (set using MMPeriod), on which the lines will be calculated. The smaller this number, the "f
MT5 Support and Resistance Indicator Automatic Drawing of Multiple Supports and Resistances with levels.  Supports As follow 1.       Weak Support 2.       Untested Support 3.       Verified Support 4.       Proven Support 5.       Turncoat Support Resistances As follow 1.       Weak Resistance 2.       Untested Resistance 3.       Verified Resistance 4.       Proven Resistance 5.       Turncoat Resistance Best Strategy to use 1.       Identify Trend Direction on Daily Time Frame, Example Gold =
RAD CRITICAL LEVES RAD indicator tracks “Relevant Volume” in real time, identifying accumulation and distribution processes, projecting them in the chart as SUPPORT or RESISTANCE zones. Natural   support   and resistance levels are generated by Volume Accumulation and Distribution processes. As these processes evolve, levels at which the relevant volume in the market place is positioned, become difficult areas to cross upwards or downwards. By using this information, traders can identify very s
MercariaPattern1-2-3 відстежує рух ціни, знаходить трьоххвильові структури 1-2-3 та підсвічує момент, коли сценарій підтверджується пробоєм ключового рівня. MercariaPattern1-2-3 tracks price movement, detects three-leg 1-2-3 structures and highlights the moment when the scenario is confirmed by a key level breakout. Індикатор збирає локальні свінги в компактну фігуру 0–1–2–3 , чекає підтвердженого пробою та будує стрілку входу з готовими рівнями SL/TP. The indicator combines local swings into a
Indicatore Average True Range (ATR) con supporto multi-timeframe, segnali visivi personalizzabili e sistema di alert configurabile. Servizi di programmazione freelance, aggiornamenti e altri prodotti TrueTL sono disponibili sul mio profilo MQL5 . Feedback e recensioni sono molto apprezzati! Cos'è l'ATR? L'Average True Range (ATR), sviluppato da J. Welles Wilder, è un indicatore tecnico che misura la volatilità del mercato. Calcola la media del True Range su un periodo specificato. Il True Ran
FREE
Gli utenti di questo prodotto hanno anche acquistato
ARIPoint
Temirlan Kdyrkhan
1 (1)
ARIPoint is a powerful trading companion designed to generate high-probability entry signals with dynamic TP/SL/DP levels based on volatility. Built-in performance tracking shows win/loss stats, PP1/PP2 hits, and success rates all updated live. Key Features: Buy/Sell signals with adaptive volatility bands Real-time TP/SL/DP levels based on ATR Built-in MA Filter with optional ATR/StdDev volatility Performance stats panel (Success, Profit/Loss, PP1/PP2) Alerts via popup, sound, push, or email Cu
PrimeScalping
Temirlan Kdyrkhan
PrimeScalping is a powerful trading companion designed to generate high-probability entry signals with dynamic TP/SL/DP levels based on volatility. Built-in performance tracking shows win/loss stats, PP1/PP2 hits, and success rates — all updated live. Key Features: Buy/Sell signals with adaptive volatility bands Real-time TP/SL/DP levels based on ATR Built-in MA Filter with optional ATR/StdDev volatility Performance stats panel (Success, Profit/Loss, PP1/PP2) Alerts via popup, sound, push, or e
OmniSync Projection
Antonio-alin Teculescu
5 (1)
Chronos Fractal Engine is an innovative price projection indicator for MetaTrader 5, designed to transform your technical analysis by intelligently identifying and projecting historical price patterns. Built upon an advanced correlation algorithm and the fractal principles of the market, this powerful tool visualizes potential future price movements, giving you a unique edge in your trading decisions. What is Chronos Fractal Engine? At its core, the Chronos Fractal Engine employs a sophisticat
SmartScalping
Temirlan Kdyrkhan
SmartScalping is a powerful trading companion designed to generate high-probability entry signals with dynamic TP/SL/DP levels based on volatility. Built-in performance tracking shows win/loss stats, PP1/PP2 hits, and success rates — all updated live. Key Features: Buy/Sell signals with adaptive volatility bands Real-time TP/SL/DP levels based on ATR Built-in MA Filter with optional ATR/StdDev volatility Performance stats panel (Success, Profit/Loss, PP1/PP2) Alerts via popup, sound, push, or e
ScalpPoint
Temirlan Kdyrkhan
ScalpPoint is a powerful trading companion designed to generate high-probability entry signals with dynamic TP/SL/DP levels based on volatility. Built-in performance tracking shows win/loss stats, PP1/PP2 hits, and success rates — all updated live. Key Features: Buy/Sell signals with adaptive volatility bands Real-time TP/SL/DP levels based on ATR Built-in MA Filter with optional ATR/StdDev volatility Performance stats panel (Success, Profit/Loss, PP1/PP2) Alerts via popup, sound, push, or emai
TrendProMaster
Temirlan Kdyrkhan
MasterTrend Indicator for MT5 A powerful trend-following and signal-evaluation tool MasterTrend   is a custom MT5 indicator that combines Moving Averages and ATR-based risk/reward logic to generate clear buy/sell signals. It visualizes dynamic SL/TP levels, evaluates past trade outcomes, and displays win/loss statistics in a clean on-chart panel. Key features include: Buy/Sell signals based on MA crossovers ATR-based SL/TP1/TP2/TP3 levels with visual lines and labels Signal outcome tracking wit
MasterTrend
Temirlan Kdyrkhan
MasterTrend Indicator for MT5 A powerful trend-following and signal-evaluation tool MasterTrend   is a custom MT5 indicator that combines Moving Averages and ATR-based risk/reward logic to generate clear buy/sell signals. It visualizes dynamic SL/TP levels, evaluates past trade outcomes, and displays win/loss statistics in a clean on-chart panel. Key features include: Buy/Sell signals based on MA crossovers ATR-based SL/TP1/TP2/TP3 levels with visual lines and labels Signal outcome tracking wit
ZIVA Signal Intelligence
Hassan Abdullah Hassan Al Balushi
ZIVA Signal Intelligence An Adaptive, Modular Market Intelligence System ZIVA Signal Intelligence is not positioned as a conventional trading indicator. It is a fully integrated, proprietary market intelligence system engineered to deliver structured, high-precision interpretation of price behavior within a controlled analytical environment. Developed through an independent architectural approach, ZIVA does not rely on, derive from, or replicate existing indicators. It represents a standalone
ARICoins
Temirlan Kdyrkhan
ARICoin is a powerful trading companion designed to generate high-probability entry signals with dynamic TP/SL/DP levels based on volatility. Built-in performance tracking shows win/loss stats, PP1/PP2 hits, and success rates all updated live. Key Features: Buy/Sell signals with adaptive volatility bands Real-time TP/SL/DP levels based on ATR Built-in MA Filter with optional ATR/StdDev volatility Performance stats panel (Success, Profit/Loss, PP1/PP2) Alerts via popup, sound, push, or email Cust
Aiuta a determinare se questo punto è adatto per acquistare. Aiuta a determinare se questo punto è adatto per vendere. Quando tutti e quattro gli indicatori raggiungono contemporaneamente il fondo, occorre concentrarsi sulle opportunità di rimbalzo. Quando tutti e quattro gli indicatori si trovano contemporaneamente nella parte alta, occorre concentrarsi sulle opportunità di ribasso. Questo sistema è costruito sulla base di avanzate tecnologie algoritmiche cinesi e di una struttura di modellazio
Il livello Premium è un indicatore unico con una precisione superiore all'80% delle previsioni corrette! Questo indicatore è stato testato dai migliori Specialisti di Trading per più di due mesi! L'indicatore dell'autore che non troverai da nessun'altra parte! Dagli screenshot puoi vedere di persona la precisione di questo strumento! 1 è ottimo per il trading di opzioni binarie con un tempo di scadenza di 1 candela. 2 funziona su tutte le coppie di valute, azioni, materie prime, criptovalu
Triple Crox Strategy v4.10 Triple Crox Strategy v4.10 Professional MetaTrader 5 Indicator 13 Patterns • Fibonacci • CLUSTER ML • Multi-Filter 1. Overview Advanced MT5 indicator combining 13 Pattern Detection , Fibonacci Analysis , CLUSTER Machine Learning and Multi-Filter system for precise signals on Forex, indices, commodities, crypto. 5-step pipeline: indicators → filter → patterns → signals → levels. 2. Trading Setup Heikin-Ashi colored bars. Buy/Sell arrows with Entry, TP1(1x ATR), TP2(2x
Gold Xausd Hunter
Metin Erkamoglu
5 (1)
MATADOR GOLD XAUUSD M5 Scalp Signals for MT5 MATADOR GOLD is a decision-support indicator for MetaTrader 5, designed for traders who analyze short-term Gold movement on the M5 timeframe. The indicator does not open, close, or manage trades automatically. It provides buy and sell signal guidance so the user can make their own trading decisions according to their risk plan, broker conditions, and trade management rules. Main purpose MATADOR GOLD is built to help traders avoid noisy signal flow and
Big Player Range
Thalles Nascimento De Carvalho
5 (3)
BigPlayerRange – Il miglior indicatore per MT5 BigPlayerRange è considerato il miglior indicatore per Mini Indice e Mini Dollaro su MetaTrader 5. Questo strumento essenziale evidenzia le zone strategiche di azione dei grandi player, offrendo un’analisi tecnica istituzionale di altissima precisione. Come usare BigPlayerRange: Questo indicatore mostra zone di acquisto (linea verde) e di vendita (linea rossa). Quando il prezzo chiude fuori da queste aree, è probabile un movimento di tendenz
SunSignal ML — AI Gold Signals with Multi-Timeframe Confluence SunSignal ML is an advanced AI-powered signal indicator purpose-built for XAUUSD gold trading. It combines a proprietary adaptive trend algorithm with six machine learning models trained on confirmed price pivots to produce high-confidence entry signals with multi-timeframe validation. The indicator runs efficiently on M1, M5 and M15 timeframes and is designed for traders who want precision entries guided by data rather than guesswor
FX Analysis is an all-in-one MT5 indicator dashboard that combines eight analytical tools in a single panel, helping traders identify high-probability setups without switching between charts or indicators. Designed for standard forex pairs on MetaTrader 5. Best results on M15 - H4 timeframes when all components are used together as part of the included workflow. Components Volatility Analyzer Displays historical average movement by hour and by day of the week. A real-time Pip Balance shows the
IVISTscalp5
Vadym Zhukovskyi
5 (6)
Итальянский [iVISTscalp5]: Un laboratorio per lo studio del comportamento del mercato attraverso il tempo TLV Framework | Liquidity Activation Points ⸻ Descrizione Generale iVISTscalp5 è un indicatore multilivello di timing e struttura dei prezzi sviluppato all’interno del progetto VISTmany. Il sistema prevede il tempo, la direzione e l’ampiezza del movimento attraverso i Liquidity Activation Points (timings). L’indicatore iVISTscalp5 può essere utilizzato con i parametri predefin
+++++++++++++++++++++++++++++++++++++++++++++++++++++++++++++++++++++++++++++++++++++++++++++++++ +++ Link to EURUSD Only Free Version -->  https://www.mql5.com/en/market/product/156904?source=Unknown +++++++++++++++++++++++++++++++++++++++++++++++++++++++++++++++++++++++++++++++++++++++++++++++++ Hallo Trader, This is a traditional GANN & FIBONACCI strategy based on detection of an impulsive move in the opposite direction. This is called a Breakout. At the moment of Breakout, the indicator draw
Btcusd Pro
Metin Erkamoglu
BTCUSD PRO Signal Solution for MT5 BTCUSD PRO is a decision-support indicator for MetaTrader 5, designed for traders who analyze BTCUSD or BTCUSD# with a structured signal workflow. The product is not an automated trading system. It does not open, close, or manage trades automatically. It provides analytical buy and sell signal information and displays a visual trade plan on the chart so the user can make their own trading decisions. Main purpose BTCUSD PRO is designed for traders who prefe
VTrende Pro
Andrii Diachenko
5 (1)
VTrende Pro - MTF indicator for trend trading with a display panel for MT5 *** Videos can be translated into any language using subtitles (video language - Russian) Although the signals of the VTrende Pro indicator can be used as signals of a full-fledged trading system, it is recommended to use them in conjunction with the Bill Williams TS. VTrende Pro is an extended version of the VTrende indicator. Difference between Pro version and VTrende: - Time zones - Signal V - signal 1-2 waves -    S
Red and Green Light – Intelligent Trading Signal Indicator Product Overview Red and Green Light is a professional trading signal indicator based on the multi-stage T3 smoothing algorithm. It integrates a visual traffic light system, intelligent signal recognition, risk alerts, and multiple notification features. Whether you're a manual trader or an Expert Advisor (EA) developer, this indicator helps you capture market opportunities with greater precision and effectively avoid the risks of
Классификатор силы тренда. Показания на истории не меняет. Изменяется классификация только незакрытого бара. По идее подобен полной системе ASCTrend, сигнальный модуль которой, точнее его аппроксимация в несколько "урезанном" виде, есть в свободном доступе, а также в терминале как сигнальный индикатор SilverTrend . Точной копией системы ASCTrend не является. Работает на всех инструментах и всех временных диапазонах. Индикатор использует несколько некоррелируемых между собой алгоритмов для класси
FFx Universal Strength Meter PRO is more than a basic strength meter. Instead of limiting the calculation to price, it can be based on any of the 19 integrated strength modes + 9 timeframes. With the FFx USM, you are able to define any period for any combination of timeframes. For example, you can set the dashboard for the last 10 candles for M15-H1-H4… Full flexibility! Very easy to interpret... It gives a great idea about which currency is weak and which is strong, so you can find the best pai
The FFx Universal MTF alerter shows on a single chart all the timeframes (M1 to Monthly) with their own status for the chosen indicator. 9 indicators mode (MACD-RSI-Stochastic-MA-ADX-Ichimoku-Candles-CCI-PSAR). Each can be applied multiple times on the same chart with different settings. Very easy to interpret. Confirm your BUY entries when most of the timeframes are showing green color. And confirm your SELL entries when most of the timeframes are showing red color. 2 Alert Options : input to s
The FFx Watcher PRO is a dashboard displaying on a single chart the current direction of up to 15 standard indicators and up to 21 timeframes. It has 2 different modes: Watcher mode: Multi Indicators User is able to select up to 15 indicators to be displayed User is able to select up to 21 timeframes to be displayed Watcher mode: Multi Pairs User is able to select any number of pairs/symbols User is able to select up to 21 timeframes to be displayed This mode uses one of the standard indicators
FFx Patterns Alerter gives trade suggestions with Entry, Target 1, Target 2 and StopLoss .... for any of the selected patterns (PinBar, Engulfing, InsideBar, OutsideBar) Below are the different options available: Multiple instances can be applied on the same chart to monitor different patterns Entry suggestion - pips to be added over the break for the entry 3 different options to calculate the SL - by pips, by ATR multiplier or at the pattern High/Low 3 different options to calculate the 2 TPs -
MetaTrader 4 version available here : https://www.mql5.com/en/market/product/24881 FFx Basket Scanner is a global tool scanning all pairs and all timeframes over up to five indicators among the 16 available. You will clearly see which currencies to avoid trading and which ones to focus on. Once a currency goes into an extreme zone (e.g. 20/80%), you can trade the whole basket with great confidence. Another way to use it is to look at two currencies (weak vs strong) to find the best single pairs
MetaTrader 4 version available here: https://www.mql5.com/en/market/product/25793 FFx Pivot SR Suite PRO is a complete suite for support and resistance levels. Support and Resistance are the most used levels in all kinds of trading. Can be used to find reversal trend, to set targets and stop, etc. The indicator is fully flexible directly from the chart 4 periods to choose for the calculation: 4Hours, Daily, Weekly and Monthly 4 formulas to choose for the calculation: Classic, Camarilla, Fibonac
ClassicSBA
Umri Azkia Zulkarnaen
this indicator very simple and easy if you understand and agree with setup and rule basic teknical sba you can cek in link : please cek my youtube channel for detail chanel : an for detail info  contact me  basicly setup buy (long) for this indicator is Magenta- blue and green candle or magenta - green  and green candlestik and for setup sell (short) is Black - yellow - and red candle or black - red  and red candlestik
Pendiente de Precio
Cesar Juan Flores Navarro
Indicador en base a la pendiente de la linea de precio, dibuja una línea de color cuando sube a base de los precios que previamente has sido procesados o linealizados, y cuando baja la pendiente la linea linealizada toma otro color. En este caso se a considerado 6 lineas de diferentes procesos desde pendientes largas hacia las cortas, observándose que cuando coincidan las pendientes se produce un máximo o mínimo, lo que a simple vista nos permitirá hacer una COMPRA O VENTA.
Altri dall’autore
ATD Channel Pattern Detector è un indicatore per MetaTrader 5 progettato per rilevare e disegnare canali di prezzo direttamente sul grafico. ATD Channel Pattern Detector è uno strumento visivo di analisi tecnica progettato per identificare possibili strutture di canale ascendenti, discendenti e orizzontali in base al movimento del prezzo. L’indicatore analizza le candele storiche, rileva le formazioni di canale utilizzando la propria logica interna di rilevamento dei pattern e disegna sul grafic
Professional Renko Chart MT5 Professional Renko Chart MT5 è un indicatore Renko pulito per MetaTrader 5, progettato per visualizzare i brick Renko in una finestra separata dell’indicatore, con visualizzazione opzionale delle box Renko direttamente sul grafico principale dei prezzi. L’indicatore è stato sviluppato per i trader che desiderano utilizzare uno stile di grafico Renko familiare all’interno di MetaTrader 5, simile alla visualizzazione dei grafici Renko disponibile sulle moderne piattafo
Filtro:
Nessuna recensione
Rispondi alla recensione