Trend Detection Indicator

  • 지표
  • Elham Afsharpour
    Elham Afsharpour
    저는 Python, C++, MQL5를 중심으로 8년의 프로그래밍 경험을 가진 숙련된 트레이딩 소프트웨어 개발자입니다. 지난 2년 동안은 주로 MetaTrader용 Expert Advisor, 커스텀 지표, 트레이딩 도구, 자동화 시스템 개발에 집중해 왔습니다.
  • 버전: 1.1
  • 업데이트됨: 27 6월 2026
  • 활성화: 5

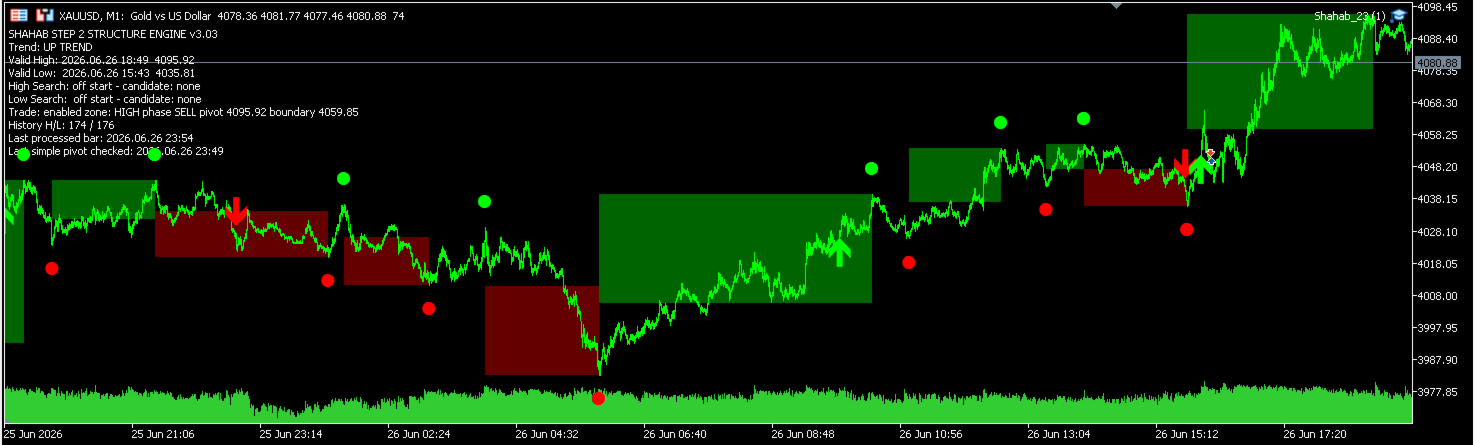
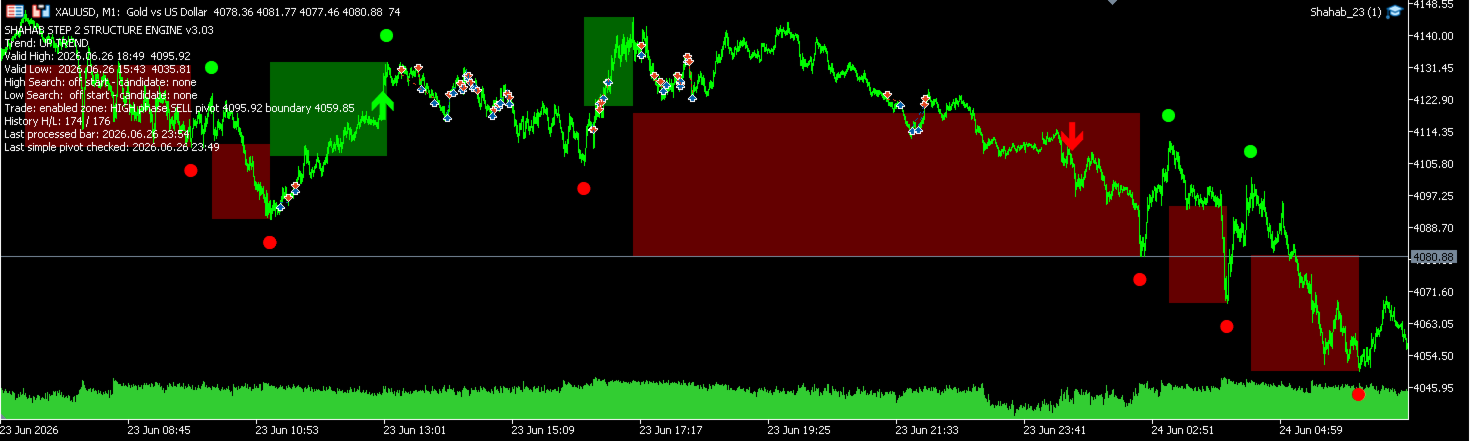
시각적 추세 화살표, 유효 피벗 마커, 선택 가능한 구조 영역을 제공하는 깔끔한 MT5 시장 구조 기반 추세 감지 지표입니다.

STS Structure Trend Detector는 가격 구조를 기반으로 시장 추세 방향을 감지하기 위한 깔끔한 MetaTrader 5 지표입니다.

STS Structure Trend Detector는 현재 시장 구조를 차트에서 직접 확인하고 싶은 트레이더를 위해 설계되었습니다. 이 지표는 유효한 고점과 저점을 분석하고, 구조적인 추세 변화를 감지하며, 명확한 화살표, 피벗 마커, 선택 가능한 구조 구역으로 결과를 표시합니다.

이것은 Expert Advisor가 아니며, 거래를 열거나 닫거나 관리하지 않습니다. 이 지표는 시각적인 시장 구조 분석 지표일 뿐입니다. 재량 거래, 수동 분석 또는 트레이더 개인 전략의 추가 확인 도구로 사용할 수 있습니다.

주요 기능

시장 구조 기반 추세 감지

상승 추세와 하락 추세를 나타내는 시각적 화살표

차트 위의 유효 고점 및 유효 저점 마커

유효 피벗 사이의 선택 가능한 가격 구조 영역

더 깊은 분석을 위한 선택 가능한 단순 피벗 표시

깔끔한 차트 창 표시

거래 로직 없음

주문 없음, 포지션 관리 없음, 자금 관리 없음

수동 시장 분석에 적합

어떻게 도움이 되는가

이 지표는 가격 구조의 움직임을 기반으로 현재 시장 방향을 식별하는 데 도움을 줍니다. 불필요한 신호를 많이 표시하는 대신, 중요한 시장 전환점과 추세 변화에 집중합니다. 이를 통해 차트가 더 깔끔하고 읽기 쉬워집니다.

다음 용도로 사용할 수 있습니다.

추세 방향 확인

시장 구조 분석

수동 진입 필터링

상위 시간대 방향 확인

지지 및 저항 구조 검토

유효 고점과 유효 저점의 시각적 분석

요구 사항

이 지표는 MetaTrader 5용으로 제작되었습니다.

지표를 사용하기 전에 사용자는 초기 구조 포인트를 올바르게 설정해야 합니다. 이 지표는 초기 유효 고점 캔들 시간과 초기 유효 저점 캔들 시간이 필요합니다. 이 두 포인트는 차트의 시작 구조 기준으로 사용됩니다.

최상의 결과를 위해:

충분한 과거 데이터가 로드된 차트에서 지표를 사용하십시오

초기 고점 및 저점 캔들 시간을 신중하게 설정하십시오

올바른 초기 추세 방향을 선택하십시오

자신의 거래 방식에 맞는 종목과 시간대를 사용하십시오

실제 분석에 사용하기 전에 데모 차트에서 설정을 테스트하십시오

지표 구조

이 지표는 여러 개의 깔끔한 입력 섹션으로 구성되어 있습니다.

초기 구조

이 섹션은 지표가 사용하는 첫 번째 유효 구조 포인트를 정의합니다.

주요 입력값:

초기 유효 고점 캔들 시간

초기 유효 저점 캔들 시간

초기 추세 방향

가장 가까운 바에 맞추기 옵션

최대 맞춤 거리(분)

구조 로직

이 섹션은 일반적인 구조 확인 동작을 제어합니다.

주요 입력값:

단순 피벗 양쪽 바 수

동일 고점/저점 허용 범위

돌파 확인 모드

돌파 버퍼

시작 시 과거 데이터 처리

유효 피벗 확인 후 반대 방향 검색 재설정

추세 화살표

이 섹션은 차트에 추세 변화 화살표가 표시되는 방식을 제어합니다.

주요 입력값:

추세 화살표 표시 또는 숨김

캔들로부터의 화살표 거리

상승 추세 화살표 스타일

하락 추세 화살표 스타일

화살표 크기

상승 추세 색상

하락 추세 색상

유효 피벗 마커

이 섹션은 확인된 유효 고점과 유효 저점의 표시를 제어합니다.

주요 입력값:

유효 피벗 마커 표시 또는 숨김

단순 피벗 표시

이 섹션은 내부 단순 피벗 구조를 시각적으로 확인하고 싶은 사용자를 위한 기능입니다.

주요 입력값:

단순 피벗 마커 표시 또는 숨김

유효 피벗 영역

이 섹션은 중요한 피벗 영역 사이에 그려지는 선택 가능한 구조 구역을 제어합니다.

주요 입력값:

유효 피벗 영역 표시 또는 숨김

영역 비율

고점 영역 색상

저점 영역 색상

사각형 투명도

사각형을 배경에 그리기

일반 설정

이 섹션에는 일반 표시 설정과 차트 객체 설정이 포함되어 있습니다.

주요 입력값:

초기화 시 오래된 객체 삭제

비활성화 시 객체 삭제

중요 참고 사항

STS Structure Trend Detector는 분석 도구이며, 거래 로봇이 아닙니다. 이 지표는 거래 결과를 보장하지 않으며, 리스크 관리나 개인적인 거래 판단을 대체하지 않습니다. 이 지표는 트레이더가 시장 구조를 더 명확하게 읽고 더 근거 있는 수동 결정을 내릴 수 있도록 돕기 위해 만들어졌습니다.

실제 거래 환경에서 사용하기 전에 항상 데모 계좌 또는 과거 차트에서 지표를 테스트하십시오.


추천 제품
MetaHelper
Volodymyr Tseibei
This indicator automatically calculates and displays classic pivot points on your chart, helping identify key support and resistance levels for the current trading session. Features: · Plots Pivot (PP), Resistance 1-2 (R1, R2), and Support 1-2 (S1, S2) levels · Includes current close price line for reference · Color-coded lines: Blue for pivot, Red for resistances, Green for supports · Automatic calculation based on previous day's high, low, and close · Continuous lines across the chart for e
Dual Bollinger Session Channel
Danton Dos Santos Sardinha Junior
Dual Bollinger Session Channel MetaTrader 5 전문 고정 세션 볼린저 채널 실제 세션 데이터를 기반으로 가격 행동(price action), 돌파(breakout), 기관급 시장 구조 분석을 위해 설계되었습니다. 제품 개요 Dual Bollinger Session Channel 은 MetaTrader 5용 프로페셔널급 기술적 인디케이터로, 직전의 실제 거래 세션 (일간 또는 주간) 데이터만을 기반으로 두 개의 독립적인 볼린저 밴드 계산을 수행하여 고정된 통계적 가격 채널을 생성합니다. 기존의 볼린저 밴드가 새 캔들이 형성될 때마다 지속적으로 재계산되는 것과 달리, 본 인디케이터는 현재 활성 세션 전체 동안 모든 채널 레벨을 고정 하여 트레이더에게 거래 기간 내내 안정적이고 신뢰할 수 있는 통계적 프레임워크를 제공합니다. 이 방식은 다음을 정밀하게 시각화할 수 있게 해줍니다: 가격 균형 구역 통계적 과신장(overextension) 영역 변동성 확장
CRT Candle Range Theory HTF MT5.   Ultimate CRT Indicator: Advanced ICT Concepts and Malaysian SnR Trading System Master the Market Maker's Footprints with the Most Advanced Candle Range Theory Indicator Discounted   Price $50  !!     Secure your lifetime access now before it switches to subscription-only ! Unlock the true power of Smart Money Concepts (SMC) and trade precisely like the institutions with the Ultimate CRT Indicator . Built exclusively for serious traders, this indicator automate
Gold Trader Pro is an advanced analytical tool specifically engineered for professional trading on XAUUSD (Gold). It provides an immediate comprehensive overview of market structure across 7 different timeframes, allowing traders to identify flow direction and signal strength through a modern, draggable, and interactive interface. Key Features Multi-Timeframe Analysis: Real-time monitoring of M1, M5, M15, M30, H1, H4, and D1. Two Operational Modes: MODE_SCALPING: Optimized for fast-paced analys
FREE
Heiken Ashi Supertrend Combine
Tri Yasin Satrio Adji Pranoto
Headline: Stop Guessing, Start Winning. Unleash the Power of the Heiken Ashi Supertrend Indicator. Body: Are you tired of market noise, confusing charts, and missed opportunities? The Heiken Ashi Supertrend Indicator is the ultimate tool designed to bring clarity and confidence to your trading, once and for all. We've combined two of the most powerful concepts in technical analysis into one seamless, easy-to-use indicator: Crystal-Clear Trends with Heiken Ashi: Say goodbye to choppy price action
상위 차트주기 기반 프랙탈 레벨은 상위 차트주기의 프랙탈을 기반으로 정확한 지지 및 저항 수준을 구축하도록 설계된 강력한 도구로, 편리한 알림과 함께 매수 및 매도 신호를 제공합니다. 사용 방법: 이 인디케이터는 상위 차트주기의 프랙탈 레벨을 분석하여 현재 차트에 표시합니다. 지표 속성에서 선임 주기를 쉽게 조정하여 전략에 대한 정확성과 관련성을 극대화할 수 있습니다. 상위 차트주기를 기준으로 프랙탈 레벨을 사용할 때의 이점: 조기 신호 감지: 더 낮은 차트주기에서 더 높은 차트주기 프랙탈 레벨을 볼 수 있으므로 잠재적 매수 및 매도 신호를 초기에 식별할 수 있습니다. 수익/손실률 개선: 짧은 차트주기에 조기 진입하면 손절가를 더 짧게 설정할 수 있어 트레이딩 효율이 크게 향상됩니다. 편리한 알림: 중요한 신호를 놓치지 마세요 - 진입 및 청산 기회에 대한 알림을 즉시 받을 수 있습니다. 분석 정확도 향상: 정말 중요한 핵심 레벨에 집중하고 불필요한 시장 잡음은 무시하세요.
Pivot Points MT5 is a universal color multicurrency/multisymbol indicator of the Pivot Points levels systems. You can select one of its three versions: Standard Old, Standard New and Fibo . It plots pivot levels for financial instruments in a separate window . The system will automatically calculate the Pivot Point on the basis of market data for the previous day ( PERIOD_D1 ) and the system of support and resistance levels, three in each. A user can choose colors for the indicator lines. The on
Market Structure Fractals The structure layer MetaTrader 5 was missing Most traders stare at candles and draw structure manually — imprecisely, inconsistently, and always too late. You know what a fractal high and low look like. The question is whether you can spot every one, mark it cleanly, and track it the moment price breaks through. You can't. Market Structure Fractals can. MetaTrader 5 shows you price. It doesn't show you structure. That gap — between a candle pattern and a confirmed bre
FREE
MetaTrader 5용 스마트 다층 브레이크아웃 및 풀백 탐지기 "스마트하고, 간단하고, 빠르게!" 고확률 브레이크아웃 진입을 놓치는 것에 지치셨나요? 여러 차트를 몇 시간씩 스캔하면서 브레이크아웃을 추세 방향과 통화 모멘텀에 맞추려고 하지만 — 결국 움직임을 놓치고 마나요? Break Pullback은 하나의 지표로 이 모든 문제를 해결합니다. Break Pullback이란 무엇인가요? Break Pullback은 시장 구조, 브레이크아웃, 추세 지속 설정을 거래하는 트레이더를 위해 특별히 설계된 전문가급 MetaTrader 5 지표입니다. 실시간으로 여러 통화 쌍에 걸쳐 Break와 Pullback 형성을 자동으로 감지하고 — 세 가지 확인 레이어를 통해 모든 신호를 필터링합니다: 구조적 브레이크아웃 탐지 — 차트의 주요 브레이크 레벨 식별 HTF 일봉 바이어스 — 진입을 지배적인 일봉 추세 방향에 맞춤 통화 강도 지수 — 쌍을 이룬 통화 간의 모멘텀 불균형 확인 결과: 오
Order Block Box
Usiola Oluwadamilol Olagundoye
5 (3)
Next Arrival : Flip or Die Trading Arena. Flip a trading account:  https://flipordie.com/chapter-1-thirteen-doublings-double-a-trading-account/ The Advanced Order Block Indicator for MetaTrader 5 is designed to enhance technical analysis by identifying significant order blocks that sweep liquidity and create Fair Value Gaps (FVG) when pushing away. This indicator is ideal for traders who focus on institutional trading concepts and wish to incorporate advanced order flow and price action strategi
FREE
PREngulfing
Slobodan Manovski
PR EA - Engulfing Pattern Trading System Automated Engulfing Pattern Detection with MA Confirmation The PR EA is a Meta Trader 5 expert advisor that identifies and trades bullish/bearish engulfing candlestick patterns when confirmed by a moving average filter. Designed for swing trading on 30-minute charts with compatibility for M15 and H1 time frames. Key Features: Pattern Recognition - Detects valid bullish/bearish engulfing candle formations Trend Confirmation - 238-period SMA filter
All Harmonics 26
Alexey Isavnin
3.5 (4)
Harmonic patterns are characteristic series of price movements with respect to Fibonacci levels, which statistically precede price reversals. This indicator searches for harmonic patterns. It is capable of recognising 26 classical and non-classical harmonic patterns : Classical Gartley Butterfly Alternate Butterfly Bat Alternate Bat Crab Deep Crab Three Drives Non-classical Shark Alternate Shark Cypher 5-0 Anti Gartley Anti Butterfly Anti Alternate Butterfly Anti Bat Anti Alternate Bat Anti Crab
멀티 타임프레임 지원, 맞춤형 시각 신호 및 구성 가능한 알림 시스템을 갖춘 Balance of Power(BOP) 지표. 프리랜서 프로그래밍 서비스, 업데이트 및 기타 TrueTL 제품은 제 MQL5 프로필 에서 이용하실 수 있습니다. 피드백과 리뷰를 대환영합니다! BOP란 무엇인가요? Balance of Power(BOP)는 가격 변화를 바의 범위와 비교하여 매수자 대 매도자의 강도를 측정하는 오실레이터입니다. 지표는 (종가 - 시가) / (고가 - 저가)로 계산된 후 단순 이동 평균(SMA)으로 평활화됩니다. BOP 값은 -1과 +1 사이에서 변동합니다. 양수 값은 매수자가 더 강함을 나타내고(종가가 시가보다 높음), 음수 값은 매도자가 더 강함을 나타냅니다(종가가 시가보다 낮음). 값의 크기는 움직임의 강도를 나타냅니다. BOP는 매수 압력과 매도 압력 사이의 균형을 보여줌으로써 시장 강도와 잠재적인 반전을 식별하는 데 도움이 됩니다. 특징: 화살표 및 수직선을 이용한
FREE
Zone Structure Scanner Panel for MT5 Find better setups faster — without scanning charts for hours. The Zone Structure Scanner Panel for MT5 helps you automatically scan multiple symbols, detect key weekly and daily support/resistance zones, read market structure, highlight confluence, and flag H4 rejection-confirmed setups from one powerful panel. Instead of jumping from chart to chart, you get ranked opportunities in one place so you can focus on the setups that matter most. Why it stands
Introduction to EFW Analytics EFW Analytics was designed to accomplish the statement "We trade because there are regularities in the financial market". EFW Analytics is a set of tools designed to maximize your trading performance by capturing the repeating fractal geometry, known as the fifth regularity in the financial market. The functionality of EFW Analytics consists of three parts. Firstly, Equilibrium Fractal Wave Index is an exploratory tool to support your trading logic to choose which r
The indicator is designed to work on any trading platform. The program is based on proprietary algorithms and W.D.Ganna's mathematics, allowing you to calculate target levels of price movement based on three points with the highest degree of certainty. It is a great tool for stock trading. The indicator has three buttons: NEW - call up a triangle for calculation. DEL - delete the selected triangle. DELS - completely remove all constructions. The probability of achieving the goals is more than 80
CRT Fibo OTE Scanner MT5 is a multi-symbol CRT scanning and chart-visualization tool for MetaTrader 5. It detects active CRT-style setups, draws CRTH/CRTL zones, supports OTE entry Fibonacci and custom target Fibonacci layers, and provides optional context filters such as pivot BOS, PDH/PDL, weekly high/low, Asian sweep, killzone timing, HTF bias, displacement and FVG confirmation. This product is a chart utility and scanner. It does not open, modify, or close trades automatically. Full Product
Pan PrizMA CD Phase
Aleksey Panfilov
The Expert Advisor and the video are attached in the Discussion tab . The robot applies only one order and strictly follows the signals to evaluate the indicator efficiency. Pan PrizMA CD Phase is an option based on the Pan PrizMA indicator. Details (in Russian). Averaging by a quadric-quartic polynomial increases the smoothness of lines, adds momentum and rhythm. Extrapolation by the sinusoid function near a constant allows adjusting the delay or lead of signals. The value of the phase - wave s
Created by imjesstwoone and mickey1984, this trade model attempts to capture the expansion from the 10:00-14:00 EST 4h candle using just 3 simple steps. All of the information presented in this description has been outlined by its creators, all I did was translate it to MQL5. All core settings of the trade model may be edited so that users can test several variations, however this description will cover its default, intended behavior using NQ 5m as an example. Step 1 is to identify our Price Ra
Overview The Market Perspective Structure Indicator is a comprehensive MetaTrader indicator designed to provide traders with a detailed analysis of market structure across multiple timeframes. It identifies and visualizes key price action elements, including swing highs and lows, Break of Structure (BOS), Change of Character (CHOCH), internal structures, equal highs/lows, premium/discount levels, previous levels from higher timeframes, and trading session zones. With extensive customization opt
Smart Trendlines MT5
Suvashish Halder
5 (3)
Smart Trendlines – No.1 Trendlines Indicator Smart Trendlines is a precision tool that automatically draws trendlines based on every valid pivot point, helping traders identify key support and resistance zones. It continuously adjusts as new market pivots form, providing a live and accurate reflection of price structure. Whether you’re tracking trends, preparing for reversals, or anticipating breakouts — this indicator keeps you one step ahead. It works seamlessly across all assets including For
Based on the trading model/strategy/system of gold double-position hedging and arbitrage launched by Goodtrade Brokers, problems encountered in daily operations: 1. Account B immediately places an order immediately following account A. 2: After account A places an order, account B will automatically copy the stop loss and take profit. 3: Account A closes the position of Account B and closes the position at the same time. 4: When account B closes the position, account A also closes the position.
Support & Resistance Auto Plot Lines Indicator for MT5 – Perfect for Scalping! Make your trading easier with our Support & Resistance Auto Plot Lines indicator for MT5. This powerful tool automatically detects key support and resistance levels on your chart, helping you make better trading decisions with minimal effort. Why Choose This Indicator? Perfect for Scalping – Quickly identify strong price zones for fast, precise entries and exits. Automatic Level Detection – No need to manually dra
Pivot Math Support and Resistance Lines indicator — indicator showing pivot lines, which will definitely help every trader who knows how to trade with resistance, support and pivot lines. It shows 8 different lines (additional lines are also possible) on the main chart, helping you find the best points to buy, sell and exit positions.  Input parameters: P (default = 64) — period in bars or other periods (set using MMPeriod), on which the lines will be calculated. The smaller this number, the "f
MT5 Support and Resistance Indicator Automatic Drawing of Multiple Supports and Resistances with levels.  Supports As follow 1.       Weak Support 2.       Untested Support 3.       Verified Support 4.       Proven Support 5.       Turncoat Support Resistances As follow 1.       Weak Resistance 2.       Untested Resistance 3.       Verified Resistance 4.       Proven Resistance 5.       Turncoat Resistance Best Strategy to use 1.       Identify Trend Direction on Daily Time Frame, Example Gold =
RAD Real Acummulation and Distribution
Jose Alejandro Jacome Jimenez
RAD CRITICAL LEVES RAD indicator tracks “Relevant Volume” in real time, identifying accumulation and distribution processes, projecting them in the chart as SUPPORT or RESISTANCE zones. Natural   support   and resistance levels are generated by Volume Accumulation and Distribution processes. As these processes evolve, levels at which the relevant volume in the market place is positioned, become difficult areas to cross upwards or downwards. By using this information, traders can identify very s
MercariaPattern1-2-3 відстежує рух ціни, знаходить трьоххвильові структури 1-2-3 та підсвічує момент, коли сценарій підтверджується пробоєм ключового рівня. MercariaPattern1-2-3 tracks price movement, detects three-leg 1-2-3 structures and highlights the moment when the scenario is confirmed by a key level breakout. Індикатор збирає локальні свінги в компактну фігуру 0–1–2–3 , чекає підтвердженого пробою та будує стрілку входу з готовими рівнями SL/TP. The indicator combines local swings into a
멀티 타임프레임 지원, 사용자 정의 시각적 신호 및 구성 가능한 알림 시스템을 갖춘 Average True Range(ATR) 지표. 프리랜서 프로그래밍 서비스, 업데이트 및 기타 TrueTL 제품은 제 MQL5 프로필 에서 확인하실 수 있습니다. 피드백과 리뷰는 매우 감사하게 받겠습니다! ATR이란 무엇인가요? J. Welles Wilder가 개발한 Average True Range(ATR)는 시장 변동성을 측정하는 기술 지표입니다. 지정된 기간 동안의 True Range 평균을 계산합니다. True Range는 다음 중 가장 큰 값입니다: 현재 고가에서 현재 저가까지의 거리, 이전 종가에서 현재 고가까지의 거리, 또는 이전 종가에서 현재 저가까지의 거리. ATR은 가격 방향을 나타내지 않습니다 — 오직 변동성만 측정합니다. ATR이 상승하면 변동성 증가를 나타내고, ATR이 하락하면 변동성 감소를 신호합니다. 트레이더들은 ATR을 사용하여 시장 상황을 평가하고, 동적 손절매
FREE
Perfect Trade Indicator PRO ULTRA for MT5 Perfect Trade Indicator PRO ULTRA — это многофункциональный аналитический индикатор для MetaTrader 5, созданный для трейдеров, которые работают с XAUUSD (Gold) и хотят видеть на графике не просто стрелки, а полноценную торговую картину. Индикатор предназначен для работы в стиле smart scalping / intraday trading на таймфреймах M15 и M30. Он объединяет несколько аналитических блоков в единый механизм и помогает находить более качественные торговые сет
MSS_Pro_MTF is a professional multi-timeframe swing trading Expert Advisor designed for MetaTrader 5 platform. This system combines advanced swing identification techniques with Fibonacci trading strategies to accurately capture market trends while maintaining strict risk control. Key Features: Multi-Timeframe Analysis Monitors high/low timeframes (customizable) simultaneously - identifies trend direction on higher timeframe and precise entries on lower timeframe Intelligent Swing Detection Pr
이 제품의 구매자들이 또한 구매함
UZFX {SSS} 스캘핑 스마트 시그널 v4.0 MT5는 급변하는 시장에서 정확한 실시간 시그널을 필요로 하는 스캘퍼, 데이 트레이더, 스윙 트레이더를 위해 설계된 리페인팅이 없는 고성능 트레이딩 지표입니다. (UZFX-LABS)에서 개발한 이 지표는 가격 움직임 분석, 추세 확인 및 스마트 필터링을 결합하여 모든 통화 쌍과 시간대에서 높은 확률의 매수 및 매도 신호, 경고 신호, 추세 지속 기회를 생성합니다. 거래에 대한 의구심을 떨쳐버리고, 명확성, 정밀성, 그리고 규율 있는 시장 실행을 원하는 트레이더를 위해 설계된 체계적인 신호 시스템을 따르기 시작하세요. 제 추천* 최적의 시간대: 15분 이상. {H1}이 제가 가장 선호하는 시간대입니다. 그리고 그 결과는 정말 놀라울 정도입니다...!! 주요 기능 업데이트 • 자동 매수 및 매도 신호 감지 • 고급 반전 인식 로직 • 잠재적인 시장 반전 전 조기 경고 신호 • 추세 지속 확인 신호 • 진입, 손절, TP1, TP2,
ARIPoint
Temirlan Kdyrkhan
1 (1)
ARIPoint is a powerful trading companion designed to generate high-probability entry signals with dynamic TP/SL/DP levels based on volatility. Built-in performance tracking shows win/loss stats, PP1/PP2 hits, and success rates all updated live. Key Features: Buy/Sell signals with adaptive volatility bands Real-time TP/SL/DP levels based on ATR Built-in MA Filter with optional ATR/StdDev volatility Performance stats panel (Success, Profit/Loss, PP1/PP2) Alerts via popup, sound, push, or email Cu
PrimeScalping
Temirlan Kdyrkhan
PrimeScalping is a powerful trading companion designed to generate high-probability entry signals with dynamic TP/SL/DP levels based on volatility. Built-in performance tracking shows win/loss stats, PP1/PP2 hits, and success rates — all updated live. Key Features: Buy/Sell signals with adaptive volatility bands Real-time TP/SL/DP levels based on ATR Built-in MA Filter with optional ATR/StdDev volatility Performance stats panel (Success, Profit/Loss, PP1/PP2) Alerts via popup, sound, push, or e
OmniSync Projection
Antonio-alin Teculescu
5 (1)
Chronos Fractal Engine is an innovative price projection indicator for MetaTrader 5, designed to transform your technical analysis by intelligently identifying and projecting historical price patterns. Built upon an advanced correlation algorithm and the fractal principles of the market, this powerful tool visualizes potential future price movements, giving you a unique edge in your trading decisions. What is Chronos Fractal Engine? At its core, the Chronos Fractal Engine employs a sophisticat
ScalpPoint
Temirlan Kdyrkhan
ScalpPoint is a powerful trading companion designed to generate high-probability entry signals with dynamic TP/SL/DP levels based on volatility. Built-in performance tracking shows win/loss stats, PP1/PP2 hits, and success rates — all updated live. Key Features: Buy/Sell signals with adaptive volatility bands Real-time TP/SL/DP levels based on ATR Built-in MA Filter with optional ATR/StdDev volatility Performance stats panel (Success, Profit/Loss, PP1/PP2) Alerts via popup, sound, push, or emai
SmartScalping
Temirlan Kdyrkhan
SmartScalping is a powerful trading companion designed to generate high-probability entry signals with dynamic TP/SL/DP levels based on volatility. Built-in performance tracking shows win/loss stats, PP1/PP2 hits, and success rates — all updated live. Key Features: Buy/Sell signals with adaptive volatility bands Real-time TP/SL/DP levels based on ATR Built-in MA Filter with optional ATR/StdDev volatility Performance stats panel (Success, Profit/Loss, PP1/PP2) Alerts via popup, sound, push, or e
TrendProMaster
Temirlan Kdyrkhan
MasterTrend Indicator for MT5 A powerful trend-following and signal-evaluation tool MasterTrend   is a custom MT5 indicator that combines Moving Averages and ATR-based risk/reward logic to generate clear buy/sell signals. It visualizes dynamic SL/TP levels, evaluates past trade outcomes, and displays win/loss statistics in a clean on-chart panel. Key features include: Buy/Sell signals based on MA crossovers ATR-based SL/TP1/TP2/TP3 levels with visual lines and labels Signal outcome tracking wit
Meravith Scanner
Ivan Stefanov
5 (2)
MERAVITH SCANNER는 MetaTrader 5용 전문 금융 시장 지표로, 여러 분석 도구를 하나의 통합 시스템으로 결합합니다. 독점적인 거래량 가중 평균 가격(VWAP) 방법론을 사용하여 모든 계산을 자동으로 수행하며, 주관적인 해석을 완전히 배제합니다. 이 지표는 모든 자산 클래스(Forex, 주식, 지수, 상품, 암호화폐)와 M1부터 월간 차트까지 모든 시간 프레임에서 작동합니다. 기본 원리는 “가격은 거래량을 따른다”입니다. MERAVITH는 기관 거래량이 집중되는 위치를 식별하고, 그 집중에서 수학적으로 정확한 가격 수준을 도출합니다. 예측이나 투기를 하지 않으며, 계산만 수행합니다. MERAVITH SCANNER를 사용하면 28개의 주요 Forex 통화쌍을 모든 시간 프레임에서 단 2~3분 만에 스캔할 수 있습니다. 또한 원하는 시장을 스캔할 수도 있으며, 예를 들어 약 100개의 주식을 약 10분 안에 스캔할 수 있습니다. 지표는 소진 레벨, 균형선, 편차, 통계
MasterTrend
Temirlan Kdyrkhan
MasterTrend Indicator for MT5 A powerful trend-following and signal-evaluation tool MasterTrend   is a custom MT5 indicator that combines Moving Averages and ATR-based risk/reward logic to generate clear buy/sell signals. It visualizes dynamic SL/TP levels, evaluates past trade outcomes, and displays win/loss statistics in a clean on-chart panel. Key features include: Buy/Sell signals based on MA crossovers ATR-based SL/TP1/TP2/TP3 levels with visual lines and labels Signal outcome tracking wit
VTrende Pro
Andrii Diachenko
5 (1)
VTrende Pro - MTF indicator for trend trading with a display panel for MT5 *** Videos can be translated into any language using subtitles (video language - Russian) Although the signals of the VTrende Pro indicator can be used as signals of a full-fledged trading system, it is recommended to use them in conjunction with the Bill Williams TS. VTrende Pro is an extended version of the VTrende indicator. Difference between Pro version and VTrende: - Time zones - Signal V - signal 1-2 waves -    S
ZIVA Signal Intelligence
Hassan Abdullah Hassan Al Balushi
ZIVA Signal Intelligence An Adaptive, Modular Market Intelligence System ZIVA Signal Intelligence is not positioned as a conventional trading indicator. It is a fully integrated, proprietary market intelligence system engineered to deliver structured, high-precision interpretation of price behavior within a controlled analytical environment. Developed through an independent architectural approach, ZIVA does not rely on, derive from, or replicate existing indicators. It represents a standalone
ARICoins
Temirlan Kdyrkhan
ARICoin is a powerful trading companion designed to generate high-probability entry signals with dynamic TP/SL/DP levels based on volatility. Built-in performance tracking shows win/loss stats, PP1/PP2 hits, and success rates all updated live. Key Features: Buy/Sell signals with adaptive volatility bands Real-time TP/SL/DP levels based on ATR Built-in MA Filter with optional ATR/StdDev volatility Performance stats panel (Success, Profit/Loss, PP1/PP2) Alerts via popup, sound, push, or email Cust
이 위치가 매수에 적합한지 판단하는 데 도움을 줍니다. 이 위치가 매도에 적합한지 판단하는 데 도움을 줍니다. 네 개의 지표가 동시에 바닥에 도달하면 반등 기회를 중점적으로 살펴보시기 바랍니다. 네 개의 지표가 동시에 상단에 위치하면 하락 기회를 중점적으로 살펴보시기 바랍니다. 이 시스템은 중국의 첨단 알고리즘 기술과 고급 수학 모델링 체계를 기반으로 구축되었습니다. 저는 주로 XAUUSD M5 주기에서 이 지표를 사용하며, 이 주기가 가장 좋은 결과를 보여줍니다. 이 지표의 알고리즘과 수학 공식은 매우 복잡하기 때문에 테스트 시 진행 속도가 느릴 수 있습니다. 테스트할 때는 지표가 리페인트되는지, 지연되는지만 확인하시면 됩니다. 정식 버전은 실제 사용 시 더 안정적입니다. 이 지표 시스템은 절대 리페인트하지 않으며 미래 데이터를 사용하지 않습니다. 구매 전에 직접 테스트하고 확인하실 수 있습니다. 이 지표에는 완전히 개인화된 알림 시스템이 포함되어 있으며, 아래 링크를 통해 확인하
Premium level Pro
Dmitriy Kashevich
Premium level is a unique indicator with more than 80% accuracy of correct predictions! This indicator has been tested for more than two months by the best Trading Specialists! The author's indicator you will not find anywhere else! From the screenshots you can see for yourself the accuracy of this tool! 1 is great for trading binary options with an expiration time of 1 candle. 2 works on all currency pairs, stocks, commodities, cryptocurrencies Instructions: As soon as the red arrow app
Triple Crox Strategy
issam rahhal sabour
Triple Crox Strategy v4.10 Triple Crox Strategy v4.10 Professional MetaTrader 5 Indicator 13 Patterns • Fibonacci • CLUSTER ML • Multi-Filter 1. Overview Advanced MT5 indicator combining 13 Pattern Detection , Fibonacci Analysis , CLUSTER Machine Learning and Multi-Filter system for precise signals on Forex, indices, commodities, crypto. 5-step pipeline: indicators → filter → patterns → signals → levels. 2. Trading Setup Heikin-Ashi colored bars. Buy/Sell arrows with Entry, TP1(1x ATR), TP2(2x
Gold Xausd Hunter
Metin Erkamoglu
5 (1)
MATADOR GOLD XAUUSD M5 Scalp Signals for MT5 MATADOR GOLD is a decision-support indicator for MetaTrader 5, designed for traders who analyze short-term Gold movement on the M5 timeframe. The indicator does not open, close, or manage trades automatically. It provides buy and sell signal guidance so the user can make their own trading decisions according to their risk plan, broker conditions, and trade management rules. Main purpose MATADOR GOLD is built to help traders avoid noisy signal flow and
Big Player Range
Thalles Nascimento De Carvalho
5 (3)
BigPlayerRange – MT5 최고의 지표 BigPlayerRange 는 MetaTrader 5에서 미니 인덱스와 미니 달러를 위한 최고의 지표 로 평가받고 있습니다. 이 도구는 주요 기관 투자자들의 전략적 영역을 강조하여 높은 정확도의 기관 기술 분석을 제공합니다. BigPlayerRange 사용법: 이 지표는 매수 구간(녹색선)과 매도 구간(빨간선)을 표시합니다. 가격이 이 구간 밖에서 마감되면 추세 움직임이 예상됩니다. 녹색선 위에서 마감: 강한 매수세와 상승 추세 가능성. 빨간선 아래에서 마감: 매도 압력과 하락 가능성. 범위 내에서 마감: 횡보 시장, 돌파 신호 대기. 주요 혜택: 기관 투자자 영역 매핑: 주요 투자자들의 활동 구간을 식별합니다. 자동 목표 지점 산출: 거래 종료에 적합한 목표 지점을 제공합니다. 풀백 분석: 리스크 관리를 위한 가격 반등 가능성 평가. 활용 방법: BigPlayerRange와 함께 Imba
SunSignal ML — AI Gold Signals with Multi-Timeframe Confluence SunSignal ML is an advanced AI-powered signal indicator purpose-built for XAUUSD gold trading. It combines a proprietary adaptive trend algorithm with six machine learning models trained on confirmed price pivots to produce high-confidence entry signals with multi-timeframe validation. The indicator runs efficiently on M1, M5 and M15 timeframes and is designed for traders who want precision entries guided by data rather than guesswor
FX Analysis
Lee Teik Hong
FX Analysis is an all-in-one MT5 indicator dashboard that combines eight analytical tools in a single panel, helping traders identify high-probability setups without switching between charts or indicators. Designed for standard forex pairs on MetaTrader 5. Best results on M15 - H4 timeframes when all components are used together as part of the included workflow. Components Volatility Analyzer Displays historical average movement by hour and by day of the week. A real-time Pip Balance shows the
IVISTscalp5
Vadym Zhukovskyi
5 (6)
[iVISTscalp5]: 시간을 통한 시장 행동 연구소 TLV Framework | Liquidity Activation Points ⸻ 개요 iVISTscalp5는 VISTmany 프로젝트 내에서 개발된 다중 레벨 타이밍 및 가격 구조 인디케이터입니다. 이 시스템은 Liquidity Activation Points(타이밍)를 통해: 움직임이 발생하는 시간 방향 가격 움직임의 범위 를 예측합니다. iVISTscalp5 인디케이터는 기본 설정만으로도 모든 금융상품에 사용할 수 있습니다. ⸻ 실질적 가치 iVISTscalp5는 일반적인 기술적 지표로 만들어진 것이 아닙니다. 개발의 핵심 아이디어는 다음과 같습니다. 누구나 시간을 통해 시장 행동을 연구할 수 있도록 하는 것. ⸻ Time Language VISTmany (TLV) — 프로젝트의 핵심 개념 t(p) t(p)는 타이밍이 활성화되는 가격 레벨입니다. ⸻ p(p) p(
+++++++++++++++++++++++++++++++++++++++++++++++++++++++++++++++++++++++++++++++++++++++++++++++++ +++ Link to EURUSD Only Free Version -->  https://www.mql5.com/en/market/product/156904?source=Unknown +++++++++++++++++++++++++++++++++++++++++++++++++++++++++++++++++++++++++++++++++++++++++++++++++ Hallo Trader, This is a traditional GANN & FIBONACCI strategy based on detection of an impulsive move in the opposite direction. This is called a Breakout. At the moment of Breakout, the indicator draw
Btcusd Pro
Metin Erkamoglu
BTCUSD PRO Signal Solution for MT5 BTCUSD PRO is a decision-support indicator for MetaTrader 5, designed for traders who analyze BTCUSD or BTCUSD# with a structured signal workflow. The product is not an automated trading system. It does not open, close, or manage trades automatically. It provides analytical buy and sell signal information and displays a visual trade plan on the chart so the user can make their own trading decisions. Main purpose BTCUSD PRO is designed for traders who prefe
Red and Green Light – Intelligent Trading Signal Indicator Product Overview Red and Green Light is a professional trading signal indicator based on the multi-stage T3 smoothing algorithm. It integrates a visual traffic light system, intelligent signal recognition, risk alerts, and multiple notification features. Whether you're a manual trader or an Expert Advisor (EA) developer, this indicator helps you capture market opportunities with greater precision and effectively avoid the risks of
Классификатор силы тренда. Показания на истории не меняет. Изменяется классификация только незакрытого бара. По идее подобен полной системе ASCTrend, сигнальный модуль которой, точнее его аппроксимация в несколько "урезанном" виде, есть в свободном доступе, а также в терминале как сигнальный индикатор SilverTrend . Точной копией системы ASCTrend не является. Работает на всех инструментах и всех временных диапазонах. Индикатор использует несколько некоррелируемых между собой алгоритмов для класси
FFx Universal Strength Meter PRO is more than a basic strength meter. Instead of limiting the calculation to price, it can be based on any of the 19 integrated strength modes + 9 timeframes. With the FFx USM, you are able to define any period for any combination of timeframes. For example, you can set the dashboard for the last 10 candles for M15-H1-H4… Full flexibility! Very easy to interpret... It gives a great idea about which currency is weak and which is strong, so you can find the best pai
The FFx Universal MTF alerter shows on a single chart all the timeframes (M1 to Monthly) with their own status for the chosen indicator. 9 indicators mode (MACD-RSI-Stochastic-MA-ADX-Ichimoku-Candles-CCI-PSAR). Each can be applied multiple times on the same chart with different settings. Very easy to interpret. Confirm your BUY entries when most of the timeframes are showing green color. And confirm your SELL entries when most of the timeframes are showing red color. 2 Alert Options : input to s
FFx Watcher Pro MT5
Eric Venturi-Bloxs
The FFx Watcher PRO is a dashboard displaying on a single chart the current direction of up to 15 standard indicators and up to 21 timeframes. It has 2 different modes: Watcher mode: Multi Indicators User is able to select up to 15 indicators to be displayed User is able to select up to 21 timeframes to be displayed Watcher mode: Multi Pairs User is able to select any number of pairs/symbols User is able to select up to 21 timeframes to be displayed This mode uses one of the standard indicators
FFx Patterns Alerter gives trade suggestions with Entry, Target 1, Target 2 and StopLoss .... for any of the selected patterns (PinBar, Engulfing, InsideBar, OutsideBar) Below are the different options available: Multiple instances can be applied on the same chart to monitor different patterns Entry suggestion - pips to be added over the break for the entry 3 different options to calculate the SL - by pips, by ATR multiplier or at the pattern High/Low 3 different options to calculate the 2 TPs -
FFx Basket Scanner MT5
Eric Venturi-Bloxs
MetaTrader 4 version available here : https://www.mql5.com/en/market/product/24881 FFx Basket Scanner is a global tool scanning all pairs and all timeframes over up to five indicators among the 16 available. You will clearly see which currencies to avoid trading and which ones to focus on. Once a currency goes into an extreme zone (e.g. 20/80%), you can trade the whole basket with great confidence. Another way to use it is to look at two currencies (weak vs strong) to find the best single pairs
MetaTrader 4 version available here: https://www.mql5.com/en/market/product/25793 FFx Pivot SR Suite PRO is a complete suite for support and resistance levels. Support and Resistance are the most used levels in all kinds of trading. Can be used to find reversal trend, to set targets and stop, etc. The indicator is fully flexible directly from the chart 4 periods to choose for the calculation: 4Hours, Daily, Weekly and Monthly 4 formulas to choose for the calculation: Classic, Camarilla, Fibonac
제작자의 제품 더 보기
ATD Channel Pattern Detector는 차트에서 가격 채널을 직접 감지하고 그려주는 MetaTrader 5용 인디케이터입니다. ATD Channel Pattern Detector는 가격 움직임을 기반으로 가능한 상승 채널, 하락 채널, 수평 채널 구조를 식별하도록 설계된 시각적 기술 분석 도구입니다. 이 인디케이터는 과거 캔들을 스캔하고, 내부 패턴 감지 로직을 사용하여 채널 형성을 감지하며, 감지된 채널 라인을 차트에 표시합니다. 이 인디케이터는 Expert Advisor가 아닙니다. 거래를 열거나 닫거나 관리하지 않습니다. 차트만 분석하고 감지된 채널 구조를 시각적으로 표시합니다. 수동 차트 분석, 재량 거래, 시장 구조 검토 및 기술 분석 확인을 위한 추가 도구로 사용할 수 있습니다. 이 인디케이터는 강세, 약세 및 중립 구조에 대해 서로 다른 색상으로 감지된 채널을 표시할 수 있습니다. 또한 새로운 채널이 감지될 때 선택적으로 팝업 알림, 사운드 알림 및 이메일
Professional Renko Chart MT5 Professional Renko Chart MT5는 MetaTrader 5용 깔끔한 렌코 차트 지표로, 별도의 지표 창에 렌코 브릭을 표시하도록 설계되었습니다. 또한 선택적으로 메인 가격 차트 위에 렌코 박스를 직접 시각화할 수 있습니다. 이 지표는 MetaTrader 5 안에서 익숙한 렌코 차트 스타일을 사용하고 싶은 트레이더를 위해 제작되었습니다. TradingView와 같은 인기 있는 최신 차트 플랫폼에서 제공되는 렌코 차트 시각화와 유사한 방식으로, 일반적인 시간 기반 캔들을 렌코 브릭으로 변환하고 그 결과를 단순하고 명확하며 실용적인 형식으로 표시합니다. 여러 개의 일반 차트 캔들이 하나의 렌코 브릭을 만들 수 있습니다. Professional Renko Chart MT5는 메인 가격 차트 위에 렌코 박스를 표시할 수도 있으며, 각 렌코 브릭을 형성하는 데 사용된 일반 캔들의 개수도 보여줄 수 있습니다. 이 지표는 Exp
필터:
리뷰 없음
리뷰 답변