Multi RSI Dashboard
- Indicators
- Version: 1.0

Multi RSI Dashboard
Multi-symbol scanner based on RSI. Monitors up to 12 instruments across all timeframes simultaneously — everything in one panel directly on the chart.
Who it is for
For traders who use RSI and are tired of switching between dozens of charts looking for an entry. The panel shows the complete market picture — at a glance.
How it works
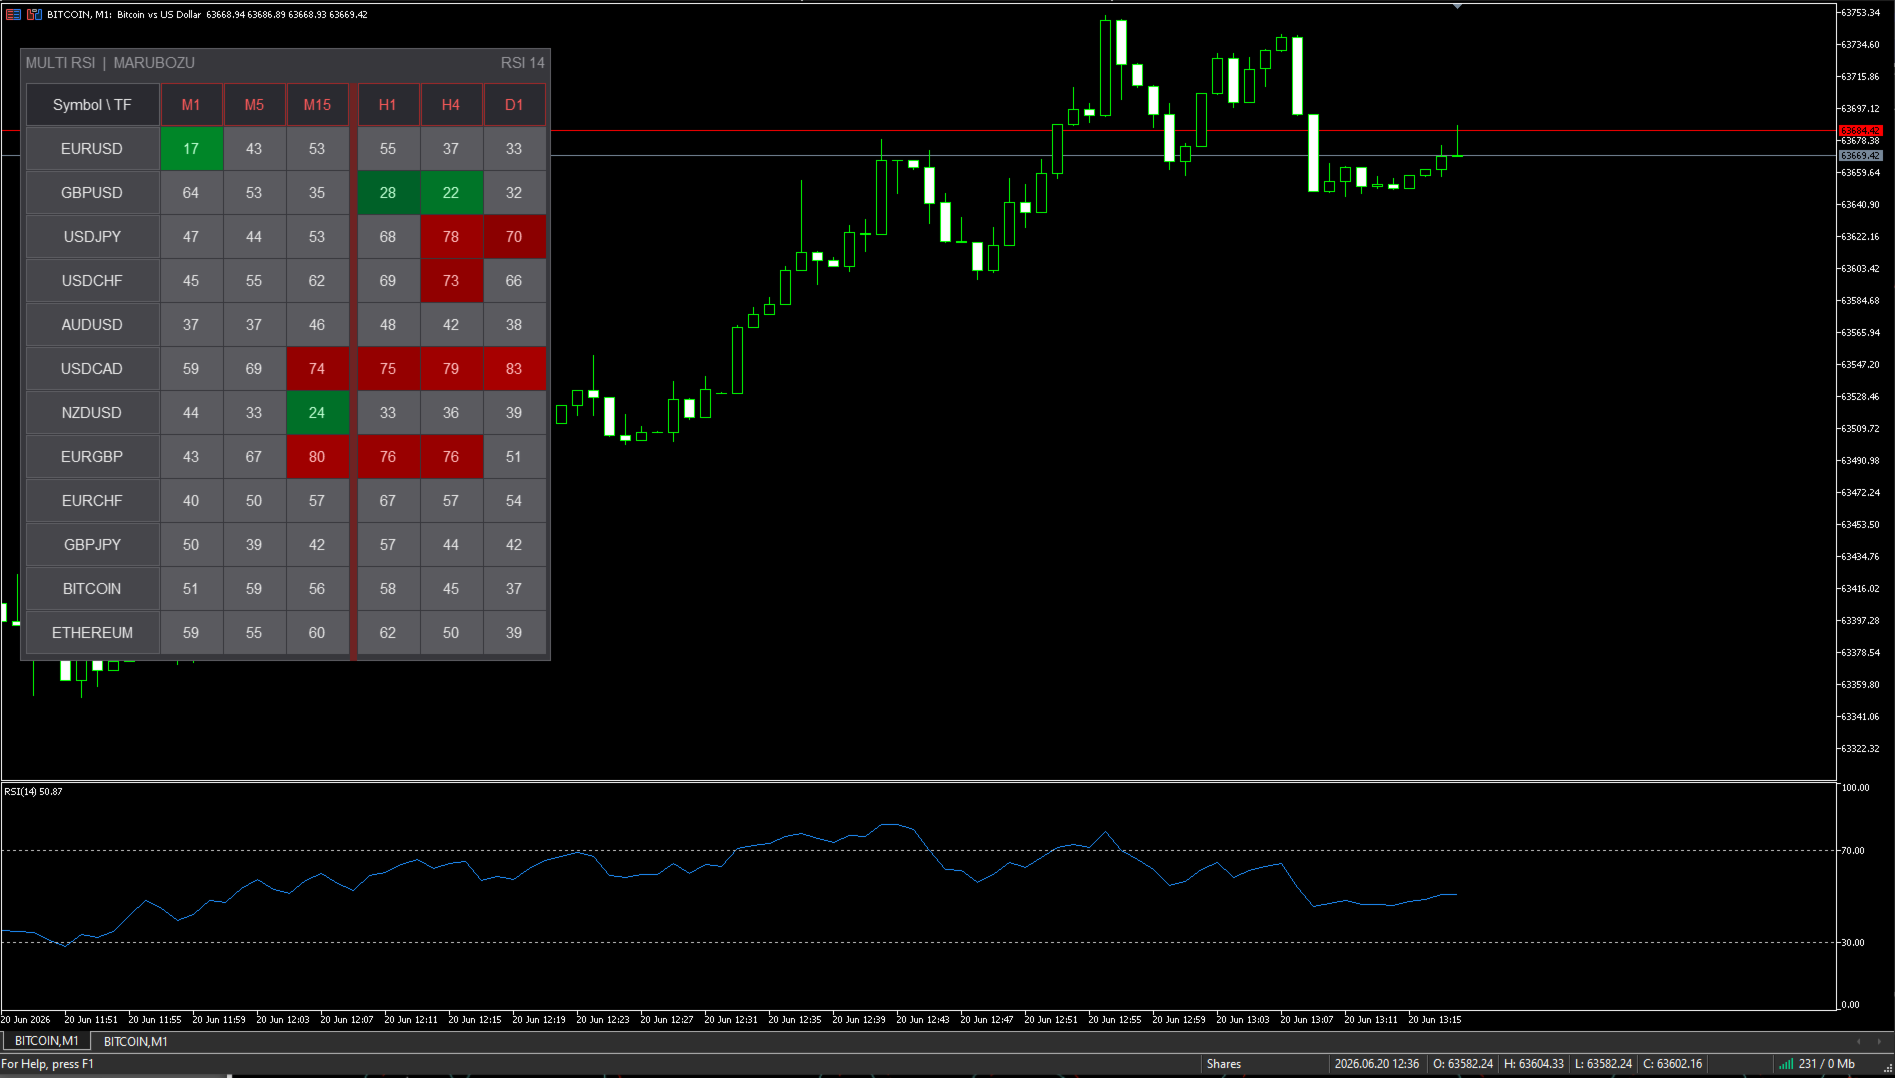
A table appears on the chart: instruments on the vertical axis, timeframes on the horizontal axis. Each cell shows the current RSI value and is colored by zone:
• Green — oscillator in the oversold zone. The brighter the color, the deeper in the zone.
• Red — oscillator in the overbought zone. Color intensity reflects signal strength.
• Gray — neutral zone, waiting.
When several timeframes of the same instrument show the same direction — that is the moment for analysis.
Panel features
The panel is drawn via Canvas — no flickering or lag. Three color schemes: Dark, Medium, Light. Font size is adjustable. The panel can be dragged anywhere on the screen with the mouse.
Click on an instrument name — instantly switches the current chart to it.
Multiple copies
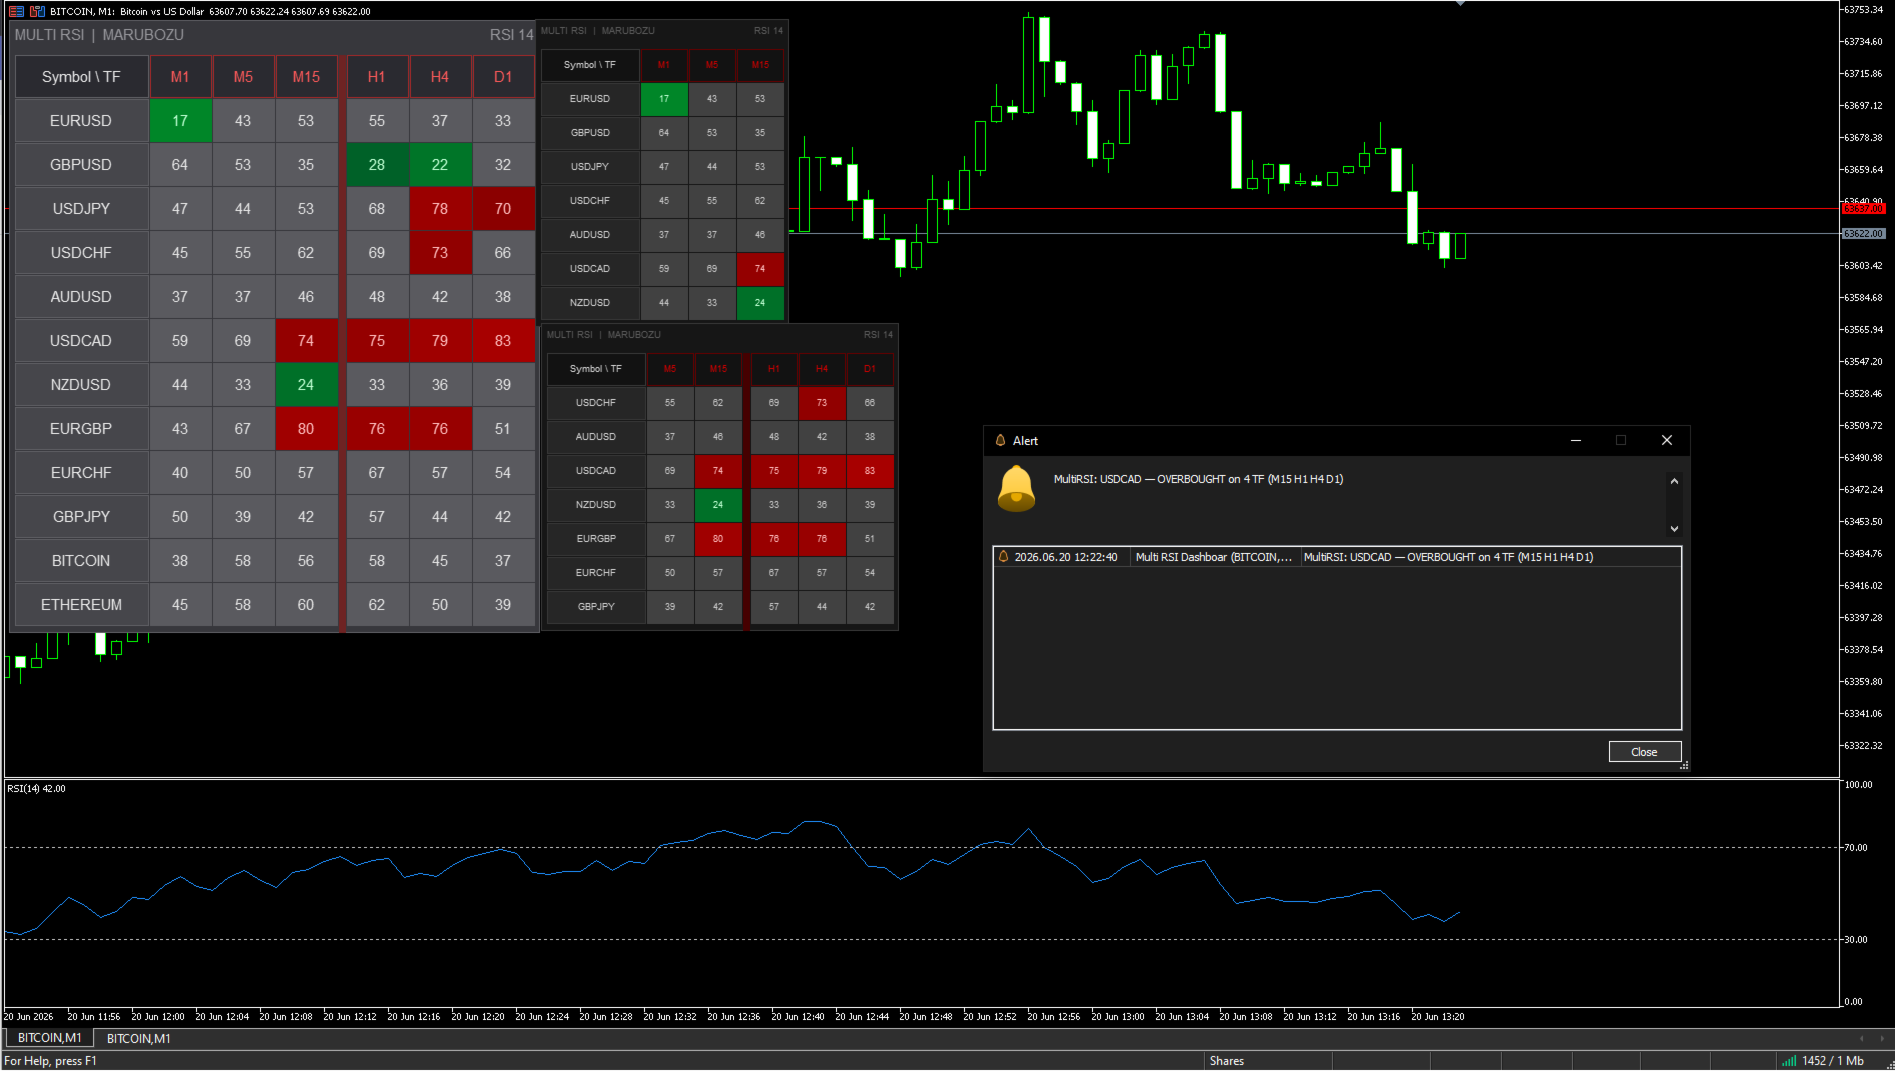
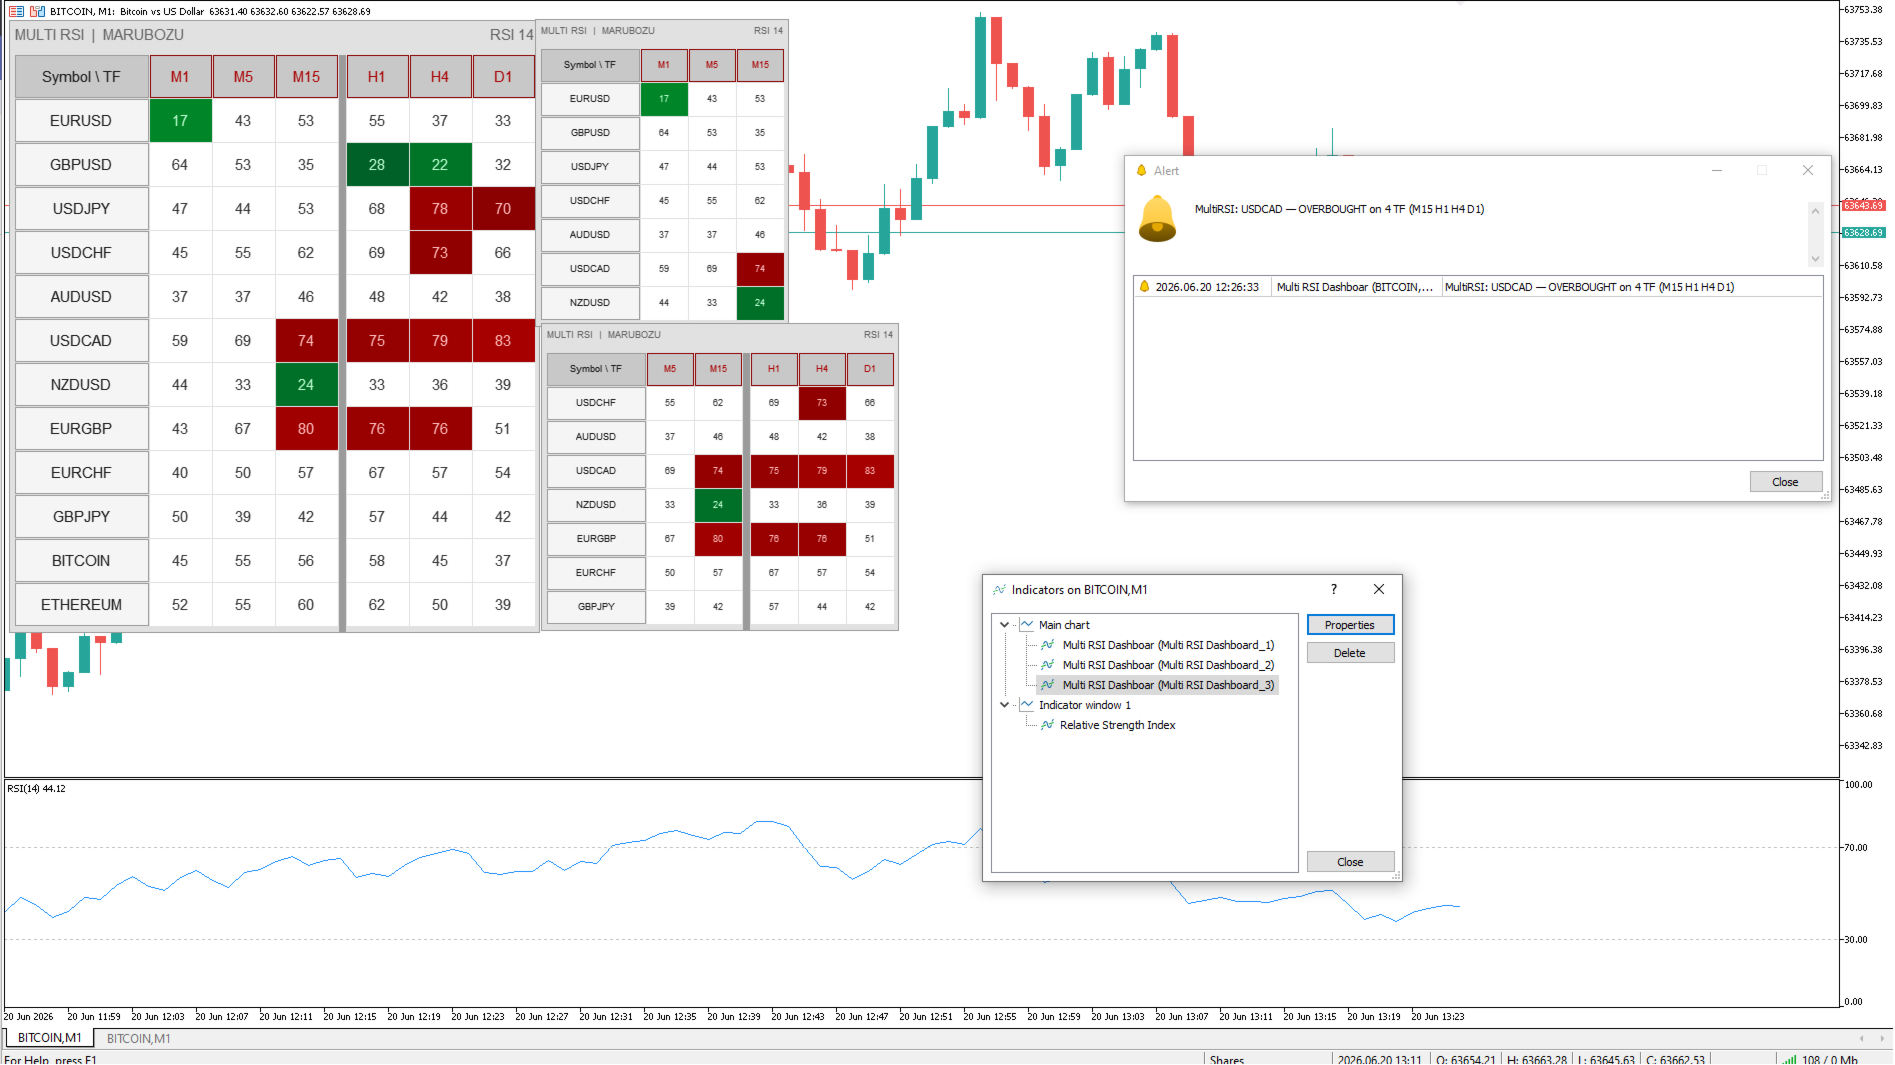
You can run as many copies of the indicator on one chart as needed — for example with different RSI periods side by side. Each copy requires a unique Instance ID: 1 for the first, 2 for the second, and so on. Each panel position is saved separately.
Alerts
A notification is sent once — at the moment a new signal appears. No repeated messages until the signal changes. Three notification types: Popup, Push, Email.
Parameters
• RSI — period, applied price, overbought and oversold levels.
• Timeframes — M1, M5, M15, M30, H1, H4, D1, W1, MN — each enabled separately.
• Symbols — up to 12 instruments, default is the main forex pairs.
• Table — anchor corner, X/Y position, font size (5–30), color scheme.
• Alerts — notification type, minimum timeframes, alert on start.
• General — Instance ID for running multiple copies simultaneously (1, 2, 3...).
Symbol names depend on the broker. If a symbol shows (--) on higher timeframes — open its chart manually on the required timeframe. MT5 will load the history and data will appear within a few seconds.
If the indicator turned out to be useful — leave a review. It helps the project grow and new tools to appear.