SecondScope MT5 Seconds Chart for MetaTrader 5
- Utilities
- Version: 1.15
- Updated: 4 May 2026
- Activations: 20

SecondScope MT5 - Seconds Chart for MetaTrader 5
Seconds Chart - where the market is usually hidden
Most traders work with what standard timeframes show them: M1, M5, M15.
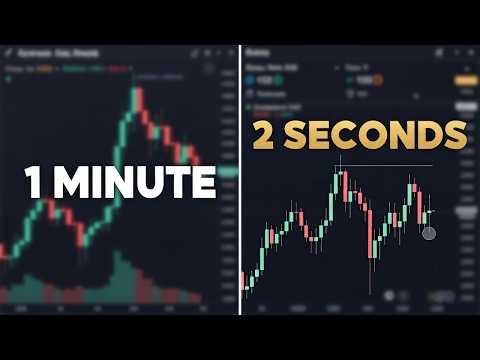
But between these candles there is time the market actually lives through - and the platform simply does not display it.
This is the blind spot.
Seconds charts reveal this hidden part of the market.
They show price movement with second-level resolution, making visible a structure that is completely hidden on minute and higher timeframes.
SecondScope is a full-featured chart
Seconds charts work just like standard MetaTrader 5 charts:
-
any indicators can be applied,
-
expert advisors can be launched,
-
templates can be used,
-
all standard MT5 analysis tools are available.
No limitations.
You work with seconds-based timeframes the same way as with M1 or H1 -
the only difference is a deeper level of data detail.
The MT5 Strategy Tester does not support opening custom charts (in this case, second-based charts opened via timeframe buttons) or interacting with them.
Therefore, second-based timeframes are intended for analysis on live charts rather than for visual evaluation in the Strategy Tester.
A more precise view of price behavior
On seconds charts, you can see what appears as a single candle on a minute chart:
-
micro-movements inside an impulse,
-
real price behavior before an entry,
-
moments where the market hesitates rather than moves.
This allows you to:
-
refine entry timing,
-
better assess risk,
-
understand what is actually happening inside a candle instead of guessing.
Working with market blind spots
Minute charts smooth reality.
Seconds charts reveal it.
With seconds-based charts, traders begin to see:
-
where price truly accelerates,
-
where movement loses strength,
-
where zones form that appear as “noise” on higher timeframes.
This helps reduce uncertainty in market analysis.
Who this tool is for
Seconds charts are especially useful for:
-
scalping,
-
intraday trading,
-
precise entry timing,
-
analysis of volatile instruments (Forex, cryptocurrencies, stocks).
If it matters to you not only where price moved, but how it moved there, seconds timeframes provide an additional level of control.
Summary
Seconds charts fill the blind zone between candles.
You continue using familiar MT5 tools -
but see more detail where there used to be empty space.
User Guide
After installing the expert advisor, specify the required seconds-based timeframes in the Timeframes in seconds parameter.
Timeframes are entered in seconds, separated by commas.
Example: 1,5,10,30,60
After launching the expert advisor, buttons with the specified values automatically appear on the chart.
Clicking a button opens a chart with the corresponding seconds timeframe.
To add or modify timeframes:
-
Open the expert advisor parameters
-
Add the required values separated by commas
-
Click OK
The buttons and available seconds charts will update automatically.
Additional Parameters
-
History depth in seconds - the amount of historical data loaded (default is 24 hours).
Defines the period used to build the seconds chart. -
Button X / Button Y - button position on the screen.
Allows you to place buttons in a convenient area of the chart. -
Button width / Button height - button size.
-
Button color / Button text color - button and text colors.
-
Price line color - color of the current price line on the seconds chart.